Metadata Report for BODC Series Reference Number 1371585
Metadata Summary
Problem Reports
Data Access Policy
Narrative Documents
Project Information
Data Activity or Cruise Information
Fixed Station Information
BODC Quality Flags
SeaDataNet Quality Flags
Metadata Summary
Data Description |
|||||||||||||||||||||||||||||||||||||||||||||||||||||||||
|
|||||||||||||||||||||||||||||||||||||||||||||||||||||||||
Data Identifiers |
|||||||||||||||||||||||||||||||||||||||||||||||||||||||||
|
|||||||||||||||||||||||||||||||||||||||||||||||||||||||||
Time Co-ordinates(UT) |
|||||||||||||||||||||||||||||||||||||||||||||||||||||||||
|
|||||||||||||||||||||||||||||||||||||||||||||||||||||||||
Spatial Co-ordinates | |||||||||||||||||||||||||||||||||||||||||||||||||||||||||
|
|||||||||||||||||||||||||||||||||||||||||||||||||||||||||
Parameters |
|||||||||||||||||||||||||||||||||||||||||||||||||||||||||
|
|||||||||||||||||||||||||||||||||||||||||||||||||||||||||
|
|||||||||||||||||||||||||||||||||||||||||||||||||||||||||
Problem Reports
No Problem Report Found in the Database
Data Access Policy
Open Data supplied by Natural Environment Research Council (NERC)
You must always use the following attribution statement to acknowledge the source of the information: "Contains data supplied by Natural Environment Research Council."
Narrative Documents
Sea-Bird Dissolved Oxygen Sensor SBE 43 and SBE 43F
The SBE 43 is a dissolved oxygen sensor designed for marine applications. It incorporates a high-performance Clark polarographic membrane with a pump that continuously plumbs water through it, preventing algal growth and the development of anoxic conditions when the sensor is taking measurements.
Two configurations are available: SBE 43 produces a voltage output and can be incorporated with any Sea-Bird CTD that accepts input from a 0-5 volt auxiliary sensor, while the SBE 43F produces a frequency output and can be integrated with an SBE 52-MP (Moored Profiler CTD) or used for OEM applications. The specifications below are common to both.
Specifications
| Housing | Plastic or titanium |
| Membrane | 0.5 mil- fast response, typical for profile applications 1 mil- slower response, typical for moored applications |
| Depth rating | 600 m (plastic) or 7000 m (titanium) 10500 m titanium housing available on request |
| Measurement range | 120% of surface saturation |
| Initial accuracy | 2% of saturation |
| Typical stability | 0.5% per 1000 h |
Further details can be found in the manufacturer's specification sheet.
Instrument Description for DY008 CTD
CTD Unit and Auxiliary Sensors
The CTD unit comprised a Sea-Bird Electronics (SBE) 9plus underwater unit, an SBE 11plus deck unit, a 24-way SBE 32 carousel and 24 10 L TMF Water Samplers; all of which were mounted on a titanium 24-way CTD frame. Attached to the CTD were two SBE 3P temperature sensors, two SBE 4C conductivity sensors, one Paroscientific Digiquartz pressure sensor, one SBE 43 dissolved oxygen sensor, one Chelsea Technology Group (CTG) 2-π PAR sensor, one WETLabs BBRTD light scattering sensor, one Benthos 916T altimeter one CTG Aquatracka MKIII fluorometer and one CTG Alphatracka MKII transmissometer. The WETLabs BBRTD gave suspect readings during the first three deployments, so it was replaced by a backup instrument between casts three and four. The altimeter cable was also replaced at the same time as it gave erratic readings during casts one to three.
| Sensor unit | Model | Serial number | Full specification | Calibration dates (YYYY/MM/DD) | Comments |
|---|---|---|---|---|---|
| CTD underwater unit | SBE 9plus | 09P-71442-1142 (Ti) | SBE 9plus | - | - |
| CTD deck unit | SBE 11plus | 11P-34173-0676 | - | - | - |
| Carousel | SBE 32 - 24 Position Pylon | 32-37898-0518 | SBE 32 | - | - |
| Pressure sensor | Paroscientific Digiquartz | 124216 | Paroscientific Digiquartz | 2013-03-12 | - |
| Temperature sensor | SBE 3P | 3P-5494 (Ti) | SBE 03P | 2013-10-18 | - |
| Temperature sensor | SBE 3P | 3P-5785 (Ti) | - | 2013-02-28 | - |
| Conductivity senor | SBE 4C | 4C-2164 (Ti) | SBE 04C | 2013-08-07 | - |
| Conductivity sensor | SBE 4C | 4C-4140 (Ti) | - | 2013-02-21 | - |
| Dissolved oxygen sensor | SBE 43 | 43-2055 | SBE 43 | 2013-07-23 | - |
| Altimeter | Benthos PSA 916T | 59493 | Benthos Altimeter | - | - |
| Irradiance sensor (DWIRR) | CTG 2-π PAR | PAR 04 (Ti) | CTG 2-π PAR | 2013-11-21 | Measuring downwelling irradiance |
| Light scattering sensor | WETLabs BBRTD | Casts 1-3: 1055Casts 4-14: 182 | WETLabs BBRTD | 2013-03-132013-09-05 | - |
| Fluorometer | Chelsea MKIII Aquatracka | 88-2615-124 | Chelsea MKII Aquatracka | 2012-10-19 | - |
| Transmissometer | Chelsea MKII Alphatracka - 25 cm path | 07-6075-001 | Alphatracka MKII | 2012-05-08 | - |
Sea-Bird Electronics SBE 911 and SBE 917 series CTD profilers
The SBE 911 and SBE 917 series of conductivity-temperature-depth (CTD) units are used to collect hydrographic profiles, including temperature, conductivity and pressure as standard. Each profiler consists of an underwater unit and deck unit or SEARAM. Auxiliary sensors, such as fluorometers, dissolved oxygen sensors and transmissometers, and carousel water samplers are commonly added to the underwater unit.
Underwater unit
The CTD underwater unit (SBE 9 or SBE 9 plus) comprises a protective cage (usually with a carousel water sampler), including a main pressure housing containing power supplies, acquisition electronics, telemetry circuitry, and a suite of modular sensors. The original SBE 9 incorporated Sea-Bird's standard modular SBE 3 temperature sensor and SBE 4 conductivity sensor, and a Paroscientific Digiquartz pressure sensor. The conductivity cell was connected to a pump-fed plastic tubing circuit that could include auxiliary sensors. Each SBE 9 unit was custom built to individual specification. The SBE 9 was replaced in 1997 by an off-the-shelf version, termed the SBE 9 plus, that incorporated the SBE 3 plus (or SBE 3P) temperature sensor, SBE 4C conductivity sensor and a Paroscientific Digiquartz pressure sensor. Sensors could be connected to a pump-fed plastic tubing circuit or stand-alone.
Temperature, conductivity and pressure sensors
The conductivity, temperature, and pressure sensors supplied with Sea-Bird CTD systems have outputs in the form of variable frequencies, which are measured using high-speed parallel counters. The resulting count totals are converted to numeric representations of the original frequencies, which bear a direct relationship to temperature, conductivity or pressure. Sampling frequencies for these sensors are typically set at 24 Hz.
The temperature sensing element is a glass-coated thermistor bead, pressure-protected inside a stainless steel tube, while the conductivity sensing element is a cylindrical, flow-through, borosilicate glass cell with three internal platinum electrodes. Thermistor resistance or conductivity cell resistance, respectively, is the controlling element in an optimized Wien Bridge oscillator circuit, which produces a frequency output that can be converted to a temperature or conductivity reading. These sensors are available with depth ratings of 6800 m (aluminium housing) or 10500 m (titanium housing). The Paroscientific Digiquartz pressure sensor comprises a quartz crystal resonator that responds to pressure-induced stress, and temperature is measured for thermal compensation of the calculated pressure.
Additional sensors
Optional sensors for dissolved oxygen, pH, light transmission, fluorescence and others do not require the very high levels of resolution needed in the primary CTD channels, nor do these sensors generally offer variable frequency outputs. Accordingly, signals from the auxiliary sensors are acquired using a conventional voltage-input multiplexed A/D converter (optional). Some Sea-Bird CTDs use a strain gauge pressure sensor (Senso-Metrics) in which case their pressure output data is in the same form as that from the auxiliary sensors as described above.
Deck unit or SEARAM
Each underwater unit is connected to a power supply and data logging system: the SBE 11 (or SBE 11 plus) deck unit allows real-time interfacing between the deck and the underwater unit via a conductive wire, while the submersible SBE 17 (or SBE 17 plus) SEARAM plugs directly into the underwater unit and data are downloaded on recovery of the CTD. The combination of SBE 9 and SBE 17 or SBE 11 are termed SBE 917 or SBE 911, respectively, while the combinations of SBE 9 plus and SBE 17 plus or SBE 11 plus are termed SBE 917 plus or SBE 911 plus.
Specifications
Specifications for the SBE 9 plus underwater unit are listed below:
| Parameter | Range | Initial accuracy | Resolution at 24 Hz | Response time |
|---|---|---|---|---|
| Temperature | -5 to 35°C | 0.001°C | 0.0002°C | 0.065 sec |
| Conductivity | 0 to 7 S m-1 | 0.0003 S m-1 | 0.00004 S m-1 | 0.065 sec (pumped) |
| Pressure | 0 to full scale (1400, 2000, 4200, 6800 or 10500 m) | 0.015% of full scale | 0.001% of full scale | 0.015 sec |
Further details can be found in the manufacturer's specification sheet.
Aquatracka fluorometer
The Chelsea Instruments Aquatracka is a logarithmic response fluorometer. It uses a pulsed (5.5 Hz) xenon light source discharging between 320 and 800 nm through a blue filter with a peak transmission of 420 nm and a bandwidth at half maximum of 100 nm. A red filter with sharp cut off, 10% transmission at 664 nm and 678 nm, is used to pass chlorophyll-a fluorescence to the sample photodiode.
The instrument may be deployed either in a through-flow tank, on a CTD frame or moored with a data logging package.
Further details can be found in the manufacturer's specification sheet.
Chelsea Technologies Group Aquatracka MKIII fluorometer
The Chelsea Technologies Group Aquatracka MKIII is a logarithmic response fluorometer. Filters are available to enable the instrument to measure chlorophyll, rhodamine, fluorescein and turbidity.
It uses a pulsed (5.5 Hz) xenon light source discharging along two signal paths to eliminate variations in the flashlamp intensity. The reference path measures the intensity of the light source whilst the signal path measures the intensity of the light emitted from the specimen under test. The reference signal and the emitted light signals are then applied to a ratiometric circuit. In this circuit, the ratio of returned signal to reference signal is computed and scaled logarithmically to achieve a wide dynamic range. The logarithmic conversion accuracy is maintained at better than one percent of the reading over the full output range of the instrument.
Two variants of the instrument are available, both manufactured in titanium, capable of operating in depths from shallow water down to 2000 m and 6000 m respectively. The optical characteristics of the instrument in its different detection modes are visible below:
| Excitation | Chlorophyll a | Rhodamine | Fluorescein | Turbidity |
|---|---|---|---|---|
| Wavelength (nm) | 430 | 500 | 485 | 440* |
| Bandwidth (nm) | 105 | 70 | 22 | 80* |
| Emission | Chlorophyll a | Rhodamine | Fluorescein | Turbidity |
| Wavelength (nm) | 685 | 590 | 530 | 440* |
| Bandwidth (nm) | 30 | 45 | 30 | 80* |
* The wavelengths for the turbidity filters are customer selectable but must be in the range 400 to 700 nm. The same wavelength is used in the excitation path and the emission path.
The instrument measures chlorophyll a, rhodamine and fluorescein with a concentration range of 0.01 µg l-1 to 100 µg l-1. The concentration range for turbidity is 0.01 to 100 FTU (other wavelengths are available on request).
The instrument accuracy is ± 0.02 µg l-1 (or ± 3% of the reading, whichever is greater) for chlorophyll a, rhodamine and fluorescein. The accuracy for turbidity, over a 0 - 10 FTU range, is ± 0.02 FTU (or ± 3% of the reading, whichever is greater).
Further details are available from the Aquatracka MKIII specification sheet.
Chelsea Technologies Photosynthetically Active Radiation (PAR) Irradiance Sensor
This sensor was originally designed to assist the study of marine photosynthesis. With the use of logarithmic amplication, the sensor covers a range of 6 orders of magnitude, which avoids setting up the sensor range for the expected signal level for different ambient conditions.
The sensor consists of a hollow PTFE 2-pi collector supported by a clear acetal dome diverting light to a filter and photodiode from which a cosine response is obtained. The sensor can be used in moorings, profiling or deployed in towed vehicles and can measure both upwelling and downwelling light.
Specifications
| Operation depth | 1000 m |
| Range | 2000 to 0.002 µE m-2 s-1 |
| Angular Detection Range | ± 130° from normal incidence |
| Relative Spectral Sensitivity | flat to ± 3% from 450 to 700 nm down 8% of 400 nm and 36% at 350 nm |
Further details can be found in the manufacturer's specification sheet.
WETLabs Single-angle Backscattering Meter ECO BB
An optical scattering sensor that measures scattering at 117°. This angle was determined as a minimum convergence point for variations in the volume scattering function induced by suspended materials and water. The measured signal is less determined by the type and size of the materials in the water and is more directly correlated to their concentration.
Several versions are available, with minor differences in their specifications:
- ECO BB(RT)provides analog or RS-232 serial output with 4000 count range
- ECO BB(RT)D adds the possibility of being deployed in depths up to 6000 m while keeping the capabilities of ECO BB(RT)
- ECO BB provides the capabilities of ECO BB(RT) with periodic sampling
- ECO BBB is similar to ECO BB but with internal batteries for autonomous operation
- ECO BBS is similar to ECO BB but with an integrated anti-fouling bio-wiper
- ECO BBSB has the capabilities of ECO BBS but with internal batteries for autonomous operation
Specifications
| Wavelength | 471, 532, 660 nm |
| Sensitivity (m-1 sr-1) | 1.2 x 10⁻⁵ at 470 nm 7.7 x 10⁻⁶ at 532 nm 3.8 x 10⁻⁶ at 660 nm |
| Typical range | ~0.0024 to 5 m-1 |
| Linearity | 99% R2 |
| Sample rate | up to 8Hz |
| Temperature range | 0 to 30°C |
| Depth rating | 600 m (standard) 6000 m (deep) |
Further details can be found in the manufacturer's specification sheet.
Paroscientific Absolute Pressure Transducers Series 3000 and 4000
Paroscientific Series 3000 and 4000 pressure transducers use a Digiquartz pressure sensor to provide high accuracy and precision data. The sensor comprises a quartz crystal resonator that responds to pressure-induced stress, and temperature is measured for thermal compensation of the calculated pressure.
The 3000 series of transducers includes one model, the 31K-101, whereas the 4000 series includes several models, listed in the table below. All transducers exhibit repeatability of better than ±0.01% full pressure scale, hysteresis of better than ±0.02% full scale and acceleration sensitivity of ±0.008% full scale /g (three axis average). Pressure resolution is better than 0.0001% and accuracy is typically 0.01% over a broad range of temperatures.
Differences between the models lie in their pressure and operating temperature ranges, as detailed below:
| Model | Max. pressure (psia) | Max. pressure (MPa) | Temperature range (°C) |
|---|---|---|---|
| 31K-101 | 1000 | 6.9 | -54 to 107 |
| 42K-101 | 2000 | 13.8 | 0 to 125 |
| 43K-101 | 3000 | 20.7 | 0 to 125 |
| 46K-101 | 6000 | 41.4 | 0 to 125 |
| 410K-101 | 10000 | 68.9 | 0 to 125 |
| 415K-101 | 15000 | 103 | 0 to 50 |
| 420K-101 | 20000 | 138 | 0 to 50 |
| 430K-101 | 30000 | 207 | 0 to 50 |
| 440K-101 | 40000 | 276 | 0 to 50 |
Further details can be found in the manufacturer's specification sheet.
Originator's processing document for DY008 CTD data
Sampling strategy
A total of 14 CTD casts were performed during DY008 which sailed from Southampton on 18 March 2014 and docked in Southampton on 13 April 2014, and was tasked with investigating the benthic work package (Work Package II) of the Shelf Seas Biogeochemistry project in the Celtic Sea.
Data Processing
For each CTD cast the following raw data files were generated:
- DY008_XYZ.bl (a record of bottle firing locations)
- DY008_XYZ.hdr (header file)
- DY008_XYZ.hex (raw data file)
- DY008_XYZ.con (configuration file)
where XYZ is the cast number of the CTD data series.
The following processing was performed by the Originator using the SBE Data Processing software (Seasave Version 7.23.2):
- DatCnv was used to read in the raw CTD data file (.hex) which contained the data in engineering units and apply calibrations as appropriate through the instrument configurations (.con) file.
- Bottle Summary was run to create a .btl file containing the average, standard deviation, min and max values recorded by the CTD instrument suite at bottle firings.
- Wild Edit was run to remove spikes in the pressure channel.
- Filter was run on the pressure channel to smooth out the high frequency data
- After examining the data recorded during four casts (one, two, seven and 14) the originator used AlignCTD to advance the oxygen data by two seconds. AlignCTD was also used to move the conductivity data backwards by one scan (0.0417 seconds), as after testing several values this adjustment resulted in the fewest number of spikes in the salinity channel.
- CellTM was run using alpha = 0.03 and 1/beta = 7, to correct for conductivity errors induced by the transfer of heat from the conductivity cell to the seawater.
- Derive was run to create the variables Salinity, Salinity 2, Oxygen SBE 43 and Oxygen Tau correction. The output file was then saved as DY008_XYZ_derive.cnv.
- BinAverage and Strip were run to average the data to 2Hz bins (0.5 seconds) and to remove the salinity and oxygen channels which were created when Derive was run. The output file was then saved as DY008_XYZ_derive_2Hz.cnv.
The originator then proceeded to process the data further in Matlab.
- The data from the 2HZ and 24HZ processed CTD data files were extracted and combined with metadata from the Event log to create .mat files for each series at both 2HZ and 24 HZ resolutions.
- Inspection of the raw turbidity data revealed that there was a bug in the Seasave DatCnv conversion module which resulted in it incorrectly converting the raw turbidity voltage into m-1 sr-1. Therefore, the originator re-derived turbidity manually using the following equation (SF = scale factor, DC = dark counts):
CTDturb = CTDturb_raw x SF - (SF x DC)
- The originator manually inspected the 2Hz data files to identify the surface soak and then cropped the 2Hz and 24Hz data files to remove the surface soak from the data.
- The salinity, conductivity, temperature, oxygen, attenuation, turbidity and fluorescence channels in the 24Hz data files were all de-spiked using an automated routine, with the originator converting the spikes to NaN (not a number) values.
- Further manual de-spiking was carried out to identify larger periods of bad data.
- The 24Hz data were averaged into one decibar downcast only bins and liner interpolation was used to fill gaps in the profile.
- All channels except PAR were smoothed further using a 10 m running median.
- The salinity data were then calibrated using salinity samples collected by the CTD water bottles and analysed on a Guildline Autosal salinometer. The chlorophyll fluresence data were calibrated against CTD chlorophyll samples.
- It was this calibrated version of the data which were then ingested by BODC, although all other versions have been archived and are available on request.
Field Calibrations
Salinity
29 usable salinity samples were collected from CTD water bottle samples during DY008 and analysed on a Guildline Autosal salinometer (SN 71126). Using all samples the mean and standard deviation of residuals from the primary and secondary sensors were calculated as 0.0018586 ± 0.0020348 and 0.0043345 ± 0.0021767 respectively. After removing the outliers where the difference between Autosal and CTD values was greater than two standard deviations, the mean for the primary and secondary sensors was reduced to 0.0013423 ± 0.001392 and 0.0039815 ± 0.0017942 respectively. These mean values were then used to correct the CTD salinity channels.
Chlorophyll
A total of 24 samples were collected from CTD water bottle samples to calibrate the chlorophyll flurometer. The originator used a linear regression to calibrate the chlorophyll fluorometer against the 39 chlorophyll samples, with the following calibration equation being used to calibrate the fluorometer:
CHL = 3.0178 x CTDfluor - 0.13846
R2 = 0.87469
More information on the processing carried out and calibrations applied by the data originator the can be found in the data originator's CTD Processing Report.
Processing by BODC of RRS Discovery DY008 CTD data
Several versions of the CTD data recorded during DY008 arrived at BODC in the form of ASCII and Matlab (.MAT) files. In addition to the raw CTD data, BODC were provided with the 24 Hz and 2 Hz versions created at the end of the originator's Seasave processing and at each subsequent stage of Matlab processing. The fully calibrated CTD data binned to 1db downcast bins were then reformatted to BODC's internal NetCDF format. The following table shows the mapping of the originator's variables to the appropriate BODC parameter codes:
| Originator's Variable | Units | Description | BODC Parameter Code | Units | Comment |
|---|---|---|---|---|---|
| pres | db | Pressure (spatial co-ordinate) exerted by the water body by profiling pressure sensor and corrected to read zero at sea level | PRESPR01 | Decibars | - |
| time | elapsed [seconds] | - | - | - | This variable was not transferred |
| temp1 | ITS-90, deg C | Temperature of the water body | TEMPPR01 | °C | - |
| temp2 | ITS-90, deg C | - | - | - | This parameter was transferred then dropped following screening as there was no difference between the quality of the data from the first and second temperature sensors |
| cond1 | S m-1 | Electrical conductivity of the water body by CTD | CNDCST01 | S m-1 | - |
| cond2 | S m-1 | - | - | - | This parameter was transferred then dropped following screening as there was no difference between the quality of the data from the first and second temperature sensors |
| sal1 | PSU, PSS-78 | Practical salinity of the water body by CTD and computation using UNESCO 1983 algorithm | PSALST01 | Dimensionless | Derived from temp1 and cond1 |
| sal2 | PSU, PSS-78 | - | - | - | This parameter was transferred then dropped following screening as there was no difference between the quality of the data from the first and second temperature sensors |
| oxy_umoll | µ mol l-1 | Concentration of oxygen {O2 CAS 7782-44-7} per unit volume of the water body [dissolved plus reactive particulate phase] by in-situ sensor | DOXYZZ01 | µ mol l-1 | - |
| fluor | µ g l-1 | Concentration of chlorophyll-a {chl-a CAS479-61-8} per unit volume of the water body [particulate >unknown phase] by in-situ chlorophyll fluorometer and calibration against sample data | CPHLPS01 | mg m-3 | µ g l-1 = mg m-3 |
| par | W m-2 | Downwelling 2-pi scalar irradiance as energy (PAR wavelengths) in the water body by 2-pi scalar radiometer | DWIRPP01 | W m-2 | - |
| att | m -1 | Attenuance (red light wavelength) per unit length of the water body by 20 or 25cm path length transmissometer | ATTNMR01 | m -1 | - |
| sigma_theta | - | - | - | - | This variable was not transferred. BODC independently derive density during transfer |
| turb | m-1 sr-1 | Attenuance due to backscatter (660 nm wavelength at 117 degree incidence) by the water body [particulate >unknown phase] by in-situ optical backscatter measurement | BB117R01 | m-1 nm -1 sr-1 | Casts 04 to 14 only. m-1 sr-1 = m-1 nm -1 sr-1 |
| turb | m-1 sr-1 | Attenuance due to backscatter (650 nm wavelength at 117 degree incidence) by the water body [particulate >unknown phase] by in-situ optical backscatter measurement | BB117R02 | m-1 nm -1 sr-1 | Casts 01 to 03 only. m-1 sr-1 = m-1 nm -1 sr-1 |
The following additional parameters were derived when the data were converted into QXF format:
| Originator's Variable | Units | Description | BODC Parameter Code | Units | Comment |
|---|---|---|---|---|---|
| - | - | Potential temperature of the water body by computation using UNESCO 1983 algorithm | POTMCV01 | °C | Derived from TEMPPR01, PSALST01 and PRESPR01 |
| - | - | Sigma-theta of the water body by CTD and computation from salinity and potential temperature using UNESCO algorithm | SIGTPR01 | kg m-3 | Derived from POTMCV01, PSALST01 and PRESPR01 |
| - | - | Saturation of oxygen {O2} in the water body [dissolved plus reactive particulate phase] | OXYSZZ01 | % | Derived from TEMPST01, PSALST01 and DOXYZZ01 |
The reformatted data were visualised using the in-house EDSERPLO software. Suspect data were marked by adding an appropriate quality control flag, and missing data by setting the data to an appropriate value and applying the quality control flag.
Project Information
Shelf Sea Biogeochemistry (SSB) Programme
Shelf Sea Biogeochemistry (SSB) is a £10.5 million, six-year (2011-2017) research programme, jointly funded by the Natural Environment Research Council (NERC) and the Department for Environment, Food and Rural Affairs (DEFRA). The aim of the research is to reduce the uncertainty in our understanding of nutrient and carbon cycling within the shelf seas, and of their role in global biogeochemical cycles. SSB will also provide effective policy advice and make a significant contribution to the Living with Environmental Change programme.
Background
The Shelf Sea Biogeochemistry research programme directly relates to the delivery of the NERC Earth system science theme and aims to provide evidence that supports a number of marine policy areas and statutory requirements, such as the Marine Strategy Framework Directive and Marine and Climate Acts.
The shelf seas are highly productive compared to the open ocean, a productivity that underpins more than 90 per cent of global fisheries. Their importance to society extends beyond food production to include issues of biodiversity, carbon cycling and storage, waste disposal, nutrient cycling, recreation and renewable energy resources.
The shelf seas have been estimated to be the most valuable biome on Earth, but they are under considerable stress, as a result of anthropogenic nutrient loading, overfishing, habitat disturbance, climate change and other impacts.
However, even within the relatively well-studied European shelf seas, fundamental biogeochemical processes are poorly understood. For example: the role of shelf seas in carbon storage; in the global cycles of key nutrients (nitrogen, phosphorus, silicon and iron); and in determining primary and secondary production, and thereby underpinning the future delivery of many other ecosystem services.
Improved knowledge of such factors is not only required by marine policymakers; it also has the potential to increase the quality and cost-effectiveness of management decisions at the local, national and international levels under conditions of climate change.
The Shelf Sea Biogeochemistry research programme will take a holistic approach to the cycling of nutrients and carbon and the controls on primary and secondary production in UK and European shelf seas, to increase understanding of these processes and their role in wider biogeochemical cycles. It will thereby significantly improve predictive marine biogeochemical and ecosystem models over a range of scales.
The scope of the programme includes exchanges with the open ocean (transport on and off the shelf to a depth of around 500m), together with cycling, storage and release processes on the shelf slope, and air-sea exchange of greenhouse gases (carbon dioxide and nitrous oxide).
Further details are available on the SSB website.
Participants
15 different organisations are directly involved in research for SSB. These institutions are
- Centre for Environment, Fisheries and Aquaculture Science (Cefas)
- Meteorological Office
- National Oceanography Centre (NOC)
- Plymouth Marine Laboratory (PML)
- Scottish Association for Marine Science (SAMS) / Scottish Marine Institute (SMI)
- University of Aberdeen
- University of Bangor
- University of East Anglia (UEA)
- University of Edinburgh
- University of Essex
- University of Liverpool
- University of Oxford
- Plymouth University
- University of Portsmouth
- University of Southampton
In addition, there are third party institutions carrying out sampling work for SSB, but who are not involved in the programme itself. These are:
- The Agri-Food and Biosciences Institute (AFBI)
- Irish Marine Institute (MI)
- Marine Science Scotland (MSS)
Research details
Overall, five Work Packages have been funded by the SSB programme. These are described in brief below:
-
Work Package 1: Carbon and Nutrient Dynamics and Fluxes over Shelf Systems (CaNDyFloSS).
This work package aims to perform a comprehensive study of the cycling of nutrients and carbon throughout the water column over the whole north-west European shelf. This will allow the fluxes of nutrients and carbon between the shelf and the deep ocean and atmosphere to be quantified, establishing the role of the north-west European continental shelf in the global carbon cycle. -
Work Package 2: Biogeochemistry, macronutrient and carbon cycling in the benthic layer.
This work package aims are to map the sensitivity and status of seabed habitats, based on physical conditions, ecological community structure and the size and dynamics of the nitrogen and carbon pools found there. This information will be used, in conjunction with some laboratory-based work, to generate an understanding of the potential impacts on the benthic community as a result of changing environmental conditions, such as rising CO2 levels. -
Work Package 3: The supply of iron from shelf sediments to the ocean.
The research for this work package addresses the question of how currents, tides, weather and marine chemistry allow new iron to be transported away from the shallow shelf waters around the United Kingdom (UK), to the nearby open ocean. This will ultimately allow an improved understanding of how the transport of iron in shelf waters and shelf sediments influences phytoplankton growth in open oceans. This in turn improves the understanding of carbon dioxide uptake by phytoplankton. -
Work Package 4: Integrative modelling for Shelf Seas Biogeochemistry.
The aim of this work package is the development of a new shelf seas biogeochemical model system, coupled to a state of the art physical model, that is capable of predicting regional impacts of environmental change of timescales from days to decades. It is envisaged that the combination of predictive tools and new knowledge developed in this work package will underpin development and implementation of marine policy and marine forecasting systems. - Work Package 5: Data synthesis and management of marine and coastal carbon (DSMMAC).
This work package is funded by Defra and is also known by the name 'Blue Carbon'. The aim is to provide a process-based, quantitative assessment of the role of UK coastal waters and shelf seas in carbon storage and release, using existing data and understanding, and also emerging results from SSB fieldwork, experiments and modelling. Particular emphasis will be given to processes that may be influenced by human activities, and hence the opportunity for management interventions to enhance carbon sequestration.
Fieldwork and data collection
The campaign consists of the core cruises in the table below, to the marine shelf (and shelf-edge) of the Celtic Sea on board the NERC research vessels RRS Discovery and RRS James Cook. These cruises will focus on the physics and biogeochemistry of the benthic and pelagic zones of the water column, primarily around four main sampling sites in this area.
| Cruise identifier | Research ship | Cruise dates | Work packages |
|---|---|---|---|
| DY008 | RRS Discovery | March 2014 | WP 2 and WP 3 |
| JC105 | RRS James Cook | June 2014 | WP 1, WP 2 and WP 3 |
| DY026 | RRS Discovery | August 2014 | WP1, WP 2 and WP 3 |
| DY018 | RRS Discovery | November - December 2014 | WP 1 and WP 3 |
| DY021 (also known as DY008b) | RRS Discovery | March 2015 | WP 2 and WP 3 |
| DY029 | RRS Discovery | April 2015 | WP 1 and WP 3 |
| DY030 | RRS Discovery | May 2015 | WP 2 and WP 3 |
| DY033 | RRS Discovery | July 2015 | WP 1 and WP 3 |
| DY034 | RRS Discovery | August 2015 | WP 2 and WP 3 |
Core cruises will be supplemented by partner cruises led by Cefas, MI, MSS, Bangor University and AFBI, spanning the shelf seas and shelf-edges around United Kingdom and Republic of Ireland.
Activities will include coring, Conductivity Temperature and Depth (CTD) deployments, Acoustic Doppler Current Profilers (ADCP) surveys, moorings and wire-walker deployments, benthic lander observatories, autonomous gliders and submersible surveys, Marine Snow Catcher particulate matter analysis, plankton net hauls, in-situ sediment flume investigations and laboratory incubations with core and sea water samples.
Shelf Sea Biogeochemistry (SSB) Programme Work Package 1: CaNDyFloSS
Carbon and Nutrient Dynamics and Fluxes over Shelf Systems (CaNDyFloSS) is a £2.76 million component of the Natural Environment Research Council (NERC) Shelf Sea Biogeochemistry (SSB) research programme, running from 2013 to 2017. It is jointly funded by NERC and the Department for Environment, Food and Rural Affairs (DEFRA). The aim of the research is to perform a comprehensive study of the cycling of nutrients and carbon throughout the water column over the whole north-west European shelf. This will allow the fluxes of nutrients and carbon between the shelf and the deep ocean and atmosphere to be quantified, establishing the role of the north-west European continental shelf in the global carbon cycle.
Background
Shelf seas are the primary regions of human marine resource exploitation, including both renewable and fossil fuel energy sources, recreation, trade and food production. They provide 90% of global fish catches which form an important source of food to much of the global population. They also play an important role in the ecosystem services provided by the oceans as a whole, in particular in storing carbon away from the atmosphere.
Physical and biochemical processes in shelf seas influence the removal of CO2 from the atmosphere and the subsequent storage of carbon in the deep ocean. Biological growth draws carbon out of the water, which is then replaced by carbon in CO2 from the atmosphere. In the shelf seas this growth is supported by terrestrial and open ocean sources of nutrients, implying intimate roles for both the terrestrial biosphere and the open ocean environment in regulating shelf sea climate services. The oceans can also be a major source or sink for other greenhouse gases, including nitrous oxide (N2O), with the shallow shelf sea thought to play a key role.
The spatial extent of the submerged continental shelves varies greatly. The NW European shelf sea is one of the largest and hence is likely to play a significant role in marine biogeochemical cycling, alongside providing a useful model for other systems. However, even in this relatively well studied region, there is a lack of detailed understanding of the principal controls on the cycling of carbon and the major nutrient elements, nitrogen, phosphorus and silicon. Consequently it is also difficult to predict how the cycling of these elements and hence the carbon removal they support may be altered by ongoing and potential future global change. This work package aims to address these uncertainties through a comprehensive study of the cycling of the major nutrients and carbon throughout the water column over the NW European shelf sea system.
Further details are available on the SSB website.
Participants
9 different organisations are directly involved in research for SSB Work Package 1. These institutions are
- Centre for Environment, Fisheries and Aquaculture Science (Cefas)
- National Oceanography Centre (NOC)
- Plymouth Marine Laboratory (PML)
- Scottish Association for Marine Science (SAMS) / Scottish Marine Institute (SMI)
- University of Aberdeen
- University of Bangor
- University of East Anglia (UEA)
- University of Liverpool
- University of Southampton
In addition, there are third party institutions carrying out sampling work for SSB Work Package 1, but who are not involved in the programme itself. These are:
- The Agri-Food and Biosciences Institute (AFBI)
- Irish Marine Institute (MI)
- Marine Science Scotland (MSS)
Objectives
Two overarching objectives are defined for this Work Package.
-
Objective 1: Estimate the size of the continental shelf carbon pump over the whole north-west European shelf.
This will consist of two principal activities. (1) Over a 12 month period, observations of air-sea CO2 fluxes will be made to provide a synoptic estimate of the magnitude of carbon update by the whole shelf system. (2) Concentrations of carbon (C), nitrogen (N), phosphate (P) and silicate (Si) will be estimated in water flowing on and off the shelf. These estimates will be coupled to estimates of flow and dispersion along the shelf edge, through collaboration with the NERC Fluxes across Sloping Topography of the North East Atlantic (FASTNEt) programme to allow an observational estimate of the net off-shelf transport of C, N, P and Si. -
Objective 2: Determine the relative importance of external nutrient sources and internal biogeochemical cycling in maintaining the continental shelf pump.
Estimates of the flux of nutrients and carbon generated in Objective 1 will be used to determine the estimation of any excess of on-shelf nutrient supply, relative to that of carbon. Work Package 1 will then quantify the processes which govern internal biogeochemical cycling by measuring the uptake ratios of N, P, Si and C into phytoplankton and the element and energy balance of organic matter production by autotrophs. Potential modifications to the relative concentrations and uptake of C, N, P and Si in the thermocline and sediment food webs will also be assessed, as will the relative importance of microbial and zooplankton turnover in controlling C, N, P and Si.
Fieldwork and data collection
Data for Objective 1 will be provided using pCO2 systems aboard third party vessels and ferry boxes, along with measurements made through the FASTNEt programme and through the Work Package 1 process cruises detailed below. The third party cruises will be undertaken by Cefas, MI, MSS, University of Bangor and AFBI, spanning the shelf seas and shelf-edges around the United Kingdom and the Republic of Ireland.
The Work Package 1 process cruises will provide data for Objective 1 and Objective 2 and are listed in the table below. The study area is the marine shelf (and shelf-edge) of the Celtic Sea. Work will be carried out on board the NERC research vessels RRS Discovery and RRS James Cook. These cruises will focus on the physics and biogeochemistry of the benthic and pelagic zones of the water column, primarily around four main sampling sites in this area.
| Cruise identifier | Research ship | Cruise dates | Work packages |
|---|---|---|---|
| JC105 | RRS James Cook | June 2014 | WP 1, WP 2 and WP 3 |
| DY026 | RRS Discovery | August 2014 | WP1, WP 2 and WP 3 |
| DY018 | RRS Discovery | November - December 2014 | WP 1 and WP 3 |
| DY029 | RRS Discovery | April 2015 | WP 1 and WP 3 |
| DY033 | RRS Discovery | July 2015 | WP 1 and WP 3 |
Activities will include Conductivity Temperature and Depth (CTD) deployments, Acoustic Doppler Current Profilers (ADCP) surveys, moorings and wire-walker deployments, autonomous gliders and submersible surveys, Marine Snow Catcher particulate matter analysis, plankton net hauls and laboratory incubations with sea water samples.
Data Activity or Cruise Information
Cruise
| Cruise Name | DY008 |
| Departure Date | 2014-03-18 |
| Arrival Date | 2014-04-13 |
| Principal Scientist(s) | Henry Ruhl (National Oceanography Centre, Southampton) |
| Ship | RRS Discovery |
Complete Cruise Metadata Report is available here
Fixed Station Information
Fixed Station Information
| Station Name | CS2 |
| Category | Offshore area |
| Latitude | 48° 33.23' N |
| Longitude | 9° 29.17' W |
| Water depth below MSL | 200.0 m |
Physical-Biological Control of New Production within the Seasonal Thermocline: Fixed Station CS2
This station is positioned close to the edge of the north-west European shelf edge (see figure below). It was first visited by the RRS James Clark Ross (JR98) in 2003 and then by the RRS Charles Darwin (CD173) in 2005. This station was then re-visited in 2014 during the RRS Discovery cruise DY018, as part of work package I of the Shelf Seas Biogeochemistry project. The station has a mean water depth 201 m at the following co-ordinates:
| Box Corner | Latitude | Longitude |
|---|---|---|
| North-west corner | 48.5838° | -9.5497° |
| South-east corner | 48.4998° | -9.4364° |
The position of this station relative to the other sites visited during JR98, CD173 and DY018 can be seen from the figure below.
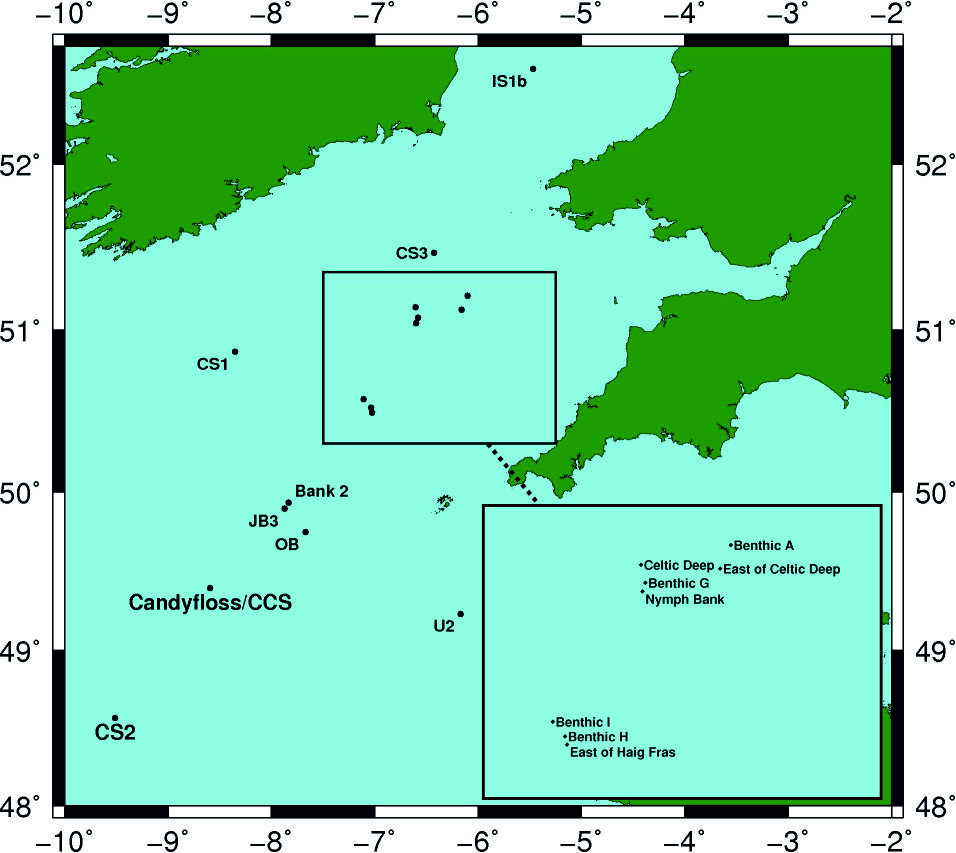
The following table describes which sites were visited during which cruises
| JB3 | Bank 2 | OB | IS1b | CS1 | CS2 | CS3 | U2 | Candyfloss/CCS | Benthic A | Benthic H | Benthic I | Benthic G | East of Haig Fras | Nymph Bank | Celtic Deep | East of Celtic Deep | |
|---|---|---|---|---|---|---|---|---|---|---|---|---|---|---|---|---|---|
| JR98 | - | - | - | X | X | X | X | X | - | - | - | - | - | - | - | - | - |
| CD173 | X | X | X | - | - | - | - | X | - | - | - | - | - | - | - | - | - |
| DY018 | - | - | - | - | - | X | - | - | X | X | X | X | X | X | X | X | X |
The deployment and sampling history, to date, for this station is summarised below:
Sampling History
| JR98 | CD173 | DY018 | |
|---|---|---|---|
| CTD casts | 30 | 15 | 15 |
| Free-fall light yo-yo profiles | - | 153 | - |
| Profiling radiometer | - | 16 | - |
| Zooplankton net hauls | - | - | 32 |
| Box cores | - | - | 5 |
| Marine snow catcher deployments | - | - | 17 |
| Stand Alone Pump Systems (SAPS) | - | - | 2 |
Mooring deployments
| Latitude | Longitude | Water depth (m) | Moored instrument | Deployment date | Recovery date | Deployment cruise | Recovery cruise | Comments |
|---|---|---|---|---|---|---|---|---|
| 48.532° | -9.463° | 200 | Surface temperature toroid | 2003-07-28 | 2003-08-12 | JR98 | JR98 | - |
| 48.532° | -9.463° | 200 | Thermistor chain throughout water column | 2003-07-28 | 2003-08-12 | JR98 | JR98 | - |
| 48.532° | -9.463° | 200 | Sub-surface 600 kHz ADCP | 2003-07-28 | 2003-08-12 | JR98 | JR98 | - |
| 48.532° | -9.463° | 200 | Aanderaa RCM7 current meter/CTD | 2003-07-28 | 2003-08-12 | JR98 | JR98 | - |
| 48.532° | -9.463° | 200 | Seabed frame 150 kHz ADCP | 2003-07-28 | 2003-08-12 | JR98 | JR98 | - |
| 48.532° | -9.463° | 200 | Seabed frame 300 kHz ADCP | 2003-07-28 | 2003-08-12 | JR98 | JR98 | - |
| 48.571° | -9.509° | 200 | Thermistor chain throughout water column | 2005-07-17 | 2005-07-24 | CD173 | CD173 | - |
| 48.573° | -9.51° | 194 | Sub-surface 300 kHz ADCP | 2005-07-17 | 2005-07-24 | CD173 | CD173 | - |
| 48.572° | -9.508° | 196 | Seabed frame 300 kHz ADCP | 2005-07-17 | 2005-07-24 | CD173 | CD173 | - |
| 48.571° | -9.507° | 202 | Seabed frame 150 kHz ADCP | 2005-07-17 | 2005-07-24 | CD173 | CD173 | - |
| - | - | 205 | T-F chain | 2014-11-17 09:03 UTC | 2014-11-19 17:07 UTC | DY018 | DY018 | - |
Related Fixed Station activities are detailed in Appendix 1
BODC Quality Control Flags
The following single character qualifying flags may be associated with one or more individual parameters with a data cycle:
| Flag | Description |
|---|---|
| Blank | Unqualified |
| < | Below detection limit |
| > | In excess of quoted value |
| A | Taxonomic flag for affinis (aff.) |
| B | Beginning of CTD Down/Up Cast |
| C | Taxonomic flag for confer (cf.) |
| D | Thermometric depth |
| E | End of CTD Down/Up Cast |
| G | Non-taxonomic biological characteristic uncertainty |
| H | Extrapolated value |
| I | Taxonomic flag for single species (sp.) |
| K | Improbable value - unknown quality control source |
| L | Improbable value - originator's quality control |
| M | Improbable value - BODC quality control |
| N | Null value |
| O | Improbable value - user quality control |
| P | Trace/calm |
| Q | Indeterminate |
| R | Replacement value |
| S | Estimated value |
| T | Interpolated value |
| U | Uncalibrated |
| W | Control value |
| X | Excessive difference |
SeaDataNet Quality Control Flags
The following single character qualifying flags may be associated with one or more individual parameters with a data cycle:
| Flag | Description |
|---|---|
| 0 | no quality control |
| 1 | good value |
| 2 | probably good value |
| 3 | probably bad value |
| 4 | bad value |
| 5 | changed value |
| 6 | value below detection |
| 7 | value in excess |
| 8 | interpolated value |
| 9 | missing value |
| A | value phenomenon uncertain |
| B | nominal value |
| Q | value below limit of quantification |
Appendix 1: CS2
Related series for this Fixed Station are presented in the table below. Further information can be found by following the appropriate links.
If you are interested in these series, please be aware we offer a multiple file download service. Should your credentials be insufficient for automatic download, the service also offers a referral to our Enquiries Officer who may be able to negotiate access.
| Series Identifier | Data Category | Start date/time | Start position | Cruise |
|---|---|---|---|---|
| 1106504 | CTD or STD cast | 2003-07-27 21:58:02 | 48.49983 N, 9.54967 W | RRS James Clark Ross JR20030725 (JR98) |
| 1106528 | CTD or STD cast | 2003-07-29 02:56:59 | 48.538 N, 9.46383 W | RRS James Clark Ross JR20030725 (JR98) |
| 1106541 | CTD or STD cast | 2003-07-29 03:58:02 | 48.538 N, 9.46417 W | RRS James Clark Ross JR20030725 (JR98) |
| 1106553 | CTD or STD cast | 2003-07-29 05:20:59 | 48.538 N, 9.46417 W | RRS James Clark Ross JR20030725 (JR98) |
| 1106565 | CTD or STD cast | 2003-07-29 06:01:00 | 48.538 N, 9.464 W | RRS James Clark Ross JR20030725 (JR98) |
| 1106577 | CTD or STD cast | 2003-07-29 06:58:02 | 48.538 N, 9.46417 W | RRS James Clark Ross JR20030725 (JR98) |
| 1106589 | CTD or STD cast | 2003-07-29 08:01:58 | 48.538 N, 9.464 W | RRS James Clark Ross JR20030725 (JR98) |
| 1106590 | CTD or STD cast | 2003-07-29 09:17:00 | 48.538 N, 9.46417 W | RRS James Clark Ross JR20030725 (JR98) |
| 1106608 | CTD or STD cast | 2003-07-29 10:22:57 | 48.538 N, 9.464 W | RRS James Clark Ross JR20030725 (JR98) |
| 1106621 | CTD or STD cast | 2003-07-29 11:15:04 | 48.53783 N, 9.464 W | RRS James Clark Ross JR20030725 (JR98) |
| 1106633 | CTD or STD cast | 2003-07-29 12:28:57 | 48.53783 N, 9.464 W | RRS James Clark Ross JR20030725 (JR98) |
| 1106645 | CTD or STD cast | 2003-07-29 13:37:03 | 48.53783 N, 9.464 W | RRS James Clark Ross JR20030725 (JR98) |
| 1106657 | CTD or STD cast | 2003-07-29 14:06:00 | 48.53783 N, 9.464 W | RRS James Clark Ross JR20030725 (JR98) |
| 1106669 | CTD or STD cast | 2003-07-29 15:00:00 | 48.538 N, 9.464 W | RRS James Clark Ross JR20030725 (JR98) |
| 1106670 | CTD or STD cast | 2003-07-29 16:12:00 | 48.538 N, 9.464 W | RRS James Clark Ross JR20030725 (JR98) |
| 1106682 | CTD or STD cast | 2003-07-29 17:00:58 | 48.538 N, 9.46417 W | RRS James Clark Ross JR20030725 (JR98) |
| 1106694 | CTD or STD cast | 2003-07-29 18:00:00 | 48.53783 N, 9.464 W | RRS James Clark Ross JR20030725 (JR98) |
| 1106701 | CTD or STD cast | 2003-07-29 18:58:02 | 48.53783 N, 9.46417 W | RRS James Clark Ross JR20030725 (JR98) |
| 1106713 | CTD or STD cast | 2003-07-29 19:59:57 | 48.53783 N, 9.46417 W | RRS James Clark Ross JR20030725 (JR98) |
| 1106725 | CTD or STD cast | 2003-07-29 20:57:59 | 48.53783 N, 9.464 W | RRS James Clark Ross JR20030725 (JR98) |
| 1106737 | CTD or STD cast | 2003-07-29 21:57:01 | 48.538 N, 9.464 W | RRS James Clark Ross JR20030725 (JR98) |
| 1106749 | CTD or STD cast | 2003-07-29 23:07:00 | 48.538 N, 9.46383 W | RRS James Clark Ross JR20030725 (JR98) |
| 1106750 | CTD or STD cast | 2003-07-29 23:56:59 | 48.53783 N, 9.464 W | RRS James Clark Ross JR20030725 (JR98) |
| 1106762 | CTD or STD cast | 2003-07-30 00:58:02 | 48.53783 N, 9.464 W | RRS James Clark Ross JR20030725 (JR98) |
| 1106774 | CTD or STD cast | 2003-07-30 01:57:04 | 48.53783 N, 9.464 W | RRS James Clark Ross JR20030725 (JR98) |
| 1106786 | CTD or STD cast | 2003-07-30 02:56:59 | 48.53833 N, 9.46317 W | RRS James Clark Ross JR20030725 (JR98) |
| 1106798 | CTD or STD cast | 2003-07-30 03:59:02 | 48.538 N, 9.464 W | RRS James Clark Ross JR20030725 (JR98) |
| 1106805 | CTD or STD cast | 2003-07-30 05:09:01 | 48.538 N, 9.464 W | RRS James Clark Ross JR20030725 (JR98) |
| 1108326 | CTD or STD cast | 2003-08-12 06:46:57 | 48.52383 N, 9.45533 W | RRS James Clark Ross JR20030725 (JR98) |
| 1108338 | CTD or STD cast | 2003-08-12 11:25:00 | 48.52883 N, 9.47533 W | RRS James Clark Ross JR20030725 (JR98) |
| 737376 | CTD or STD cast | 2005-07-17 18:57:00 | 48.575 N, 9.51433 W | RRS Charles Darwin CD173 |
| 737388 | CTD or STD cast | 2005-07-17 21:14:00 | 48.57517 N, 9.515 W | RRS Charles Darwin CD173 |
| 737407 | CTD or STD cast | 2005-07-17 23:07:00 | 48.57617 N, 9.51083 W | RRS Charles Darwin CD173 |
| 737419 | CTD or STD cast | 2005-07-18 00:58:00 | 48.57533 N, 9.50133 W | RRS Charles Darwin CD173 |
| 737420 | CTD or STD cast | 2005-07-18 07:19:00 | 48.568 N, 9.50233 W | RRS Charles Darwin CD173 |
| 1174790 | PAR radiance and irradiance | 2005-07-18 09:32:47 | 48.532 N, 9.463 W | RRS Charles Darwin CD173 |
| 1174808 | PAR radiance and irradiance | 2005-07-18 09:39:45 | 48.532 N, 9.463 W | RRS Charles Darwin CD173 |
| 737432 | CTD or STD cast | 2005-07-18 12:02:00 | 48.56817 N, 9.5115 W | RRS Charles Darwin CD173 |
| 1174821 | PAR radiance and irradiance | 2005-07-18 14:02:45 | 48.532 N, 9.463 W | RRS Charles Darwin CD173 |
| 1174833 | PAR radiance and irradiance | 2005-07-18 14:07:22 | 48.532 N, 9.463 W | RRS Charles Darwin CD173 |
| 737444 | CTD or STD cast | 2005-07-18 16:22:00 | 48.5705 N, 9.49217 W | RRS Charles Darwin CD173 |
| 737456 | CTD or STD cast | 2005-07-18 18:39:00 | 48.56867 N, 9.48233 W | RRS Charles Darwin CD173 |
| 737616 | CTD or STD cast | 2005-07-23 03:00:00 | 48.57167 N, 9.48967 W | RRS Charles Darwin CD173 |
| 737628 | CTD or STD cast | 2005-07-23 07:18:00 | 48.57083 N, 9.48733 W | RRS Charles Darwin CD173 |
| 1174845 | PAR radiance and irradiance | 2005-07-23 09:10:37 | 48.532 N, 9.463 W | RRS Charles Darwin CD173 |
| 1174857 | PAR radiance and irradiance | 2005-07-23 09:15:51 | 48.532 N, 9.463 W | RRS Charles Darwin CD173 |
| 1174869 | PAR radiance and irradiance | 2005-07-23 09:22:37 | 48.532 N, 9.463 W | RRS Charles Darwin CD173 |
| 737641 | CTD or STD cast | 2005-07-23 10:32:00 | 48.5785 N, 9.50317 W | RRS Charles Darwin CD173 |
| 737653 | CTD or STD cast | 2005-07-23 15:25:00 | 48.57733 N, 9.48133 W | RRS Charles Darwin CD173 |
| 1174870 | PAR radiance and irradiance | 2005-07-23 17:08:32 | 48.532 N, 9.463 W | RRS Charles Darwin CD173 |
| 1174882 | PAR radiance and irradiance | 2005-07-23 18:40:35 | 48.532 N, 9.463 W | RRS Charles Darwin CD173 |
| 737665 | CTD or STD cast | 2005-07-23 19:59:00 | 48.57617 N, 9.48967 W | RRS Charles Darwin CD173 |
| 737677 | CTD or STD cast | 2005-07-23 23:07:00 | 48.58083 N, 9.50617 W | RRS Charles Darwin CD173 |
| 737689 | CTD or STD cast | 2005-07-24 04:03:00 | 48.5825 N, 9.512 W | RRS Charles Darwin CD173 |
| 1336711 | Water sample data | 2014-03-28 15:55:00 | 48.57113 N, 9.5127 W | RRS Discovery DY008 |
| 2117548 | Water sample data | 2014-03-28 15:55:00 | 48.57113 N, 9.5127 W | RRS Discovery DY008 |
| 2119101 | Water sample data | 2014-03-28 15:55:00 | 48.57113 N, 9.5127 W | RRS Discovery DY008 |
| 1373057 | CTD or STD cast | 2014-08-07 06:04:00 | 48.57 N, 9.51 W | RRS Discovery DY026A |
| 2127506 | Water sample data | 2014-08-07 06:20:00 | 48.5699 N, 9.51027 W | RRS Discovery DY026A |
| 1373069 | CTD or STD cast | 2014-08-07 11:10:00 | 48.57633 N, 9.51617 W | RRS Discovery DY026A |
| 2118146 | Water sample data | 2014-08-07 11:29:30 | 48.57648 N, 9.5154 W | RRS Discovery DY026A |
| 2127518 | Water sample data | 2014-08-07 11:29:30 | 48.57648 N, 9.5154 W | RRS Discovery DY026A |
| 1373070 | CTD or STD cast | 2014-08-07 15:00:00 | 48.57167 N, 9.505 W | RRS Discovery DY026A |
| 2127531 | Water sample data | 2014-08-07 15:17:00 | 48.5711 N, 9.5046 W | RRS Discovery DY026A |
| 1371849 | CTD or STD cast | 2014-11-14 13:15:00 | 48.571 N, 9.50947 W | RRS Discovery DY018 (GApr04) |
| 2117689 | Water sample data | 2014-11-14 13:23:30 | 48.57106 N, 9.50945 W | RRS Discovery DY018 (GApr04) |
| 1749283 | Fluorescence or pigments | 2014-11-17 10:00:00 | 48.57086 N, 9.5097 W | RRS Discovery DY018 (GApr04) |
| 1749295 | Fluorescence or pigments | 2014-11-17 10:00:00 | 48.57086 N, 9.5097 W | RRS Discovery DY018 (GApr04) |
| 1749302 | Fluorescence or pigments | 2014-11-17 10:00:00 | 48.57086 N, 9.5097 W | RRS Discovery DY018 (GApr04) |
| 1749314 | Fluorescence or pigments | 2014-11-17 10:00:00 | 48.57086 N, 9.5097 W | RRS Discovery DY018 (GApr04) |
| 1749326 | Fluorescence or pigments | 2014-11-17 10:00:00 | 48.57086 N, 9.5097 W | RRS Discovery DY018 (GApr04) |
| 1749338 | Hydrography time series at depth | 2014-11-17 10:00:00 | 48.57086 N, 9.5097 W | RRS Discovery DY018 (GApr04) |
| 1749351 | Hydrography time series at depth | 2014-11-17 10:00:00 | 48.57086 N, 9.5097 W | RRS Discovery DY018 (GApr04) |
| 1749363 | Hydrography time series at depth | 2014-11-17 10:00:00 | 48.57086 N, 9.5097 W | RRS Discovery DY018 (GApr04) |
| 1749375 | Hydrography time series at depth | 2014-11-17 10:00:00 | 48.57086 N, 9.5097 W | RRS Discovery DY018 (GApr04) |
| 1749399 | Hydrography time series at depth | 2014-11-17 10:00:00 | 48.57086 N, 9.5097 W | RRS Discovery DY018 (GApr04) |
| 1749406 | Hydrography time series at depth | 2014-11-17 10:00:00 | 48.57086 N, 9.5097 W | RRS Discovery DY018 (GApr04) |
| 1749418 | Hydrography time series at depth | 2014-11-17 10:00:00 | 48.57086 N, 9.5097 W | RRS Discovery DY018 (GApr04) |
| 1749431 | Hydrography time series at depth | 2014-11-17 10:00:00 | 48.57086 N, 9.5097 W | RRS Discovery DY018 (GApr04) |
| 1749443 | Hydrography time series at depth | 2014-11-17 10:00:00 | 48.57086 N, 9.5097 W | RRS Discovery DY018 (GApr04) |
| 1749455 | Hydrography time series at depth | 2014-11-17 10:00:00 | 48.57086 N, 9.5097 W | RRS Discovery DY018 (GApr04) |
| 1749467 | Hydrography time series at depth | 2014-11-17 10:00:00 | 48.57086 N, 9.5097 W | RRS Discovery DY018 (GApr04) |
| 1749479 | Hydrography time series at depth | 2014-11-17 10:00:00 | 48.57086 N, 9.5097 W | RRS Discovery DY018 (GApr04) |
| 1749480 | Hydrography time series at depth | 2014-11-17 10:00:00 | 48.57086 N, 9.5097 W | RRS Discovery DY018 (GApr04) |
| 1749492 | Hydrography time series at depth | 2014-11-17 10:00:00 | 48.57086 N, 9.5097 W | RRS Discovery DY018 (GApr04) |
| 1749511 | Hydrography time series at depth | 2014-11-17 10:00:00 | 48.57086 N, 9.5097 W | RRS Discovery DY018 (GApr04) |
| 1749523 | Hydrography time series at depth | 2014-11-17 10:00:00 | 48.57086 N, 9.5097 W | RRS Discovery DY018 (GApr04) |
| 1749535 | Hydrography time series at depth | 2014-11-17 10:00:00 | 48.57086 N, 9.5097 W | RRS Discovery DY018 (GApr04) |
| 1749547 | Hydrography time series at depth | 2014-11-17 10:00:00 | 48.57086 N, 9.5097 W | RRS Discovery DY018 (GApr04) |
| 1749559 | Hydrography time series at depth | 2014-11-17 10:00:00 | 48.57086 N, 9.5097 W | RRS Discovery DY018 (GApr04) |
| 1749560 | Hydrography time series at depth | 2014-11-17 10:00:00 | 48.57086 N, 9.5097 W | RRS Discovery DY018 (GApr04) |
| 1749572 | Hydrography time series at depth | 2014-11-17 10:00:00 | 48.57086 N, 9.5097 W | RRS Discovery DY018 (GApr04) |
| 1749584 | Hydrography time series at depth | 2014-11-17 10:00:00 | 48.57086 N, 9.5097 W | RRS Discovery DY018 (GApr04) |
| 1749596 | Hydrography time series at depth | 2014-11-17 10:00:00 | 48.57086 N, 9.5097 W | RRS Discovery DY018 (GApr04) |
| 1749387 | Hydrography time series at depth | 2014-11-17 10:00:30 | 48.57086 N, 9.5097 W | RRS Discovery DY018 (GApr04) |
| 1371978 | CTD or STD cast | 2014-11-17 12:25:00 | 48.57087 N, 9.50968 W | RRS Discovery DY018 (GApr04) |
| 2117690 | Water sample data | 2014-11-17 12:35:30 | 48.57086 N, 9.50969 W | RRS Discovery DY018 (GApr04) |
| 2119832 | Water sample data | 2014-11-17 12:35:30 | 48.57086 N, 9.50969 W | RRS Discovery DY018 (GApr04) |
| 2126804 | Water sample data | 2014-11-17 12:35:30 | 48.57086 N, 9.50969 W | RRS Discovery DY018 (GApr04) |
| 2136614 | Water sample data | 2014-11-17 12:35:30 | 48.57086 N, 9.50969 W | RRS Discovery DY018 (GApr04) |
| 1371991 | CTD or STD cast | 2014-11-17 15:42:00 | 48.57087 N, 9.50968 W | RRS Discovery DY018 (GApr04) |
| 1372005 | CTD or STD cast | 2014-11-18 05:16:00 | 48.57107 N, 9.51052 W | RRS Discovery DY018 (GApr04) |
| 2117708 | Water sample data | 2014-11-18 05:28:00 | 48.57107 N, 9.51051 W | RRS Discovery DY018 (GApr04) |
| 2126816 | Water sample data | 2014-11-18 05:28:00 | 48.57107 N, 9.51051 W | RRS Discovery DY018 (GApr04) |
| 2136626 | Water sample data | 2014-11-18 05:28:00 | 48.57107 N, 9.51051 W | RRS Discovery DY018 (GApr04) |
| 1372017 | CTD or STD cast | 2014-11-18 08:10:00 | 48.57127 N, 9.51102 W | RRS Discovery DY018 (GApr04) |
| 1372460 | CTD or STD cast | 2014-11-18 09:15:00 | 48.57127 N, 9.51102 W | RRS Discovery DY018 (GApr04) |
| 2120058 | Water sample data | 2014-11-18 09:19:00 | 48.57127 N, 9.51102 W | RRS Discovery DY018 (GApr04) |
| 2121479 | Water sample data | 2014-11-18 09:19:00 | 48.57127 N, 9.51102 W | RRS Discovery DY018 (GApr04) |
| 2127033 | Water sample data | 2014-11-18 09:19:00 | 48.57127 N, 9.51102 W | RRS Discovery DY018 (GApr04) |
| 1372029 | CTD or STD cast | 2014-11-18 10:02:00 | 48.57127 N, 9.51102 W | RRS Discovery DY018 (GApr04) |
| 1372030 | CTD or STD cast | 2014-11-18 12:11:00 | 48.57123 N, 9.51103 W | RRS Discovery DY018 (GApr04) |
| 2117721 | Water sample data | 2014-11-18 12:21:30 | 48.57125 N, 9.51104 W | RRS Discovery DY018 (GApr04) |
| 2119844 | Water sample data | 2014-11-18 12:21:30 | 48.57125 N, 9.51104 W | RRS Discovery DY018 (GApr04) |
| 2126828 | Water sample data | 2014-11-18 12:21:30 | 48.57125 N, 9.51104 W | RRS Discovery DY018 (GApr04) |
| 2136638 | Water sample data | 2014-11-18 12:21:30 | 48.57125 N, 9.51104 W | RRS Discovery DY018 (GApr04) |
| 1372472 | CTD or STD cast | 2014-11-19 10:02:00 | 48.57112 N, 9.5095 W | RRS Discovery DY018 (GApr04) |
| 2120071 | Water sample data | 2014-11-19 10:06:00 | 48.57113 N, 9.50949 W | RRS Discovery DY018 (GApr04) |
| 2121480 | Water sample data | 2014-11-19 10:06:00 | 48.57113 N, 9.50949 W | RRS Discovery DY018 (GApr04) |
| 2127045 | Water sample data | 2014-11-19 10:06:00 | 48.57113 N, 9.50949 W | RRS Discovery DY018 (GApr04) |
| 1372042 | CTD or STD cast | 2014-11-19 12:17:00 | 48.57113 N, 9.50952 W | RRS Discovery DY018 (GApr04) |
| 2117733 | Water sample data | 2014-11-19 12:27:00 | 48.57112 N, 9.50949 W | RRS Discovery DY018 (GApr04) |
| 2119856 | Water sample data | 2014-11-19 12:27:00 | 48.57112 N, 9.50949 W | RRS Discovery DY018 (GApr04) |
| 2126841 | Water sample data | 2014-11-19 12:27:00 | 48.57112 N, 9.50949 W | RRS Discovery DY018 (GApr04) |
| 2136651 | Water sample data | 2014-11-19 12:27:00 | 48.57112 N, 9.50949 W | RRS Discovery DY018 (GApr04) |
| 1372054 | CTD or STD cast | 2014-11-19 13:58:00 | 48.57112 N, 9.50953 W | RRS Discovery DY018 (GApr04) |
| 1372066 | CTD or STD cast | 2014-11-20 02:11:00 | 48.57352 N, 9.50627 W | RRS Discovery DY018 (GApr04) |
| 2117745 | Water sample data | 2014-11-20 02:21:30 | 48.57351 N, 9.50628 W | RRS Discovery DY018 (GApr04) |
| 2126853 | Water sample data | 2014-11-20 02:21:30 | 48.57351 N, 9.50628 W | RRS Discovery DY018 (GApr04) |
| 2136663 | Water sample data | 2014-11-20 02:21:30 | 48.57351 N, 9.50628 W | RRS Discovery DY018 (GApr04) |
| 1372238 | CTD or STD cast | 2014-11-24 13:17:00 | 48.571 N, 9.50945 W | RRS Discovery DY018 (GApr04) |
| 1372251 | CTD or STD cast | 2014-11-24 14:09:00 | 48.571 N, 9.50947 W | RRS Discovery DY018 (GApr04) |
| 2119893 | Water sample data | 2014-11-24 14:12:30 | 48.571 N, 9.50946 W | RRS Discovery DY018 (GApr04) |
| 1624461 | CTD or STD cast | 2015-03-24 05:51:00 | 48.57065 N, 9.5093 W | RRS Discovery DY021 |
| 2118091 | Water sample data | 2015-03-24 05:59:00 | 48.57066 N, 9.5093 W | RRS Discovery DY021 |
| 2127358 | Water sample data | 2015-03-24 05:59:00 | 48.57066 N, 9.5093 W | RRS Discovery DY021 |
| 1626271 | CTD or STD cast | 2015-04-09 02:07:00 | 48.57113 N, 9.51593 W | RRS Discovery DY029 (GApr04) |
| 1626283 | CTD or STD cast | 2015-04-09 07:07:00 | 48.57117 N, 9.50992 W | RRS Discovery DY029 (GApr04) |
| 1626258 | CTD or STD cast | 2015-04-09 18:06:00 | 48.5742 N, 9.50827 W | RRS Discovery DY029 (GApr04) |
| 2136780 | Water sample data | 2015-04-10 02:23:00 | 48.57114 N, 9.50994 W | RRS Discovery DY029 (GApr04) |
| 2118299 | Water sample data | 2015-04-10 07:25:00 | 48.57116 N, 9.5099 W | RRS Discovery DY029 (GApr04) |
| 1626523 | CTD or STD cast | 2015-04-17 07:09:00 | 48.57188 N, 9.51053 W | RRS Discovery DY029 (GApr04) |
| 2118411 | Water sample data | 2015-04-17 07:14:30 | 48.57057 N, 9.51103 W | RRS Discovery DY029 (GApr04) |
| 2136903 | Water sample data | 2015-04-17 07:14:30 | 48.57057 N, 9.51103 W | RRS Discovery DY029 (GApr04) |
| 2118472 | Water sample data | 2015-04-24 02:23:30 | 48.57129 N, 9.50945 W | RRS Discovery DY029 (GApr04) |
| 2136940 | Water sample data | 2015-04-24 02:23:30 | 48.57129 N, 9.50945 W | RRS Discovery DY029 (GApr04) |
| 1626812 | CTD or STD cast | 2015-04-24 02:41:00 | 48.57132 N, 9.50962 W | RRS Discovery DY029 (GApr04) |
| 1627378 | CTD or STD cast | 2015-04-24 05:43:00 | 48.52172 N, 9.45178 W | RRS Discovery DY029 (GApr04) |
| 1626824 | CTD or STD cast | 2015-04-24 09:04:00 | 48.60553 N, 9.44478 W | RRS Discovery DY029 (GApr04) |
| 2118484 | Water sample data | 2015-04-24 13:35:30 | 48.5697 N, 9.50944 W | RRS Discovery DY029 (GApr04) |
| 2136952 | Water sample data | 2015-04-24 13:35:30 | 48.5697 N, 9.50944 W | RRS Discovery DY029 (GApr04) |
| 1626836 | CTD or STD cast | 2015-04-24 13:49:00 | 48.56968 N, 9.50942 W | RRS Discovery DY029 (GApr04) |
| 1626848 | CTD or STD cast | 2015-04-24 15:45:00 | 48.5666 N, 9.50927 W | RRS Discovery DY029 (GApr04) |
| 1627391 | CTD or STD cast | 2015-04-24 16:27:00 | 48.56667 N, 9.50933 W | RRS Discovery DY029 (GApr04) |
| 1626861 | CTD or STD cast | 2015-04-24 17:25:00 | 48.56647 N, 9.50928 W | RRS Discovery DY029 (GApr04) |
| 1624983 | CTD or STD cast | 2015-05-22 14:55:00 | 48.57023 N, 9.5104 W | RRS Discovery DY030 |
| 2132545 | Water sample data | 2015-05-22 15:11:00 | 48.57023 N, 9.51038 W | RRS Discovery DY030 |
| 2137838 | Water sample data | 2015-05-22 15:11:00 | 48.57023 N, 9.51038 W | RRS Discovery DY030 |
| 1624645 | CTD or STD cast | 2015-05-22 16:13:00 | 48.57023 N, 9.5104 W | RRS Discovery DY030 |
| 2123413 | Water sample data | 2015-05-22 16:26:30 | 48.57023 N, 9.51039 W | RRS Discovery DY030 |
| 1625199 | CTD or STD cast | 2015-07-19 01:15:00 | 48.57085 N, 9.5098 W | RRS Discovery DY033 (GApr04) |
| 2118693 | Water sample data | 2015-07-19 01:21:30 | 48.57086 N, 9.5099 W | RRS Discovery DY033 (GApr04) |
| 2120279 | Water sample data | 2015-07-19 01:21:30 | 48.57086 N, 9.5099 W | RRS Discovery DY033 (GApr04) |
| 2123566 | Water sample data | 2015-07-19 01:21:30 | 48.57086 N, 9.5099 W | RRS Discovery DY033 (GApr04) |
| 2137931 | Water sample data | 2015-07-19 01:21:30 | 48.57086 N, 9.5099 W | RRS Discovery DY033 (GApr04) |
| 1625206 | CTD or STD cast | 2015-07-19 11:05:00 | 48.57113 N, 9.50987 W | RRS Discovery DY033 (GApr04) |
| 2123578 | Water sample data | 2015-07-19 11:17:00 | 48.57115 N, 9.50986 W | RRS Discovery DY033 (GApr04) |
| 2137943 | Water sample data | 2015-07-19 11:17:00 | 48.57115 N, 9.50986 W | RRS Discovery DY033 (GApr04) |
| 1625218 | CTD or STD cast | 2015-07-19 15:50:00 | 48.57122 N, 9.50985 W | RRS Discovery DY033 (GApr04) |
| 1625231 | CTD or STD cast | 2015-07-20 02:12:00 | 48.57083 N, 9.50967 W | RRS Discovery DY033 (GApr04) |
| 2118700 | Water sample data | 2015-07-20 02:24:00 | 48.57092 N, 9.50971 W | RRS Discovery DY033 (GApr04) |
| 2123591 | Water sample data | 2015-07-20 02:24:00 | 48.57092 N, 9.50971 W | RRS Discovery DY033 (GApr04) |
| 2137955 | Water sample data | 2015-07-20 02:24:00 | 48.57092 N, 9.50971 W | RRS Discovery DY033 (GApr04) |
| 1625685 | CTD or STD cast | 2015-07-20 03:29:00 | 48.57083 N, 9.50967 W | RRS Discovery DY033 (GApr04) |
| 2120440 | Water sample data | 2015-07-20 03:39:00 | 48.57093 N, 9.50975 W | RRS Discovery DY033 (GApr04) |
| 2123947 | Water sample data | 2015-07-20 03:39:00 | 48.57093 N, 9.50975 W | RRS Discovery DY033 (GApr04) |
| 1625243 | CTD or STD cast | 2015-07-20 05:18:00 | 48.57083 N, 9.50967 W | RRS Discovery DY033 (GApr04) |
| 1625255 | CTD or STD cast | 2015-07-20 10:04:00 | 48.5711 N, 9.5093 W | RRS Discovery DY033 (GApr04) |
| 2120280 | Water sample data | 2015-07-20 11:15:00 | 48.5711 N, 9.50929 W | RRS Discovery DY033 (GApr04) |
| 2123609 | Water sample data | 2015-07-20 11:15:00 | 48.5711 N, 9.50929 W | RRS Discovery DY033 (GApr04) |
| 2137967 | Water sample data | 2015-07-20 11:15:00 | 48.5711 N, 9.50929 W | RRS Discovery DY033 (GApr04) |
| 1625267 | CTD or STD cast | 2015-07-20 15:26:00 | 48.57107 N, 9.50897 W | RRS Discovery DY033 (GApr04) |
| 2119752 | Water sample data | 2015-08-31 08:42:30 | 48.57077 N, 9.50961 W | RRS Discovery DY034 |
| 2122317 | Water sample data | 2015-08-31 10:10:00 | 48.57082 N, 9.51127 W | RRS Discovery DY034 |
