Metadata Report for BODC Series Reference Number 701938
Metadata Summary
Problem Reports
Data Access Policy
Narrative Documents
Project Information
Data Activity or Cruise Information
Fixed Station Information
BODC Quality Flags
SeaDataNet Quality Flags
Metadata Summary
Data Description |
|||||||||||||||||||||||||||||||||||||||||||||
|
|||||||||||||||||||||||||||||||||||||||||||||
Data Identifiers |
|||||||||||||||||||||||||||||||||||||||||||||
|
|||||||||||||||||||||||||||||||||||||||||||||
Time Co-ordinates(UT) |
|||||||||||||||||||||||||||||||||||||||||||||
|
|||||||||||||||||||||||||||||||||||||||||||||
Spatial Co-ordinates | |||||||||||||||||||||||||||||||||||||||||||||
|
|||||||||||||||||||||||||||||||||||||||||||||
Parameters |
|||||||||||||||||||||||||||||||||||||||||||||
|
|||||||||||||||||||||||||||||||||||||||||||||
|
|||||||||||||||||||||||||||||||||||||||||||||
Problem Reports
No Problem Report Found in the Database
Originator's data processing/quality control comments for RIG#913/SB16+#4736
Data supplied to BODC were accompanied by data quality notes from the originator that detailed observations made when the data were processed and subsequent processing decisions. A summary of these notes is available below.
| Instrument | Serial number | Instrument depth | Data quality comments |
|---|---|---|---|
| Sea-bird 16+ SEACAT fitted with Seapoint Turbidity Meter 10320 and additional SCUFA turbidity sensor | 04736 | Located on seabed | None. |
Data Access Policy
Open Data supplied by Natural Environment Research Council (NERC)
You must always use the following attribution statement to acknowledge the source of the information: "Contains data supplied by Natural Environment Research Council."
Narrative Documents
Coastal Observatory Sea-Bird SBE 16plus SEACAT with Seapoint Turbidity Sensor
Data Originator's Processing
Data were downloaded by the Proudman Oceanographic Laboratory (POL) (since 01 April 2010, the National Oceanography Centre Liverpool (NOCL)) from the instrument logger, and factory calibrations were applied to the temperature and conductivity channels. The instruments are returned to the manufacturer for recalibration approximately every two years. The data were then reformatted by POL/NOCL to a standard ASCII format.
Before the data were supplied to BODC, basic quality control was performed by the Data Originator. The first stage of quality checks involved comparing the data from each instrument with CTD measurements recorded during the deployment and recovery of the mooring. Following the comparison against CTD data secondary checks were performed by comparing the data from each instrument against the data from other sensors attached to that mooring. The Originator has provided BODC with a document containing a full description of the quality control methodology. Depending on the result of the quality checks for each series, one of the following actions was performed by the Originator:
- The data was declared good quality and no corrections were applied.
- Series with consistent offsets, spikes or periods of bad data were edited to correct for these issues. Spikes and periods of unrealistic values were converted to NaN values.
- The series was marked as 'use with caution', if there were problems which the Originator was unable to correct, or it was unclear whether there was a problem with the data.
- If the quality of the data from a series was extremely poor, then the Originator recommended that the data should not be used.
A full description of the results of these quality checks can be found in the relevant Originator's data processing comments document.
Sea-Bird SBE 16plus SEACAT
The SBE 16plus is a high accuracy conductivity and temperature recorder (pressure optional). It is designed for moorings and other long-duration, fixed-site deployments. The SBE 16plus has 6 amplified A/D input channels and conditioned power of 500 ma is avaliable for auxiliary sensors, dissolved oxygen, turbidity, fluorescence, PAR etc.
The SBE 16plus is available with a choice of RS-232 or RS-485 interface.
Sensor specifications
| Temperature (°C) | Conductivity (S m-1) | Optional Pressure - strain Gauge | Optional Pressure - Quartz | |
|---|---|---|---|---|
| Measurement Range | -5 to +35 | 0 to 9 | 0 to full scale range: 20 / 100 / 350 / 1000 / 1600 / 2000 / 3500 / 7000 metres | 0 to full scale range: 20 / 60 / 130 / 200 / 270 / 680 / 1400 / 2000 / 4200 / 7000 / 10500 metres |
| Initial accuracy | 0.005 | 0.0005 | 0.1% (RS-232)/0.04% (RS-485) of full scale range | 0.02% (RS-232)/0.002% (RS-485) of full scale range |
| Typical Stability | 0.0002 | 0.0003 | 0.05% (RS-232)/0.1% (RS-485) of full scale range | 0.025% of full scale range |
| Resolution | 0.0001 | 0.00005 typical | 0.002% of full scale range | Depends on sample integration, 0.0006% of full scale range for 1 s integration |
| Sensor Calibration | +1 to +32 | 0 to 9; physical calibration over range 2.6 to 6.5 S m-1 plus zero conductivity (air) | Ambient pressure to full scale range in 5 steps | Ambient pressure to full scale range in 5 steps |
General information
| Memory | 8 MB FLASH memory (RS-232); 64 MB FLASH memory (RS-485) |
|---|---|
| Data Storage | Converted temperature and conductivity: 6 bytes per sample. Time: 4 bytes per sample. Pressure (optional): 5 bytes per sample |
| Real-Time Clock | Watch-crystal type 32,768 Hz; accuracy (±1 minutes/year) |
| Standard Internal Batteries | 9 alkaline D-cells. Provides sufficient capacity for 145,000 samples for a CTD and 5M pump |
| Housing | Titanium pressure case rated at 7000 metres |
| Weight (without pressure) | In water: 8.6 kg/In air: 13.7 kg |
Further information can be found in the instrument manual
Seapoint Turbidity Meter
The Seapoint Turbidity Meter detects light scattered by particles suspended in water, generating an output voltage proportional to turbidity or suspended solids. Range is selected by two digital lines which can be hard wired or microprocessor controlled, thereby choosing the appropriate range and resolution for measurement of extremely clean to very turbid waters. The offset voltage is within 1 mV of zero and requires no adjustment across gains. The optical design confines the sensing volume to within 5 cm of the sensor allowing near-bottom measurements and minimizing errant reflections in restricted spaces.
Sensor specifications, current at August 2006, are given in the table below.
Sensor Specifications
| Power requirements | 7 - 20 VDC, 3.5 mA avg., 6 mA pk. |
|---|---|
| Output | 0 - 5.0 VDC |
| Output Time Constant | 0.1 sec. |
| RMS Noise> | < 1 mV |
| Power-up transient period | < 1 sec. |
| Light Source Wavelength | 880 nm |
| Sensing Distance (from windows) | < 5 cm (approx.) |
| Linearity | < 2% deviation 0 - 750 FTU |
| Gain | Sensitivity (mV FTU-1) | Range (FTU) | |
|---|---|---|---|
| Sensitivity/Range | 100x 20x 5x 1x | 200 40 10 2 | 25 125 500 ** |
** output is non-linear above 750 FTU.
Further details can be found in the manufacturer's specification sheet.
Processing of Coastal Observatory Sea-Bird 16plus SEACAT with Seapoint Turbidity Sensor data by BODC
The data were provided to BODC in ASCII format, and the series were reformatted into BODC standard internal format using a transfer function. The following table shows how the Originator's variables present in the Seapoint 16plus data were mapped to the appropriate BODC parameter codes.
| Originator's Variable | Units | Description | BODC Parameter Code | Units | Comments |
|---|---|---|---|---|---|
| Temperature | °C | Temperature of the water column | TEMPPR01 | °C | - |
| Conductivity | S m-1 | Electrical conductivity of the water column by in-situ conductivity cell | CNDCPR01 | S m-1 | - |
| Pressure | dbar | Pressure exerted by the water column | PREXPS01 | dbar | - |
| Turbidity | FTU | Turbidity of the water column by Seapoint turbidity meter and laboratory calibration against formazin | TURBSP01 | NTU | FTU=NTU |
| Salinity | None | Practical salinity of the water column by conductivity cell and computation using UNESCO 1983 algorithm | PSALPR01 | None | - |
The reformatted data were visualised using the in-house EDSERPLO software. Suspect data were marked by adding an appropriate quality control flag, missing data by both setting the data to an appropriate value and setting the quality control flag.
General Data Screening carried out by BODC
BODC screen both the series header qualifying information and the parameter values in the data cycles themselves.
Header information is inspected for:
- Irregularities such as unfeasible values
- Inconsistencies between related information, for example:
- Times for instrument deployment and for start/end of data series
- Length of record and the number of data cycles/cycle interval
- Parameters expected and the parameters actually present in the data cycles
- Originator's comments on meter/mooring performance and data quality
Documents are written by BODC highlighting irregularities which cannot be resolved.
Data cycles are inspected using time or depth series plots of all parameters. Currents are additionally inspected using vector scatter plots and time series plots of North and East velocity components. These presentations undergo intrinsic and extrinsic screening to detect infeasible values within the data cycles themselves and inconsistencies as seen when comparing characteristics of adjacent data sets displaced with respect to depth, position or time. Values suspected of being of non-oceanographic origin may be tagged with the BODC flag denoting suspect value; the data values will not be altered.
The following types of irregularity, each relying on visual detection in the plot, are amongst those which may be flagged as suspect:
- Spurious data at the start or end of the record.
- Obvious spikes occurring in periods free from meteorological disturbance.
- A sequence of constant values in consecutive data cycles.
If a large percentage of the data is affected by irregularities then a Problem Report will be written rather than flagging the individual suspect values. Problem Reports are also used to highlight irregularities seen in the graphical data presentations.
Inconsistencies between the characteristics of the data set and those of its neighbours are sought and, where necessary, documented. This covers inconsistencies such as the following:
- Maximum and minimum values of parameters (spikes excluded).
- The occurrence of meteorological events.
This intrinsic and extrinsic screening of the parameter values seeks to confirm the qualifying information and the source laboratory's comments on the series. In screening and collating information, every care is taken to ensure that errors of BODC making are not introduced.
Project Information
Proudman Oceanographic Laboratory Coastal Observatory
The Coastal Observatory was established by Proudman Oceanographic Laboratory as a coastal zone real time observing and monitoring system. The main objective is to understand a coastal sea's response both to natural forcing and to the consequences of human activity. Near real-time measurements will be integrated with coupled models into a pre-operational coastal prediction system whose results will be displayed on the World Wide Web.
The Observatory is expected to grow and evolve as resources and technology allow, all the while building up long time series. A site selection pilot study was carried out in September 2001 and the Observatory became operational in August 2002.
The site is located in Liverpool Bay and is subject to typical coastal sea processes, with strong tides, occasional large storm surges and waves, freshwater input, stable and unstable stratification, high suspended sediment concentration and biogeochemical interaction. Measurements and monitoring will focus on the impacts of storms, variations in river discharge (especially the Mersey), seasonality and blooms in Liverpool Bay.
A variety of methods will be used to obtain measurements, including:
- Moored instruments for in situ time series of currents, temperature and salinity profiles, and surface waves and meteorology. It is hoped that turbidity and chlorophyll measurements will be made at another site as the Observatory progresses;
- The Cefas Smartbuoy for surface properties such as nutrients and chlorophyll, starting late 2002;
- R.V. Prince Madog to carry out spatial surveys and service moorings;
- Instrumented ferries for near surface temperature, salinity, turbidity, chlorophyll and nutrients. The first route will be Liverpool to Douglas, Isle of Man, starting late 2002;
- Drifters for surface currents and properties such as temperature and salinity, starting in 2004;
- Tide gauges, with sensors for meteorology, waves, temperature and salinity, where appropriate;
- Meteorological data from Bidston Observatory and Hilbre Island, HF radar and tide gauge sites;
- Shore-based HF radar measuring waves and surface currents out to a range of 50 km, starting in 2003;
- Satellite data, with infrared for sea surface temperature and visible for chlorophyll and suspended sediment.
The partners currently involved with the project are listed below:
- Proudman Oceanographic Laboratory
- British Oceanographic Data Centre
- UK Meteorological Office
- Centre for Environment, Fisheries and Aquaculture Science
- Environment Agency
- Liverpool University and Port Erin Marine Laboratory
- Bangor University School of Ocean Sciences
- National Oceanography Centre Southampton
- Department of Agriculture and Rural Development in Northern Ireland
A summary of Coastal Observatory cruises to date on R.V. Prince Madog is given in the table below:
| Year | No. of cruises | Work summary |
|---|---|---|
| 2001 | 1 | Site selection and pilot study. 95 CTD casts. |
| 2002 | 4 | POL moorings deployed and serviced Cefas Waverider and SmartBuoy deployed and serviced 103 CTD casts |
| 2003 | 10 | POL moorings serviced Cefas Waverider and SmartBuoy serviced 341 CTD/LISST casts |
| 2004 | 9 | POL moorings serviced Cefas Waverider and SmartBuoy serviced 347 CTD/LISST casts |
| 2005 | 9 | POL moorings serviced Cefas Waverider and SmartBuoy serviced 268 CTD/LISST casts |
| 2006 | 11 | POL moorings serviced Cefas Waverider and SmartBuoy serviced 508 CTD/LISST casts |
| 2007 | 9 | POL moorings serviced Cefas Waverider and SmartBuoy serviced 471 CTD/LISST casts |
| 2008 | 9 | POL moorings serviced Cefas Waverider and SmartBuoy serviced 260 CTD/LISST casts |
| 2009 | 7 | POL moorings serviced Cefas Waverider and SmartBuoy serviced 213 CTD/LISST casts |
| 2010 | 8 | POL moorings serviced Cefas Waverider and SmartBuoy serviced 268 CTD/LISST casts |
| 2011 | 6 | POL moorings serviced Cefas Waverider and SmartBuoy serviced 307 CTD/LISST casts to date, ongoing |
Data Activity or Cruise Information
Data Activity
| Start Date (yyyy-mm-dd) | 2005-01-31 |
| End Date (yyyy-mm-dd) | 2005-04-05 |
| Organization Undertaking Activity | Proudman Oceanographic Laboratory (now National Oceanography Centre, Liverpool) |
| Country of Organization | United Kingdom |
| Originator's Data Activity Identifier | POLRIG913 |
| Platform Category | fixed benthic node |
Proudman Oceanographic Laboratory Rig#913
Deployment and Recovery
This rig was deployed as part of the Liverpool Bay Coastal Observatory during R.V. Prince Madog cruise PD02_05. Sea conditions during deployment were rough; the tide was against the wind (force 5/6 NW) which made for difficult working conditions. As a consequence cruise objectives were severely affected by adverse weather conditions. Upon recovery superficial corrosion was noticed on the burn wire releases.
Recovery of the rig took place during R.V. Prince Madog cruise PD11_05.
| Rig Position | 53 31.994N, 3 22.179W |
|---|---|
| Water Depth | 27.2m |
| Deployed | 31 January 2005 15:22:00 GMT |
| Recovered | 05 April 2005 13:17:00 GMT |
| No. of Days | 64 |
Rig Description
This rig is a bottom frame comprising of the following instruments 0.5 m above the seabed; Waves Acoustic Doppler Current Profiler (ADCP) and a Sea-Bird 16plus. The frame (D2) was fitted with two Benthos releases with fizz links and a spooler with 200 m of rope for recovery of the ballast weight.
| Instrument | Serial Number | Parameters Measured | Sampling Description | Comments |
|---|---|---|---|---|
| RDI Waves ADCP 600 kHz | 5803 | Horizontal current velocity components Vertical current velocity components Temperature Pressure | Mode 1: 100 pings every 10 minutes (velocity standard deviation 0.007 m s-1). 35 x 1 m bins (2.65 - 36.65 m above the bed). | No Data due to problems with battery communications and date readings. |
| Sea-Bird 16plus V RS-485 1.0 | 4736 | Temperature Conductivity Pressure Turbidity Fluorescence | Sample interval 600 s; digiquartz integration time 40 s (Paros unit=40), 1 s delay before sampling, pump on for 0.5 s before sampling. | SeaPoint turbidity sensor: S/N 10320 taped to roll bar; set up for 0 - 25 FTU range. SCUFA Fluorimeter: Fluorescence sensor 0 - 5 V range 0 - 80 ug/l, turbidity sensor 0 - 5V range 0 - 200 FTU. Clock set at 10:30 on 31 January 2005; delayed start at 12:00:00 on 31 January 2005. Upon recovery the clock was found to be running 33 s fast. |
Cruise
| Cruise Name | PD02/05 |
| Departure Date | 2005-01-31 |
| Arrival Date | 2005-02-01 |
| Principal Scientist(s) | Phil J Knight (Proudman Oceanographic Laboratory) |
| Ship | RV Prince Madog |
Complete Cruise Metadata Report is available here
Fixed Station Information
Fixed Station Information
| Station Name | COA |
| Category | Offshore area |
| Latitude | 53° 31.51' N |
| Longitude | 3° 23.00' W |
| Water depth below MSL | 26.0 m |
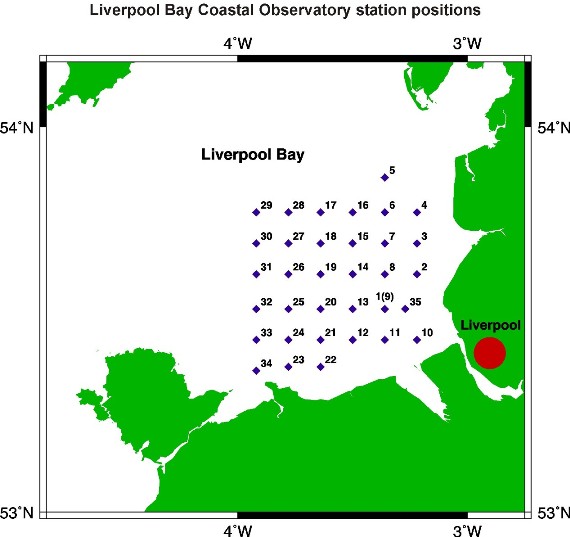
Liverpool Bay Coastal Observatory Mooring Site A (COA/Site 1/Site 9)
This station is the main mooring site for the Proudman Oceanographic Laboratory (POL) Liverpool Bay Coastal Observatory and was first occupied in 2002. It is also known both as Coastal Observatory Site 1 and Site 9. POL perform two main types of activities at this station: they deploy moorings; and in addition, they take CTD profiles during each site visit. The station lies within a box of mean water depth 22.5 m with the following coordinates:
| Box Corner | Latitude (+ve North) | Longitude (+ve East) |
|---|---|---|
| North-west corner | 53.54097 | -3.42958 |
| South-east corner | 53.50945 | -3.33714 |
The position of this station relative to the other POL Coastal Observatory sites can be seen from the figure below.
Mooring Deployment History
2011
| Rig Type | Typical Instruments | Rig IDs | Comment |
|---|---|---|---|
| Frame | ADCP, CTD, OBS, OXY | 1117, 1121, 1125, 1127, 1130, 1132, | January - November |
| SmartBuoy | CTD x 2, AC-S, CT x 2, FL x 3, OBS x 2, PAR x 2, WMS, NAS, OXY, T x 2 | 1116, 1120, 1124 | January - November |
2010
| Rig Type | Typical Instruments | Rig IDs | Comment |
|---|---|---|---|
| Frame | ADCP, CTD, ADV, OBS | 1086, 1090, 1094, 1098, 1102, 1106, 1109 | January - December |
| SmartBuoy | CT x 2, FL x 2, OBS, PAR x 2, WMS, NAS, CTD, OXY, BD, T | 1085, 1089, 1093, 1097, 1101, 1105, 1108, 1112 | January - December |
2009
| Rig Type | Typical Instruments | Rig IDs | Comment |
|---|---|---|---|
| Frame | ADCP, CTD, ADV, OBS | 1055, 1062, 1067, 1071, 1074, 1078, 1082 | January - December |
| SmartBuoy | CT x 2, FL x 2, OBS, PAR x 2, WMS, NAS, CTD, OXY, BD, T | 1054, 1061, 1066, 1070, 1073, 1077, 1081 | January - December |
2008
| Rig Type | Typical Instruments | Rig IDs | Comment |
|---|---|---|---|
| Frame | ADCP, CTD, ADV, OBS | 1024, 1028, 1032, 1036, 1041, 1044, 1047, 1051 | January - December |
| SmartBuoy | CT x 2, FL x 2, OBS, PAR x 2, WMS, NAS, CTD, OXY, BD, T | LB1_047/1023, LB1_048/1027, LB1_049/1031, LB1_050/1035, 1040, 1043, LB1_053/1050 | January - December |
2007
| Rig Type | Typical Instruments | Rig IDs | Comment |
|---|---|---|---|
| Frame | ADCP, CTD, ADV, OBS | 990, 997, 1001, 1005, 1010, 1014, 1017, 1021 | January - December |
| SmartBuoy | CT x 2, FL x 2, OBS, PAR x 2, WMS, NAS, CTD, OXY, BD, T | LB1_039/989, LB1_040/996, LB1_041/1000, LB1_042/1004, LB1_043/1009, LB1_044/1013, LB1_045/1016, LB1_046/1020 | January - December |
2006
| Rig Type | Typical Instruments | Rig IDs | Comment |
|---|---|---|---|
| Frame | ADCP, CTD, ADV, OBS | 951, 962, 966, 970, 974, 978, 982, 986 | January - December |
| SmartBuoy | CT x 2, FL x 2, OBS, PAR x 2, WMS, NAS, CTD, OXY, BD | 958, 961, 965, 969, 973, 977, LB1_037/981, LB1_038/985 | January - December |
2005
| Rig Type | Typical Instruments | Rig IDs | Comment |
|---|---|---|---|
| Frame | ADCP, CT | 913, 914, 921, 925, 929, 933, 938, 942, 945, 949 | January - December |
| SmartBuoy | CT, FL, OBS, PAR, WMS, NAS, OXY | 912, 920, 924, 928, 932, 937, LB1_028/941, LB1_029/944, LB1_030/948 | January - December |
| Frame with telemetry buoy | ADCP | 914 | March - April |
2004
| Rig Type | Typical Instruments | Rig IDs | Comment |
|---|---|---|---|
| Frame | BPR, ADCP, TR, CT | 890, 892, 893, 896, 898, 900, 902, 904, 907, 908, 910, 911 | January - December |
| SmartBuoy | CT, FL, OBS, PAR, WMS, NAS | 889, 891, 895, 897, 899, 901, 903, 906, 909 | January - December |
| Frame with telemetry buoy | ADCP | 893, 908, 911 | April - May, October - December |
2003
| Rig Type | Instruments | Rig IDs | Comment |
|---|---|---|---|
| Frame | BPR, ADCP, TR, CT | 861, 864, 866, 869, 872, 878, 880, 883, 885, 887, 888 | January - December |
| SmartBuoy | CT, FL, OBS, PAR, WMS, NAS | 863, 865, 867, 870, 871, 877, 879, 882, 884, 886 | January - December |
2002
| Rig Type | Instruments | Rig IDs | Comment |
|---|---|---|---|
| Frame | BPR, ADCP, TR, CT | 851, 854, 856, 858 | August - December |
| Line mooring | CT x 3 | 853, 855 | August - November |
| SmartBuoy | CT, FL, OBS, PAR, WMS, NAS | 857, 860 | November - December |
2001
| Rig Type | Instruments | Rig IDs | Comment |
|---|---|---|---|
| Frame | ADCP, OBS | 838, 839, 840, 841, 843, 844, 845, 846, 848, 849 | September |
CTD Sampling History
| Year | Number of Cruises | Total Casts per year |
| 2011 | 6 | 116 including a 46 cast tidal cycle from 2011-04-18 to 2011-04-19 and a 51 cast tidal cycle station from 2011-07-27 to 2011-07-28 |
| 2010 | 8 | 71 including a 52 cast tidal cycle station from 2010-04-28 to 2010-04-29 |
| 2009 | 7 | 21 |
| 2008 | 9 | 75 including a 54 cast tidal cycle station from 2008-05-13 to 2008-05-14 |
| 2007 | 8 | 71 including a 51 cast tidal cycle station from 2007-05-15 to 2007-05-16 |
| 2006 | 9 | 72 including a 53 cast tidal cycle station from 2006-05-09 to 2006-05-10 |
| 2005 | 9 | 41 including a 22 cast tidal cycle station from 2005-04-05 to 2005-04-06 |
| 2004 | 9 | 77 including a 54 cast tidal cycle station from 2004-05-11 to 2004-05-12 |
| 2003 | 10 | 28 |
| 2002 | 4 | 13 |
The CTD instrument package for these cruises was a Sea-Bird 911plus, with beam transmissometer, fluorometer, LICOR PAR sensor, LISST-25, and oxygen sensor.
Key
AC-S = Absorption and attenuation spectrophotometer
ADCP = Acoustic Doppler Current Profiler
ADV = Acoustic Doppler Velocimeter
BD = Bacterial degradation experiment
BPR = Bottom Pressure Recorder
CT = Conductivity and temperature logger
CTD = Conductivity, temperature, depth sensor
FL = Fluorometer
NAS = in-situ nutrient analyser
OBS = Optical Backscatter Turbidity meter
OXY = Oxygen sensor
PAR = PAR sensor
T = Temperature logger
TR = Transmissometer
WMS = Automatic water sampler
Related Fixed Station activities are detailed in Appendix 1
BODC Quality Control Flags
The following single character qualifying flags may be associated with one or more individual parameters with a data cycle:
| Flag | Description |
|---|---|
| Blank | Unqualified |
| < | Below detection limit |
| > | In excess of quoted value |
| A | Taxonomic flag for affinis (aff.) |
| B | Beginning of CTD Down/Up Cast |
| C | Taxonomic flag for confer (cf.) |
| D | Thermometric depth |
| E | End of CTD Down/Up Cast |
| G | Non-taxonomic biological characteristic uncertainty |
| H | Extrapolated value |
| I | Taxonomic flag for single species (sp.) |
| K | Improbable value - unknown quality control source |
| L | Improbable value - originator's quality control |
| M | Improbable value - BODC quality control |
| N | Null value |
| O | Improbable value - user quality control |
| P | Trace/calm |
| Q | Indeterminate |
| R | Replacement value |
| S | Estimated value |
| T | Interpolated value |
| U | Uncalibrated |
| W | Control value |
| X | Excessive difference |
SeaDataNet Quality Control Flags
The following single character qualifying flags may be associated with one or more individual parameters with a data cycle:
| Flag | Description |
|---|---|
| 0 | no quality control |
| 1 | good value |
| 2 | probably good value |
| 3 | probably bad value |
| 4 | bad value |
| 5 | changed value |
| 6 | value below detection |
| 7 | value in excess |
| 8 | interpolated value |
| 9 | missing value |
| A | value phenomenon uncertain |
| B | nominal value |
| Q | value below limit of quantification |
Appendix 1: COA
Related series for this Fixed Station are presented in the table below. Further information can be found by following the appropriate links.
If you are interested in these series, please be aware we offer a multiple file download service. Should your credentials be insufficient for automatic download, the service also offers a referral to our Enquiries Officer who may be able to negotiate access.
| Series Identifier | Data Category | Start date/time | Start position | Cruise |
|---|---|---|---|---|
| 592938 | Hydrography time series at depth | 2002-08-07 12:14:00 | 53.5328 N, 3.3698 W | RV Prince Madog PD20/02 |
| 592914 | Hydrography time series at depth | 2002-08-07 12:15:00 | 53.5328 N, 3.3698 W | RV Prince Madog PD20/02 |
| 592926 | Hydrography time series at depth | 2002-08-07 12:15:00 | 53.5328 N, 3.3698 W | RV Prince Madog PD20/02 |
| 636790 | Offshore sea floor pressure series | 2002-08-07 12:49:40 | 53.5328 N, 3.3673 W | RV Prince Madog PD20/02 |
| 593235 | Currents -subsurface Eulerian | 2002-08-07 12:55:00 | 53.5328 N, 3.3673 W | RV Prince Madog PD20/02 |
| 592951 | Hydrography time series at depth | 2002-08-07 12:55:00 | 53.5328 N, 3.3673 W | RV Prince Madog PD20/02 |
| 636821 | Hydrography time series at depth | 2002-09-25 18:44:00 | 53.5332 N, 3.3668 W | RV Prince Madog PD24/02 |
| 636833 | Hydrography time series at depth | 2002-09-25 18:45:00 | 53.5332 N, 3.3668 W | RV Prince Madog PD24/02 |
| 636857 | Hydrography time series at depth | 2002-09-25 18:45:00 | 53.5332 N, 3.3668 W | RV Prince Madog PD24/02 |
| 646249 | Hydrography time series at depth | 2002-09-25 19:10:03 | 53.5332 N, 3.3632 W | RV Prince Madog PD24/02 |
| 603784 | Currents -subsurface Eulerian | 2002-09-25 19:15:00 | 53.5332 N, 3.3632 W | Not applicable |
| 636845 | Hydrography time series at depth | 2002-09-25 19:15:00 | 53.5332 N, 3.3632 W | RV Prince Madog PD24/02 |
| 636808 | Offshore sea floor pressure series | 2002-09-25 19:19:40 | 53.5332 N, 3.3632 W | RV Prince Madog PD24/02 |
| 646201 | Hydrography time series at depth | 2002-11-13 14:10:10 | 53.5328 N, 3.3627 W | RV Prince Madog PD31/02 |
| 646065 | Offshore sea floor pressure series | 2002-11-13 14:10:28 | 53.5328 N, 3.3627 W | RV Prince Madog PD31/02 |
| 646317 | Hydrography time series at depth | 2002-11-13 14:15:00 | 53.5328 N, 3.3627 W | RV Prince Madog PD31/02 |
| 646194 | Hydrography time series at depth | 2002-11-13 14:55:00 | 53.5322 N, 3.3672 W | RV Prince Madog PD31/02 |
| 1195259 | Hydrography time series at depth | 2002-11-13 15:00:00 | 53.53215 N, 3.36722 W | RV Prince Madog PD31/02 |
| 1193241 | PAR radiance and irradiance | 2002-11-13 15:00:00 | 53.53215 N, 3.36722 W | RV Prince Madog PD31/02 |
| 1193216 | Transmittance/attenuance, turbidity, or SPM conc. | 2002-11-13 15:00:00 | 53.53215 N, 3.36722 W | RV Prince Madog PD31/02 |
| 1193228 | Water column chemistry | 2002-11-13 16:00:00 | 53.53215 N, 3.36722 W | RV Prince Madog PD31/02 |
| 1193204 | Fluorescence or pigments | 2002-11-13 22:00:00 | 53.53215 N, 3.36722 W | RV Prince Madog PD31/02 |
| 1193253 | Water column chemistry | 2002-11-14 00:00:00 | 53.53215 N, 3.36722 W | RV Prince Madog PD31/02 |
| 646250 | Hydrography time series at depth | 2002-12-12 15:40:01 | 53.534 N, 3.3625 W | RV Prince Madog PD35/02 |
| 646330 | Hydrography time series at depth | 2002-12-12 15:45:00 | 53.534 N, 3.3625 W | RV Prince Madog PD35/02 |
| 646089 | Offshore sea floor pressure series | 2002-12-12 15:49:40 | 53.534 N, 3.3625 W | RV Prince Madog PD35/02 |
| 646237 | Hydrography time series at depth | 2002-12-12 16:55:00 | 53.532 N, 3.3742 W | RV Prince Madog PD35/02 |
| 1193277 | Fluorescence or pigments | 2002-12-12 17:00:00 | 53.53195 N, 3.3742 W | RV Prince Madog PD35/02 |
| 1193265 | Hydrography time series at depth | 2002-12-12 17:00:00 | 53.53195 N, 3.3742 W | RV Prince Madog PD35/02 |
| 1199875 | PAR radiance and irradiance | 2002-12-12 17:00:00 | 53.53195 N, 3.3742 W | RV Prince Madog PD35/02 |
| 1199887 | PAR radiance and irradiance | 2002-12-12 17:00:00 | 53.53195 N, 3.3742 W | RV Prince Madog PD35/02 |
| 1193289 | Transmittance/attenuance, turbidity, or SPM conc. | 2002-12-12 17:00:00 | 53.53195 N, 3.3742 W | RV Prince Madog PD35/02 |
| 1193290 | Water column chemistry | 2002-12-12 20:00:00 | 53.53195 N, 3.3742 W | RV Prince Madog PD35/02 |
| 646090 | Hydrography time series at depth | 2003-01-23 15:45:00 | 53.533 N, 3.3817 W | RV Prince Madog PD02/03 |
| 1193321 | Fluorescence or pigments | 2003-01-23 16:00:00 | 53.53323 N, 3.38145 W | RV Prince Madog PD02/03 |
| 1193308 | Hydrography time series at depth | 2003-01-23 16:00:00 | 53.53323 N, 3.38145 W | RV Prince Madog PD02/03 |
| 1193345 | PAR radiance and irradiance | 2003-01-23 16:00:00 | 53.53323 N, 3.38145 W | RV Prince Madog PD02/03 |
| 1193333 | Transmittance/attenuance, turbidity, or SPM conc. | 2003-01-23 16:00:00 | 53.53323 N, 3.38145 W | RV Prince Madog PD02/03 |
| 646004 | Offshore sea floor pressure series | 2003-01-23 16:29:40 | 53.5328 N, 3.3603 W | RV Prince Madog PD02/03 |
| 646108 | Hydrography time series at depth | 2003-01-23 16:30:00 | 53.5328 N, 3.3603 W | RV Prince Madog PD02/03 |
| 646262 | Hydrography time series at depth | 2003-01-23 16:35:00 | 53.5328 N, 3.3603 W | RV Prince Madog PD02/03 |
| 1193357 | Water column chemistry | 2003-01-24 00:00:00 | 53.53323 N, 3.38145 W | RV Prince Madog PD02/03 |
| 646121 | Hydrography time series at depth | 2003-03-06 14:24:00 | 53.5345 N, 3.3687 W | RV Prince Madog PD10/03 |
| 1193370 | Fluorescence or pigments | 2003-03-06 14:30:00 | 53.53447 N, 3.36863 W | RV Prince Madog PD10/03 |
| 1193369 | Hydrography time series at depth | 2003-03-06 14:30:00 | 53.53447 N, 3.36863 W | RV Prince Madog PD10/03 |
| 1193394 | PAR radiance and irradiance | 2003-03-06 14:30:00 | 53.53447 N, 3.36863 W | RV Prince Madog PD10/03 |
| 1193382 | Transmittance/attenuance, turbidity, or SPM conc. | 2003-03-06 14:30:00 | 53.53447 N, 3.36863 W | RV Prince Madog PD10/03 |
| 646274 | Hydrography time series at depth | 2003-03-06 14:45:00 | 53.5332 N, 3.364 W | RV Prince Madog PD10/03 |
| 646016 | Offshore sea floor pressure series | 2003-03-06 14:49:40 | 53.5332 N, 3.364 W | RV Prince Madog PD10/03 |
| 1193401 | Water column chemistry | 2003-03-07 00:00:00 | 53.53447 N, 3.36863 W | RV Prince Madog PD10/03 |
| 646286 | Hydrography time series at depth | 2003-04-16 13:45:00 | 53.5367 N, 3.3713 W | RV Prince Madog PD17/03 |
| 646028 | Offshore sea floor pressure series | 2003-04-16 13:49:40 | 53.5367 N, 3.3713 W | RV Prince Madog PD17/03 |
| 646145 | Hydrography time series at depth | 2003-04-16 13:50:00 | 53.5367 N, 3.3713 W | RV Prince Madog PD17/03 |
| 646133 | Hydrography time series at depth | 2003-04-16 15:25:00 | 53.538 N, 3.3718 W | RV Prince Madog PD17/03 |
| 1193425 | Fluorescence or pigments | 2003-04-16 15:30:00 | 53.53793 N, 3.37182 W | RV Prince Madog PD17/03 |
| 1193413 | Hydrography time series at depth | 2003-04-16 15:30:00 | 53.53793 N, 3.37182 W | RV Prince Madog PD17/03 |
| 1193450 | PAR radiance and irradiance | 2003-04-16 15:30:00 | 53.53793 N, 3.37182 W | RV Prince Madog PD17/03 |
| 1193462 | PAR radiance and irradiance | 2003-04-16 15:30:00 | 53.53793 N, 3.37182 W | RV Prince Madog PD17/03 |
| 1193437 | Transmittance/attenuance, turbidity, or SPM conc. | 2003-04-16 15:30:00 | 53.53793 N, 3.37182 W | RV Prince Madog PD17/03 |
| 1193449 | Water column chemistry | 2003-04-16 19:00:00 | 53.53793 N, 3.37182 W | RV Prince Madog PD17/03 |
| 1193474 | Water column chemistry | 2003-04-17 00:00:00 | 53.53793 N, 3.37182 W | RV Prince Madog PD17/03 |
| 1622780 | Currents -subsurface Eulerian | 2003-05-26 14:30:00 | 53.53717 N, 3.36667 W | RV Prince Madog PD23/03A |
| 646169 | Hydrography time series at depth | 2003-05-26 14:30:21 | 53.5372 N, 3.3667 W | RV Prince Madog PD23/03A |
| 646298 | Hydrography time series at depth | 2003-05-26 14:35:00 | 53.5372 N, 3.3667 W | RV Prince Madog PD23/03A |
| 646041 | Offshore sea floor pressure series | 2003-05-26 14:39:40 | 53.5372 N, 3.3667 W | RV Prince Madog PD23/03A |
| 1193498 | Fluorescence or pigments | 2003-05-26 15:00:00 | 53.5401 N, 3.37448 W | RV Prince Madog PD23/03A |
| 1193486 | Hydrography time series at depth | 2003-05-26 15:00:00 | 53.5401 N, 3.37448 W | RV Prince Madog PD23/03A |
| 1193517 | PAR radiance and irradiance | 2003-05-26 15:00:00 | 53.5401 N, 3.37448 W | RV Prince Madog PD23/03A |
| 1193529 | PAR radiance and irradiance | 2003-05-26 15:00:00 | 53.5401 N, 3.37448 W | RV Prince Madog PD23/03A |
| 1193505 | Transmittance/attenuance, turbidity, or SPM conc. | 2003-05-26 15:00:00 | 53.5401 N, 3.37448 W | RV Prince Madog PD23/03A |
| 646157 | Hydrography time series at depth | 2003-05-26 15:55:00 | 53.5402 N, 3.3745 W | RV Prince Madog PD23/03A |
| 1193542 | Fluorescence or pigments | 2003-06-26 10:30:00 | 53.53812 N, 3.3712 W | RV Prince Madog PD25/03B |
| 1193530 | Hydrography time series at depth | 2003-06-26 10:30:00 | 53.53812 N, 3.3712 W | RV Prince Madog PD25/03B |
| 1193578 | PAR radiance and irradiance | 2003-06-26 10:30:00 | 53.53812 N, 3.3712 W | RV Prince Madog PD25/03B |
| 1193591 | PAR radiance and irradiance | 2003-06-26 10:30:00 | 53.53812 N, 3.3712 W | RV Prince Madog PD25/03B |
| 1193554 | Transmittance/attenuance, turbidity, or SPM conc. | 2003-06-26 10:30:00 | 53.53812 N, 3.3712 W | RV Prince Madog PD25/03B |
| 1622792 | Currents -subsurface Eulerian | 2003-06-26 10:40:00 | 53.53617 N, 3.36567 W | RV Prince Madog PD25/03B |
| 646053 | Offshore sea floor pressure series | 2003-06-26 10:40:26 | 53.5362 N, 3.3657 W | RV Prince Madog PD25/03B |
| 646170 | Hydrography time series at depth | 2003-06-26 10:45:00 | 53.53812 N, 3.3712 W | RV Prince Madog PD25/03B |
| 646305 | Hydrography time series at depth | 2003-06-26 10:45:00 | 53.5362 N, 3.3657 W | RV Prince Madog PD25/03B |
| 646182 | Hydrography time series at depth | 2003-06-26 12:00:00 | 53.5362 N, 3.3657 W | RV Prince Madog PD25/03B |
| 1193566 | Water column chemistry | 2003-06-26 12:00:00 | 53.53812 N, 3.3712 W | RV Prince Madog PD25/03B |
| 1193609 | Water column chemistry | 2003-06-27 00:00:00 | 53.53812 N, 3.3712 W | RV Prince Madog PD25/03B |
| 1622860 | Currents -subsurface Eulerian | 2003-07-24 12:10:00 | 53.53617 N, 3.366 W | RV Prince Madog PD31/03 |
| 646225 | Hydrography time series at depth | 2003-07-24 12:10:01 | 53.5362 N, 3.366 W | RV Prince Madog PD31/03 |
| 646077 | Offshore sea floor pressure series | 2003-07-24 12:10:29 | 53.5362 N, 3.366 W | RV Prince Madog PD31/03 |
| 646329 | Hydrography time series at depth | 2003-07-24 12:15:00 | 53.5362 N, 3.366 W | RV Prince Madog PD31/03 |
| 646213 | Hydrography time series at depth | 2003-07-24 12:45:00 | 53.5385 N, 3.37 W | RV Prince Madog PD31/03 |
| 1193622 | Fluorescence or pigments | 2003-07-24 13:00:00 | 53.5385 N, 3.37 W | RV Prince Madog PD31/03 |
| 1193610 | Hydrography time series at depth | 2003-07-24 13:00:00 | 53.5385 N, 3.37 W | RV Prince Madog PD31/03 |
| 1193658 | PAR radiance and irradiance | 2003-07-24 13:00:00 | 53.5385 N, 3.37 W | RV Prince Madog PD31/03 |
| 1193671 | PAR radiance and irradiance | 2003-07-24 13:00:00 | 53.5385 N, 3.37 W | RV Prince Madog PD31/03 |
| 1193634 | Transmittance/attenuance, turbidity, or SPM conc. | 2003-07-24 13:00:00 | 53.5385 N, 3.37 W | RV Prince Madog PD31/03 |
| 1193646 | Water column chemistry | 2003-07-24 14:00:00 | 53.5385 N, 3.37 W | RV Prince Madog PD31/03 |
| 1193683 | Water column chemistry | 2003-07-25 00:00:00 | 53.5385 N, 3.37 W | RV Prince Madog PD31/03 |
| 646366 | Hydrography time series at depth | 2003-08-20 12:30:00 | 53.5358 N, 3.3625 W | RV Prince Madog PD34/03 |
| 1622884 | Currents -subsurface Eulerian | 2003-08-20 12:30:16 | 53.53583 N, 3.3625 W | RV Prince Madog PD34/03 |
| 646378 | Offshore sea floor pressure series | 2003-08-20 12:30:27 | 53.5358 N, 3.3625 W | RV Prince Madog PD34/03 |
| 646354 | Hydrography time series at depth | 2003-08-20 12:35:00 | 53.5358 N, 3.3625 W | RV Prince Madog PD34/03 |
| 646342 | Hydrography time series at depth | 2003-08-20 12:55:00 | 53.5347 N, 3.3667 W | RV Prince Madog PD34/03 |
| 1193702 | Fluorescence or pigments | 2003-08-20 13:00:00 | 53.53473 N, 3.36667 W | RV Prince Madog PD34/03 |
| 1193695 | Hydrography time series at depth | 2003-08-20 13:00:00 | 53.53473 N, 3.36667 W | RV Prince Madog PD34/03 |
| 1193738 | PAR radiance and irradiance | 2003-08-20 13:00:00 | 53.53473 N, 3.36667 W | RV Prince Madog PD34/03 |
| 1193751 | PAR radiance and irradiance | 2003-08-20 13:00:00 | 53.53473 N, 3.36667 W | RV Prince Madog PD34/03 |
| 1193714 | Transmittance/attenuance, turbidity, or SPM conc. | 2003-08-20 13:00:00 | 53.53473 N, 3.36667 W | RV Prince Madog PD34/03 |
| 1193726 | Water column chemistry | 2003-08-20 14:00:00 | 53.53473 N, 3.36667 W | RV Prince Madog PD34/03 |
| 1193763 | Water column chemistry | 2003-08-21 00:00:00 | 53.53473 N, 3.36667 W | RV Prince Madog PD34/03 |
| 1622915 | Currents -subsurface Eulerian | 2003-09-24 11:50:00 | 53.535 N, 3.3605 W | RV Prince Madog PD38/03 |
| 647007 | Hydrography time series at depth | 2003-09-24 11:50:01 | 53.535 N, 3.3605 W | RV Prince Madog PD38/03 |
| 647019 | Hydrography time series at depth | 2003-09-24 11:50:01 | 53.535 N, 3.3605 W | RV Prince Madog PD38/03 |
| 646968 | Offshore sea floor pressure series | 2003-09-24 11:50:28 | 53.535 N, 3.3605 W | RV Prince Madog PD38/03 |
| 646993 | Hydrography time series at depth | 2003-09-24 11:55:00 | 53.535 N, 3.3605 W | RV Prince Madog PD38/03 |
| 646981 | Hydrography time series at depth | 2003-09-24 12:15:00 | 53.5347 N, 3.362 W | RV Prince Madog PD38/03 |
| 1193787 | Fluorescence or pigments | 2003-09-24 12:30:00 | 53.53458 N, 3.36193 W | RV Prince Madog PD38/03 |
| 1193775 | Hydrography time series at depth | 2003-09-24 12:30:00 | 53.53458 N, 3.36193 W | RV Prince Madog PD38/03 |
| 1193818 | PAR radiance and irradiance | 2003-09-24 12:30:00 | 53.53458 N, 3.36193 W | RV Prince Madog PD38/03 |
| 1193831 | PAR radiance and irradiance | 2003-09-24 12:30:00 | 53.53458 N, 3.36193 W | RV Prince Madog PD38/03 |
| 1193799 | Transmittance/attenuance, turbidity, or SPM conc. | 2003-09-24 12:30:00 | 53.53458 N, 3.36193 W | RV Prince Madog PD38/03 |
| 1193806 | Water column chemistry | 2003-09-24 14:06:13 | 53.53458 N, 3.36193 W | RV Prince Madog PD38/03 |
| 1193843 | Water column chemistry | 2003-09-25 00:00:00 | 53.53458 N, 3.36193 W | RV Prince Madog PD38/03 |
| 1622952 | Currents -subsurface Eulerian | 2003-10-28 13:10:00 | 53.53333 N, 3.362 W | RV Prince Madog PD44/03 |
| 647044 | Hydrography time series at depth | 2003-10-28 13:10:00 | 53.5333 N, 3.362 W | Not applicable |
| 647056 | Offshore sea floor pressure series | 2003-10-28 13:10:00 | 53.5333 N, 3.362 W | Not applicable |
| 647032 | Hydrography time series at depth | 2003-10-28 13:15:00 | 53.5333 N, 3.362 W | Not applicable |
| 647020 | Hydrography time series at depth | 2003-10-28 13:25:00 | 53.5337 N, 3.3632 W | Not applicable |
| 1193867 | Fluorescence or pigments | 2003-10-28 13:30:00 | 53.53367 N, 3.36317 W | RV Prince Madog PD44/03 |
| 1193855 | Hydrography time series at depth | 2003-10-28 13:30:00 | 53.53367 N, 3.36317 W | RV Prince Madog PD44/03 |
| 1193880 | PAR radiance and irradiance | 2003-10-28 13:30:00 | 53.53367 N, 3.36317 W | RV Prince Madog PD44/03 |
| 1193892 | PAR radiance and irradiance | 2003-10-28 13:30:00 | 53.53367 N, 3.36317 W | RV Prince Madog PD44/03 |
| 1193879 | Transmittance/attenuance, turbidity, or SPM conc. | 2003-10-28 13:30:00 | 53.53367 N, 3.36317 W | RV Prince Madog PD44/03 |
| 1193911 | Water column chemistry | 2003-10-31 00:00:00 | 53.53367 N, 3.36317 W | RV Prince Madog PD44/03 |
| 1622964 | Currents -subsurface Eulerian | 2003-12-17 12:50:02 | 53.5335 N, 3.36117 W | RV Prince Madog PD48/03 |
| 647093 | Hydrography time series at depth | 2003-12-17 12:55:00 | 53.5335 N, 3.3612 W | Not applicable |
| 647112 | Hydrography time series at depth | 2003-12-17 13:00:00 | 53.5335 N, 3.3612 W | Not applicable |
| 647068 | Offshore sea floor pressure series | 2003-12-17 13:00:00 | 53.5335 N, 3.3612 W | Not applicable |
| 647081 | Hydrography time series at depth | 2003-12-17 13:15:00 | 53.5338 N, 3.3643 W | Not applicable |
| 647100 | Hydrography time series at depth | 2003-12-17 13:20:00 | 53.5338 N, 3.3643 W | Not applicable |
| 1193935 | Fluorescence or pigments | 2003-12-17 13:30:00 | 53.53378 N, 3.36428 W | RV Prince Madog PD48/03 |
| 1193923 | Hydrography time series at depth | 2003-12-17 13:30:00 | 53.53378 N, 3.36428 W | RV Prince Madog PD48/03 |
| 1193947 | PAR radiance and irradiance | 2003-12-17 13:30:00 | 53.53378 N, 3.36428 W | RV Prince Madog PD48/03 |
| 1193959 | PAR radiance and irradiance | 2003-12-17 13:30:00 | 53.53378 N, 3.36428 W | RV Prince Madog PD48/03 |
| 1622675 | Currents -subsurface Eulerian | 2004-02-24 14:40:00 | 53.53167 N, 3.3615 W | RV Prince Madog PD06/04 |
| 662667 | Offshore sea floor pressure series | 2004-02-24 14:40:26 | 53.53167 N, 3.3615 W | RV Prince Madog PD06/04 |
| 662692 | Hydrography time series at depth | 2004-02-24 14:45:00 | 53.53167 N, 3.3615 W | RV Prince Madog PD06/04 |
| 662679 | Hydrography time series at depth | 2004-02-24 14:50:00 | 53.53167 N, 3.3615 W | RV Prince Madog PD06/04 |
| 662680 | Hydrography time series at depth | 2004-02-24 15:15:00 | 53.5335 N, 3.35983 W | RV Prince Madog PD06/04 |
| 1193972 | Fluorescence or pigments | 2004-02-24 16:00:00 | 53.53468 N, 3.36012 W | RV Prince Madog PD06/04 |
| 1193960 | Hydrography time series at depth | 2004-02-24 16:00:00 | 53.53468 N, 3.36012 W | RV Prince Madog PD06/04 |
| 1194011 | PAR radiance and irradiance | 2004-02-24 16:00:00 | 53.53468 N, 3.36012 W | RV Prince Madog PD06/04 |
| 1194023 | PAR radiance and irradiance | 2004-02-24 16:00:00 | 53.53468 N, 3.36012 W | RV Prince Madog PD06/04 |
| 1193984 | Transmittance/attenuance, turbidity, or SPM conc. | 2004-02-24 16:00:00 | 53.53468 N, 3.36012 W | RV Prince Madog PD06/04 |
| 1193996 | Water column chemistry | 2004-02-24 16:00:00 | 53.53468 N, 3.36012 W | RV Prince Madog PD06/04 |
| 1194035 | Water column chemistry | 2004-02-25 00:00:00 | 53.53468 N, 3.36012 W | RV Prince Madog PD06/04 |
| 1622687 | Currents -subsurface Eulerian | 2004-04-01 09:50:00 | 53.53217 N, 3.36383 W | RV Prince Madog PD11/04B |
| 662759 | Hydrography time series at depth | 2004-04-01 09:50:01 | 53.53217 N, 3.36383 W | RV Prince Madog PD11/04B |
| 662711 | Offshore sea floor pressure series | 2004-04-01 09:50:29 | 53.53217 N, 3.36383 W | RV Prince Madog PD11/04B |
| 662735 | Hydrography time series at depth | 2004-04-01 09:55:00 | 53.53217 N, 3.36383 W | RV Prince Madog PD11/04B |
| 662747 | Hydrography time series at depth | 2004-04-01 10:20:01 | 53.533 N, 3.3685 W | RV Prince Madog PD11/04B |
| 662723 | Hydrography time series at depth | 2004-04-01 10:25:00 | 53.533 N, 3.3685 W | RV Prince Madog PD11/04B |
| 1194059 | Fluorescence or pigments | 2004-04-01 10:30:00 | 53.533 N, 3.3685 W | RV Prince Madog PD11/04B |
| 1194047 | Hydrography time series at depth | 2004-04-01 10:30:00 | 53.533 N, 3.3685 W | RV Prince Madog PD11/04B |
| 1194084 | PAR radiance and irradiance | 2004-04-01 10:30:00 | 53.533 N, 3.3685 W | RV Prince Madog PD11/04B |
| 1194096 | PAR radiance and irradiance | 2004-04-01 10:30:00 | 53.533 N, 3.3685 W | RV Prince Madog PD11/04B |
| 1194060 | Transmittance/attenuance, turbidity, or SPM conc. | 2004-04-01 10:30:00 | 53.533 N, 3.3685 W | RV Prince Madog PD11/04B |
| 1194072 | Water column chemistry | 2004-04-01 10:52:17 | 53.533 N, 3.3685 W | RV Prince Madog PD11/04B |
| 1194103 | Water column chemistry | 2004-04-03 00:00:00 | 53.533 N, 3.3685 W | RV Prince Madog PD11/04B |
| 1622718 | Currents -subsurface Eulerian | 2004-05-11 12:10:00 | 53.533 N, 3.36167 W | RV Prince Madog PD18/04 |
| 664188 | Hydrography time series at depth | 2004-05-11 12:10:01 | 53.533 N, 3.36167 W | RV Prince Madog PD18/04 |
| 664152 | Offshore sea floor pressure series | 2004-05-11 12:10:27 | 53.533 N, 3.36167 W | RV Prince Madog PD18/04 |
| 664207 | Hydrography time series at depth | 2004-05-11 12:15:00 | 53.533 N, 3.36167 W | RV Prince Madog PD18/04 |
| 664176 | Hydrography time series at depth | 2004-05-11 12:50:01 | 53.53167 N, 3.36233 W | RV Prince Madog PD18/04 |
| 664164 | Hydrography time series at depth | 2004-05-11 12:55:00 | 53.53167 N, 3.36233 W | RV Prince Madog PD18/04 |
| 1194127 | Fluorescence or pigments | 2004-05-11 13:00:00 | 53.5317 N, 3.3623 W | RV Prince Madog PD18/04 |
| 1194115 | Hydrography time series at depth | 2004-05-11 13:00:00 | 53.5317 N, 3.3623 W | RV Prince Madog PD18/04 |
| 1194152 | PAR radiance and irradiance | 2004-05-11 13:00:00 | 53.5317 N, 3.3623 W | RV Prince Madog PD18/04 |
| 1194164 | PAR radiance and irradiance | 2004-05-11 13:00:00 | 53.5317 N, 3.3623 W | RV Prince Madog PD18/04 |
| 1194139 | Transmittance/attenuance, turbidity, or SPM conc. | 2004-05-11 13:00:00 | 53.5317 N, 3.3623 W | RV Prince Madog PD18/04 |
| 1194140 | Water column chemistry | 2004-05-11 14:00:00 | 53.5317 N, 3.3623 W | RV Prince Madog PD18/04 |
| 1194176 | Water column chemistry | 2004-05-13 00:00:00 | 53.5317 N, 3.3623 W | RV Prince Madog PD18/04 |
| 1622779 | Currents -subsurface Eulerian | 2004-06-09 12:40:03 | 53.53467 N, 3.35933 W | RV Prince Madog PD22/04 |
| 664300 | Offshore sea floor pressure series | 2004-06-09 12:40:29 | 53.53467 N, 3.35933 W | RV Prince Madog PD22/04 |
| 664324 | Hydrography time series at depth | 2004-06-09 12:45:00 | 53.53467 N, 3.35933 W | RV Prince Madog PD22/04 |
| 664293 | Hydrography time series at depth | 2004-06-09 12:50:00 | 53.53467 N, 3.35933 W | RV Prince Madog PD22/04 |
| 1194207 | Fluorescence or pigments | 2004-06-09 13:00:00 | 53.5342 N, 3.3617 W | RV Prince Madog PD22/04 |
| 1194188 | Hydrography time series at depth | 2004-06-09 13:00:00 | 53.5342 N, 3.3617 W | RV Prince Madog PD22/04 |
| 1194232 | PAR radiance and irradiance | 2004-06-09 13:00:00 | 53.5342 N, 3.3617 W | RV Prince Madog PD22/04 |
| 1194244 | PAR radiance and irradiance | 2004-06-09 13:00:00 | 53.5342 N, 3.3617 W | RV Prince Madog PD22/04 |
| 1194219 | Transmittance/attenuance, turbidity, or SPM conc. | 2004-06-09 13:00:00 | 53.5342 N, 3.3617 W | RV Prince Madog PD22/04 |
| 664281 | Hydrography time series at depth | 2004-06-09 13:00:01 | 53.53417 N, 3.36167 W | RV Prince Madog PD22/04 |
| 664268 | Hydrography time series at depth | 2004-06-09 13:05:00 | 53.53417 N, 3.36167 W | RV Prince Madog PD22/04 |
| 1194220 | Water column chemistry | 2004-06-09 16:00:00 | 53.5342 N, 3.3617 W | RV Prince Madog PD22/04 |
| 1194256 | Water column chemistry | 2004-06-10 00:00:00 | 53.5342 N, 3.3617 W | RV Prince Madog PD22/04 |
| 1622835 | Currents -subsurface Eulerian | 2004-07-20 12:20:00 | 53.53483 N, 3.357 W | RV Prince Madog PD29/04 |
| 664336 | Hydrography time series at depth | 2004-07-20 12:25:00 | 53.53483 N, 3.357 W | RV Prince Madog PD29/04 |
| 664312 | Offshore sea floor pressure series | 2004-07-20 12:29:40 | 53.53483 N, 3.357 W | RV Prince Madog PD29/04 |
| 1194281 | Fluorescence or pigments | 2004-07-20 12:30:00 | 53.5333 N, 3.3592 W | RV Prince Madog PD29/04 |
| 1194268 | Hydrography time series at depth | 2004-07-20 12:30:00 | 53.5333 N, 3.3592 W | RV Prince Madog PD29/04 |
| 1194312 | PAR radiance and irradiance | 2004-07-20 12:30:00 | 53.5333 N, 3.3592 W | RV Prince Madog PD29/04 |
| 1194324 | PAR radiance and irradiance | 2004-07-20 12:30:00 | 53.5333 N, 3.3592 W | RV Prince Madog PD29/04 |
| 1194293 | Transmittance/attenuance, turbidity, or SPM conc. | 2004-07-20 12:30:00 | 53.5333 N, 3.3592 W | RV Prince Madog PD29/04 |
| 664256 | Hydrography time series at depth | 2004-07-20 12:30:01 | 53.53333 N, 3.35917 W | RV Prince Madog PD29/04 |
| 664244 | Hydrography time series at depth | 2004-07-20 12:35:00 | 53.53333 N, 3.35917 W | RV Prince Madog PD29/04 |
| 1194300 | Water column chemistry | 2004-07-20 16:00:00 | 53.5333 N, 3.3592 W | RV Prince Madog PD29/04 |
| 1194336 | Water column chemistry | 2004-07-22 00:00:00 | 53.5333 N, 3.3592 W | RV Prince Madog PD29/04 |
| 1622872 | Currents -subsurface Eulerian | 2004-08-11 12:40:00 | 53.53317 N, 3.36367 W | RV Prince Madog PD32/04 |
| 664232 | Hydrography time series at depth | 2004-08-11 12:40:01 | 53.53317 N, 3.36367 W | RV Prince Madog PD32/04 |
| 664348 | Hydrography time series at depth | 2004-08-11 12:45:00 | 53.53317 N, 3.36367 W | RV Prince Madog PD32/04 |
| 664220 | Hydrography time series at depth | 2004-08-11 12:50:01 | 53.53517 N, 3.36933 W | RV Prince Madog PD32/04 |
| 664219 | Hydrography time series at depth | 2004-08-11 12:55:00 | 53.53517 N, 3.36933 W | RV Prince Madog PD32/04 |
| 1194361 | Fluorescence or pigments | 2004-08-11 13:00:00 | 53.5352 N, 3.3693 W | RV Prince Madog PD32/04 |
| 1194348 | Hydrography time series at depth | 2004-08-11 13:00:00 | 53.5352 N, 3.3693 W | RV Prince Madog PD32/04 |
| 1194397 | PAR radiance and irradiance | 2004-08-11 13:00:00 | 53.5352 N, 3.3693 W | RV Prince Madog PD32/04 |
| 1194404 | PAR radiance and irradiance | 2004-08-11 13:00:00 | 53.5352 N, 3.3693 W | RV Prince Madog PD32/04 |
| 1194373 | Transmittance/attenuance, turbidity, or SPM conc. | 2004-08-11 13:00:00 | 53.5352 N, 3.3693 W | RV Prince Madog PD32/04 |
| 1194385 | Water column chemistry | 2004-08-11 16:00:00 | 53.5352 N, 3.3693 W | RV Prince Madog PD32/04 |
| 1194416 | Water column chemistry | 2004-08-12 00:00:00 | 53.5352 N, 3.3693 W | RV Prince Madog PD32/04 |
| 1622927 | Currents -subsurface Eulerian | 2004-09-08 12:20:01 | 53.533 N, 3.3645 W | RV Prince Madog PD38/04 |
| 695950 | Hydrography time series at depth | 2004-09-08 12:20:01 | 53.533 N, 3.3645 W | RV Prince Madog PD38/04 |
| 695974 | Hydrography time series at depth | 2004-09-08 12:20:03 | 53.533 N, 3.3645 W | RV Prince Madog PD38/04 |
| 695937 | Hydrography time series at depth | 2004-09-08 12:45:00 | 53.5355 N, 3.36717 W | RV Prince Madog PD38/04 |
| 695949 | Hydrography time series at depth | 2004-09-08 12:50:01 | 53.5355 N, 3.36717 W | RV Prince Madog PD38/04 |
| 1194441 | Fluorescence or pigments | 2004-09-08 13:00:00 | 53.5355 N, 3.3672 W | RV Prince Madog PD38/04 |
| 1194428 | Hydrography time series at depth | 2004-09-08 13:00:00 | 53.5355 N, 3.3672 W | RV Prince Madog PD38/04 |
| 1194477 | PAR radiance and irradiance | 2004-09-08 13:00:00 | 53.5355 N, 3.3672 W | RV Prince Madog PD38/04 |
| 1194489 | PAR radiance and irradiance | 2004-09-08 13:00:00 | 53.5355 N, 3.3672 W | RV Prince Madog PD38/04 |
| 1194453 | Transmittance/attenuance, turbidity, or SPM conc. | 2004-09-08 13:00:00 | 53.5355 N, 3.3672 W | RV Prince Madog PD38/04 |
| 1194465 | Water column chemistry | 2004-09-08 14:00:00 | 53.5355 N, 3.3672 W | RV Prince Madog PD38/04 |
| 1194490 | Water column chemistry | 2004-09-09 00:00:00 | 53.5355 N, 3.3672 W | RV Prince Madog PD38/04 |
| 1622976 | Currents -subsurface Eulerian | 2004-10-29 12:00:11 | 53.5325 N, 3.3665 W | RV Prince Madog PD48/04 |
| 1194521 | Fluorescence or pigments | 2004-10-29 12:30:00 | 53.5332 N, 3.3692 W | RV Prince Madog PD48/04 |
| 1194508 | Hydrography time series at depth | 2004-10-29 12:30:00 | 53.5332 N, 3.3692 W | RV Prince Madog PD48/04 |
| 1194557 | PAR radiance and irradiance | 2004-10-29 12:30:00 | 53.5332 N, 3.3692 W | RV Prince Madog PD48/04 |
| 1194569 | PAR radiance and irradiance | 2004-10-29 12:30:00 | 53.5332 N, 3.3692 W | RV Prince Madog PD48/04 |
| 1194533 | Transmittance/attenuance, turbidity, or SPM conc. | 2004-10-29 12:30:00 | 53.5332 N, 3.3692 W | RV Prince Madog PD48/04 |
| 1194545 | Water column chemistry | 2004-10-29 15:00:00 | 53.5332 N, 3.3692 W | RV Prince Madog PD48/04 |
| 1194570 | Water column chemistry | 2004-10-30 00:00:00 | 53.5332 N, 3.3692 W | RV Prince Madog PD48/04 |
| 1194594 | Fluorescence or pigments | 2004-12-15 14:00:00 | 53.5308 N, 3.3705 W | RV Prince Madog PD52/04 |
| 1194582 | Hydrography time series at depth | 2004-12-15 14:00:00 | 53.5308 N, 3.3705 W | RV Prince Madog PD52/04 |
| 1194625 | PAR radiance and irradiance | 2004-12-15 14:00:00 | 53.5308 N, 3.3705 W | RV Prince Madog PD52/04 |
| 1194637 | PAR radiance and irradiance | 2004-12-15 14:00:00 | 53.5308 N, 3.3705 W | RV Prince Madog PD52/04 |
| 1194601 | Transmittance/attenuance, turbidity, or SPM conc. | 2004-12-15 14:00:00 | 53.5308 N, 3.3705 W | RV Prince Madog PD52/04 |
| 1194613 | Water column chemistry | 2004-12-15 15:00:00 | 53.5308 N, 3.3705 W | RV Prince Madog PD52/04 |
| 1623003 | Currents -subsurface Eulerian | 2004-12-15 15:40:00 | 53.53183 N, 3.37783 W | RV Prince Madog PD52/04 |
| 1194649 | Water column chemistry | 2004-12-17 00:00:00 | 53.5308 N, 3.3705 W | RV Prince Madog PD52/04 |
| 701650 | Hydrography time series at depth | 2005-02-01 10:46:00 | 53.53433 N, 3.3635 W | RV Prince Madog PD02/05 |
| 701662 | Hydrography time series at depth | 2005-02-01 10:50:01 | 53.53433 N, 3.3635 W | RV Prince Madog PD02/05 |
| 1194662 | Fluorescence or pigments | 2005-02-01 11:00:00 | 53.5343 N, 3.3635 W | RV Prince Madog PD02/05 |
| 1194650 | Hydrography time series at depth | 2005-02-01 11:00:00 | 53.5343 N, 3.3635 W | RV Prince Madog PD02/05 |
| 1194698 | PAR radiance and irradiance | 2005-02-01 11:00:00 | 53.5343 N, 3.3635 W | RV Prince Madog PD02/05 |
| 1194705 | PAR radiance and irradiance | 2005-02-01 11:00:00 | 53.5343 N, 3.3635 W | RV Prince Madog PD02/05 |
| 1194674 | Transmittance/attenuance, turbidity, or SPM conc. | 2005-02-01 11:00:00 | 53.5343 N, 3.3635 W | RV Prince Madog PD02/05 |
| 1194686 | Water column chemistry | 2005-02-01 14:00:00 | 53.5343 N, 3.3635 W | RV Prince Madog PD02/05 |
| 1194717 | Water column chemistry | 2005-02-03 00:00:00 | 53.5343 N, 3.3635 W | RV Prince Madog PD02/05 |
| 1622699 | Currents -subsurface Eulerian | 2005-04-05 14:10:00 | 53.53383 N, 3.3595 W | RV Prince Madog PD11/05 |
| 701926 | Hydrography time series at depth | 2005-04-05 14:10:03 | 53.53383 N, 3.3595 W | RV Prince Madog PD11/05 |
| 701846 | Hydrography time series at depth | 2005-04-10 12:20:01 | 53.53317 N, 3.36383 W | RV Prince Madog PD11/05 |
| 701674 | Hydrography time series at depth | 2005-04-10 12:29:00 | 53.53317 N, 3.36383 W | RV Prince Madog PD12/05 |
| 1194730 | Fluorescence or pigments | 2005-04-10 12:30:00 | 53.5332 N, 3.3638 W | RV Prince Madog PD11/05 |
| 1194729 | Hydrography time series at depth | 2005-04-10 12:30:00 | 53.5332 N, 3.3638 W | RV Prince Madog PD11/05 |
| 1194766 | PAR radiance and irradiance | 2005-04-10 12:30:00 | 53.5332 N, 3.3638 W | RV Prince Madog PD11/05 |
| 1194778 | PAR radiance and irradiance | 2005-04-10 12:30:00 | 53.5332 N, 3.3638 W | RV Prince Madog PD11/05 |
| 1194742 | Transmittance/attenuance, turbidity, or SPM conc. | 2005-04-10 12:30:00 | 53.5332 N, 3.3638 W | RV Prince Madog PD11/05 |
| 1194754 | Water column chemistry | 2005-04-10 14:00:00 | 53.5332 N, 3.3638 W | RV Prince Madog PD11/05 |
| 1194791 | Water column chemistry | 2005-04-22 00:00:00 | 53.5332 N, 3.3638 W | RV Prince Madog PD11/05 |
| 1622743 | Currents -subsurface Eulerian | 2005-05-11 12:50:00 | 53.53383 N, 3.35917 W | RV Prince Madog PD18/05 |
| 701895 | Hydrography time series at depth | 2005-05-11 12:50:03 | 53.53383 N, 3.35917 W | RV Prince Madog PD18/05 |
| 701754 | Hydrography time series at depth | 2005-05-11 13:25:00 | 53.53317 N, 3.36383 W | RV Prince Madog PD18/05 |
| 1194822 | Fluorescence or pigments | 2005-05-11 13:30:00 | 53.5332 N, 3.3638 W | RV Prince Madog PD18/05 |
| 701705 | Hydrography time series at depth | 2005-05-11 13:30:00 | 53.53317 N, 3.36383 W | RV Prince Madog PD18/05 |
| 1194809 | Hydrography time series at depth | 2005-05-11 13:30:00 | 53.5332 N, 3.3638 W | RV Prince Madog PD18/05 |
| 1194858 | PAR radiance and irradiance | 2005-05-11 13:30:00 | 53.5332 N, 3.3638 W | RV Prince Madog PD18/05 |
| 1194871 | PAR radiance and irradiance | 2005-05-11 13:30:00 | 53.5332 N, 3.3638 W | RV Prince Madog PD18/05 |
| 1194834 | Transmittance/attenuance, turbidity, or SPM conc. | 2005-05-11 13:30:00 | 53.5332 N, 3.3638 W | RV Prince Madog PD18/05 |
| 1194846 | Water column chemistry | 2005-05-11 16:00:00 | 53.5332 N, 3.3638 W | RV Prince Madog PD18/05 |
| 1194883 | Water column chemistry | 2005-05-12 00:00:00 | 53.5332 N, 3.3638 W | RV Prince Madog PD18/05 |
| 1622767 | Currents -subsurface Eulerian | 2005-06-15 13:10:00 | 53.53367 N, 3.35717 W | RV Prince Madog PD21/05 |
| 701902 | Hydrography time series at depth | 2005-06-15 13:10:03 | 53.53367 N, 3.35717 W | RV Prince Madog PD21/05 |
| 701742 | Hydrography time series at depth | 2005-06-15 13:50:01 | 53.53417 N, 3.36067 W | RV Prince Madog PD21/05 |
| 701730 | Hydrography time series at depth | 2005-06-15 13:55:00 | 53.53417 N, 3.36067 W | RV Prince Madog PD21/05 |
| 1194902 | Fluorescence or pigments | 2005-06-15 14:00:00 | 53.5342 N, 3.3607 W | RV Prince Madog PD21/05 |
| 1194895 | Hydrography time series at depth | 2005-06-15 14:00:00 | 53.5342 N, 3.3607 W | RV Prince Madog PD21/05 |
| 1194938 | PAR radiance and irradiance | 2005-06-15 14:00:00 | 53.5342 N, 3.3607 W | RV Prince Madog PD21/05 |
| 1194951 | PAR radiance and irradiance | 2005-06-15 14:00:00 | 53.5342 N, 3.3607 W | RV Prince Madog PD21/05 |
| 1194914 | Transmittance/attenuance, turbidity, or SPM conc. | 2005-06-15 14:00:00 | 53.5342 N, 3.3607 W | RV Prince Madog PD21/05 |
| 1194926 | Water column chemistry | 2005-06-15 16:00:00 | 53.5342 N, 3.3607 W | RV Prince Madog PD21/05 |
| 1622811 | Currents -subsurface Eulerian | 2005-07-13 11:00:00 | 53.5335 N, 3.35717 W | RV Prince Madog PD25/05 |
| 698787 | Hydrography time series at depth | 2005-07-13 11:00:03 | 53.5335 N, 3.35717 W | RV Prince Madog PD25/05 |
| 698892 | Hydrography time series at depth | 2005-07-13 12:15:00 | 53.53467 N, 3.36533 W | RV Prince Madog PD25/05 |
| 698879 | Hydrography time series at depth | 2005-07-13 12:20:03 | 53.53467 N, 3.36533 W | RV Prince Madog PD25/05 |
| 1194975 | Fluorescence or pigments | 2005-07-13 12:30:00 | 53.5347 N, 3.3653 W | RV Prince Madog PD25/05 |
| 1194963 | Hydrography time series at depth | 2005-07-13 12:30:00 | 53.5347 N, 3.3653 W | RV Prince Madog PD25/05 |
| 1195002 | PAR radiance and irradiance | 2005-07-13 12:30:00 | 53.5347 N, 3.3653 W | RV Prince Madog PD25/05 |
| 1195014 | PAR radiance and irradiance | 2005-07-13 12:30:00 | 53.5347 N, 3.3653 W | RV Prince Madog PD25/05 |
| 1194987 | Transmittance/attenuance, turbidity, or SPM conc. | 2005-07-13 12:30:00 | 53.5347 N, 3.3653 W | RV Prince Madog PD25/05 |
| 1194999 | Water column chemistry | 2005-07-13 15:00:00 | 53.5347 N, 3.3653 W | RV Prince Madog PD25/05 |
| 1195026 | Water column chemistry | 2005-07-14 00:00:00 | 53.5347 N, 3.3653 W | RV Prince Madog PD25/05 |
| 1622847 | Currents -subsurface Eulerian | 2005-08-17 12:40:00 | 53.53367 N, 3.35733 W | RV Prince Madog PD30/05 |
| 698799 | Hydrography time series at depth | 2005-08-17 12:40:03 | 53.53367 N, 3.35733 W | RV Prince Madog PD30/05 |
| 1195051 | Fluorescence or pigments | 2005-08-17 13:00:00 | 53.5337 N, 3.3615 W | RV Prince Madog PD30/05 |
| 1195038 | Hydrography time series at depth | 2005-08-17 13:00:00 | 53.5337 N, 3.3615 W | RV Prince Madog PD30/05 |
| 1195087 | PAR radiance and irradiance | 2005-08-17 13:00:00 | 53.5337 N, 3.3615 W | RV Prince Madog PD30/05 |
| 1195099 | PAR radiance and irradiance | 2005-08-17 13:00:00 | 53.5337 N, 3.3615 W | RV Prince Madog PD30/05 |
| 1195063 | Transmittance/attenuance, turbidity, or SPM conc. | 2005-08-17 13:00:00 | 53.5337 N, 3.3615 W | RV Prince Madog PD30/05 |
| 698972 | Hydrography time series at depth | 2005-08-17 13:00:01 | 53.53367 N, 3.3615 W | RV Prince Madog PD30/05 |
| 1195075 | Water column chemistry | 2005-08-17 14:00:00 | 53.5337 N, 3.3615 W | RV Prince Madog PD30/05 |
| 1195106 | Water column chemistry | 2005-08-18 00:00:00 | 53.5337 N, 3.3615 W | RV Prince Madog PD30/05 |
| 698843 | Hydrography time series at depth | 2005-09-15 12:40:03 | 53.53333 N, 3.366 W | RV Prince Madog PD34/05 |
| 680084 | Fluorescence or pigments | 2005-09-15 13:00:00 | 53.5333 N, 3.366 W | RV Prince Madog PD34/05 |
| 680115 | PAR radiance and irradiance | 2005-09-15 13:00:00 | 53.5333 N, 3.366 W | RV Prince Madog PD34/05 |
| 680140 | PAR radiance and irradiance | 2005-09-15 13:00:00 | 53.5333 N, 3.366 W | RV Prince Madog PD34/05 |
| 680059 | Surface temp/sal | 2005-09-15 13:00:00 | 53.5333 N, 3.366 W | RV Prince Madog PD34/05 |
| 680023 | Transmittance/attenuance, turbidity, or SPM conc. | 2005-09-15 13:00:00 | 53.5333 N, 3.366 W | RV Prince Madog PD34/05 |
| 698831 | Hydrography time series at depth | 2005-09-15 14:50:03 | 53.53383 N, 3.359 W | RV Prince Madog PD34/05 |
| 1622896 | Currents -subsurface Eulerian | 2005-09-15 14:50:27 | 53.53383 N, 3.359 W | RV Prince Madog PD34/05 |
| 680219 | Water column chemistry | 2005-09-16 00:00:00 | 53.5333 N, 3.366 W | RV Prince Madog PD34/05 |
| 680176 | Water column chemistry | 2005-09-16 00:07:00 | 53.5333 N, 3.366 W | RV Prince Madog PD34/05 |
| 1622939 | Currents -subsurface Eulerian | 2005-10-26 13:50:00 | 53.53367 N, 3.35733 W | RV Prince Madog PD41/05 |
| 696326 | Hydrography time series at depth | 2005-10-26 13:50:03 | 53.53367 N, 3.35733 W | RV Prince Madog PD41/05 |
| 696271 | Hydrography time series at depth | 2005-10-26 14:20:01 | 53.53333 N, 3.362 W | RV Prince Madog PD41/05 |
| 680096 | Fluorescence or pigments | 2005-10-26 14:30:00 | 53.5333 N, 3.362 W | RV Prince Madog PD41/05 |
| 680127 | PAR radiance and irradiance | 2005-10-26 14:30:00 | 53.5333 N, 3.362 W | RV Prince Madog PD41/05 |
| 680152 | PAR radiance and irradiance | 2005-10-26 14:30:00 | 53.5333 N, 3.362 W | RV Prince Madog PD41/05 |
| 680060 | Surface temp/sal | 2005-10-26 14:30:00 | 53.5333 N, 3.362 W | RV Prince Madog PD41/05 |
| 680035 | Transmittance/attenuance, turbidity, or SPM conc. | 2005-10-26 14:30:00 | 53.5333 N, 3.362 W | RV Prince Madog PD41/05 |
| 680244 | Water column chemistry | 2005-10-26 14:30:00 | 53.5333 N, 3.362 W | RV Prince Madog PD41/05 |
| 680188 | Water column chemistry | 2005-10-26 17:08:00 | 53.5333 N, 3.362 W | RV Prince Madog PD41/05 |
| 680220 | Water column chemistry | 2005-10-27 00:00:00 | 53.5333 N, 3.362 W | RV Prince Madog PD41/05 |
| 696338 | Hydrography time series at depth | 2005-12-14 13:00:03 | 53.53417 N, 3.35917 W | RV Prince Madog PD48/05 |
| 696283 | Hydrography time series at depth | 2005-12-14 13:20:00 | 53.53467 N, 3.36033 W | RV Prince Madog PD48/05 |
| 680103 | Fluorescence or pigments | 2005-12-14 13:30:00 | 53.5346 N, 3.3602 W | RV Prince Madog PD48/05 |
| 680139 | PAR radiance and irradiance | 2005-12-14 13:30:00 | 53.5346 N, 3.3602 W | RV Prince Madog PD48/05 |
| 680164 | PAR radiance and irradiance | 2005-12-14 13:30:00 | 53.5346 N, 3.3602 W | RV Prince Madog PD48/05 |
| 680072 | Surface temp/sal | 2005-12-14 13:30:00 | 53.5346 N, 3.3602 W | RV Prince Madog PD48/05 |
| 680047 | Transmittance/attenuance, turbidity, or SPM conc. | 2005-12-14 13:30:00 | 53.5346 N, 3.3602 W | RV Prince Madog PD48/05 |
| 680256 | Water column chemistry | 2005-12-14 13:30:00 | 53.5346 N, 3.3602 W | RV Prince Madog PD48/05 |
| 680207 | Water column chemistry | 2005-12-14 15:04:00 | 53.5346 N, 3.3602 W | RV Prince Madog PD48/05 |
| 680232 | Water column chemistry | 2005-12-15 00:00:00 | 53.5346 N, 3.3602 W | RV Prince Madog PD48/05 |
| 696375 | Hydrography time series at depth | 2006-03-08 07:20:03 | 53.53283 N, 3.36 W | RV Prince Madog PD09/06 |
| 696295 | Hydrography time series at depth | 2006-03-08 07:40:01 | 53.536 N, 3.364 W | RV Prince Madog PD09/06 |
| 696302 | Hydrography time series at depth | 2006-03-08 07:40:01 | 53.536 N, 3.364 W | RV Prince Madog PD09/06 |
| 700413 | Fluorescence or pigments | 2006-03-08 08:00:00 | 53.5359 N, 3.3641 W | RV Prince Madog PD09/06 |
| 700554 | PAR radiance and irradiance | 2006-03-08 08:00:00 | 53.5359 N, 3.3641 W | RV Prince Madog PD09/06 |
| 700591 | PAR radiance and irradiance | 2006-03-08 08:00:00 | 53.5359 N, 3.3641 W | RV Prince Madog PD09/06 |
| 700345 | Surface temp/sal | 2006-03-08 08:00:00 | 53.5359 N, 3.3641 W | RV Prince Madog PD09/06 |
| 700462 | Transmittance/attenuance, turbidity, or SPM conc. | 2006-03-08 08:00:00 | 53.5359 N, 3.3641 W | RV Prince Madog PD09/06 |
| 700529 | Water column chemistry | 2006-03-08 08:00:00 | 53.5359 N, 3.3641 W | RV Prince Madog PD09/06 |
| 700498 | Water column chemistry | 2006-03-08 21:08:00 | 53.5359 N, 3.3641 W | RV Prince Madog PD09/06 |
| 700622 | Water column chemistry | 2006-03-09 00:00:00 | 53.5359 N, 3.3641 W | RV Prince Madog PD09/06 |
| 700401 | Fluorescence or pigments | 2006-05-09 12:00:00 | 53.5345 N, 3.3505 W | RV Prince Madog PD16/06 |
| 700578 | PAR radiance and irradiance | 2006-05-09 12:00:00 | 53.5345 N, 3.3505 W | RV Prince Madog PD16/06 |
| 700610 | PAR radiance and irradiance | 2006-05-09 12:00:00 | 53.5345 N, 3.3505 W | RV Prince Madog PD16/06 |
| 700357 | Surface temp/sal | 2006-05-09 12:00:00 | 53.5345 N, 3.3505 W | RV Prince Madog PD16/06 |
| 700474 | Transmittance/attenuance, turbidity, or SPM conc. | 2006-05-09 12:00:00 | 53.5345 N, 3.3505 W | RV Prince Madog PD16/06 |
| 700530 | Water column chemistry | 2006-05-09 12:00:00 | 53.5345 N, 3.3505 W | RV Prince Madog PD16/06 |
| 700505 | Water column chemistry | 2006-05-09 13:08:00 | 53.5345 N, 3.3505 W | RV Prince Madog PD16/06 |
| 700646 | Water column chemistry | 2006-05-10 00:00:00 | 53.5345 N, 3.3505 W | RV Prince Madog PD16/06 |
| 700425 | Fluorescence or pigments | 2006-06-23 10:00:00 | 53.5338 N, 3.3587 W | RV Prince Madog PD20/06 |
| 700566 | PAR radiance and irradiance | 2006-06-23 10:00:00 | 53.5338 N, 3.3587 W | RV Prince Madog PD20/06 |
| 700609 | PAR radiance and irradiance | 2006-06-23 10:00:00 | 53.5338 N, 3.3587 W | RV Prince Madog PD20/06 |
| 700369 | Surface temp/sal | 2006-06-23 10:00:00 | 53.5338 N, 3.3587 W | RV Prince Madog PD20/06 |
| 700486 | Transmittance/attenuance, turbidity, or SPM conc. | 2006-06-23 10:00:00 | 53.5338 N, 3.3587 W | RV Prince Madog PD20/06 |
| 700542 | Water column chemistry | 2006-06-23 10:00:00 | 53.5338 N, 3.3587 W | RV Prince Madog PD20/06 |
| 700517 | Water column chemistry | 2006-06-23 11:08:00 | 53.5338 N, 3.3587 W | RV Prince Madog PD20/06 |
| 700634 | Water column chemistry | 2006-06-26 00:00:00 | 53.5338 N, 3.3587 W | RV Prince Madog PD20/06 |
| 747149 | Fluorescence or pigments | 2006-07-26 13:00:00 | 53.5333 N, 3.3602 W | RV Prince Madog PD22/06 |
| 747346 | PAR radiance and irradiance | 2006-07-26 13:00:00 | 53.5333 N, 3.3602 W | RV Prince Madog PD22/06 |
| 747402 | PAR radiance and irradiance | 2006-07-26 13:00:00 | 53.5333 N, 3.3602 W | RV Prince Madog PD22/06 |
| 747008 | Surface temp/sal | 2006-07-26 13:00:00 | 53.5333 N, 3.3602 W | RV Prince Madog PD22/06 |
| 747230 | Transmittance/attenuance, turbidity, or SPM conc. | 2006-07-26 13:00:00 | 53.5333 N, 3.3602 W | RV Prince Madog PD22/06 |
| 747291 | Water column chemistry | 2006-07-26 13:00:00 | 53.5333 N, 3.3602 W | RV Prince Madog PD22/06 |
| 747518 | Water column chemistry | 2006-07-26 14:08:00 | 53.5333 N, 3.3602 W | RV Prince Madog PD22/06 |
| 747531 | Water column chemistry | 2006-07-27 00:00:00 | 53.5333 N, 3.3602 W | RV Prince Madog PD22/06 |
| 747125 | Fluorescence or pigments | 2006-08-15 13:00:00 | 53.5332 N, 3.3633 W | RV Prince Madog PD25/06 |
| 747358 | PAR radiance and irradiance | 2006-08-15 13:00:00 | 53.5332 N, 3.3633 W | RV Prince Madog PD25/06 |
| 747414 | PAR radiance and irradiance | 2006-08-15 13:00:00 | 53.5332 N, 3.3633 W | RV Prince Madog PD25/06 |
| 747021 | Surface temp/sal | 2006-08-15 13:00:00 | 53.5332 N, 3.3633 W | RV Prince Madog PD25/06 |
| 747242 | Transmittance/attenuance, turbidity, or SPM conc. | 2006-08-15 13:00:00 | 53.5332 N, 3.3633 W | RV Prince Madog PD25/06 |
| 747309 | Water column chemistry | 2006-08-15 13:00:00 | 53.5332 N, 3.3633 W | RV Prince Madog PD25/06 |
| 747543 | Water column chemistry | 2006-08-16 00:00:00 | 53.5332 N, 3.3633 W | RV Prince Madog PD25/06 |
| 747463 | Water column chemistry | 2006-08-22 17:38:00 | 53.5332 N, 3.3633 W | RV Prince Madog PD25/06 |
| 747150 | Fluorescence or pigments | 2006-09-21 12:30:00 | 53.534 N, 3.3599 W | RV Prince Madog PD29/06 |
| 747371 | PAR radiance and irradiance | 2006-09-21 12:30:00 | 53.534 N, 3.3599 W | RV Prince Madog PD29/06 |
| 747426 | PAR radiance and irradiance | 2006-09-21 12:30:00 | 53.534 N, 3.3599 W | RV Prince Madog PD29/06 |
| 747033 | Surface temp/sal | 2006-09-21 12:30:00 | 53.534 N, 3.3599 W | RV Prince Madog PD29/06 |
| 747254 | Transmittance/attenuance, turbidity, or SPM conc. | 2006-09-21 12:30:00 | 53.534 N, 3.3599 W | RV Prince Madog PD29/06 |
| 747310 | Water column chemistry | 2006-09-21 12:30:00 | 53.534 N, 3.3599 W | RV Prince Madog PD29/06 |
| 747555 | Water column chemistry | 2006-09-22 00:00:00 | 53.534 N, 3.3599 W | RV Prince Madog PD29/06 |
| 747475 | Water column chemistry | 2006-09-23 07:08:00 | 53.534 N, 3.3599 W | RV Prince Madog PD29/06 |
| 1012858 | CTD or STD cast | 2006-11-01 12:33:00 | 53.5315 N, 3.367 W | RV Prince Madog PD35/06 |
| 753099 | Hydrography time series at depth | 2006-11-01 14:40:03 | 53.534 N, 3.35783 W | RV Prince Madog PD35/06 |
| 752926 | Hydrography time series at depth | 2006-11-02 08:20:01 | 53.53367 N, 3.36317 W | RV Prince Madog PD35/06 |
| 752938 | Hydrography time series at depth | 2006-11-02 08:20:01 | 53.53367 N, 3.36317 W | RV Prince Madog PD35/06 |
| 747137 | Fluorescence or pigments | 2006-11-02 08:30:00 | 53.5337 N, 3.3632 W | RV Prince Madog PD35/06 |
| 747383 | PAR radiance and irradiance | 2006-11-02 08:30:00 | 53.5337 N, 3.3632 W | RV Prince Madog PD35/06 |
| 747438 | PAR radiance and irradiance | 2006-11-02 08:30:00 | 53.5337 N, 3.3632 W | RV Prince Madog PD35/06 |
| 747045 | Surface temp/sal | 2006-11-02 08:30:00 | 53.5337 N, 3.3632 W | RV Prince Madog PD35/06 |
| 747278 | Transmittance/attenuance, turbidity, or SPM conc. | 2006-11-02 08:30:00 | 53.5337 N, 3.3632 W | RV Prince Madog PD35/06 |
| 747322 | Water column chemistry | 2006-11-02 08:30:00 | 53.5337 N, 3.3632 W | RV Prince Madog PD35/06 |
| 1013143 | CTD or STD cast | 2006-11-02 08:39:00 | 53.53317 N, 3.36183 W | RV Prince Madog PD35/06 |
| 747487 | Water column chemistry | 2006-11-02 09:08:00 | 53.5337 N, 3.3632 W | RV Prince Madog PD35/06 |
| 747567 | Water column chemistry | 2006-11-04 00:00:00 | 53.5337 N, 3.3632 W | RV Prince Madog PD35/06 |
| 1003634 | CTD or STD cast | 2006-12-15 08:04:00 | 53.533 N, 3.36567 W | RV Prince Madog PD37/06 |
| 753118 | Hydrography time series at depth | 2006-12-15 09:10:03 | 53.534 N, 3.35783 W | RV Prince Madog PD37/06 |
| 752951 | Hydrography time series at depth | 2006-12-15 09:50:01 | 53.53317 N, 3.36067 W | RV Prince Madog PD37/06 |
| 753026 | Hydrography time series at depth | 2006-12-15 09:50:01 | 53.53317 N, 3.36067 W | RV Prince Madog PD37/06 |
| 747162 | Fluorescence or pigments | 2006-12-15 10:00:00 | 53.5332 N, 3.3607 W | RV Prince Madog PD37/06 |
| 747395 | PAR radiance and irradiance | 2006-12-15 10:00:00 | 53.5332 N, 3.3607 W | RV Prince Madog PD37/06 |
| 747451 | PAR radiance and irradiance | 2006-12-15 10:00:00 | 53.5332 N, 3.3607 W | RV Prince Madog PD37/06 |
| 747057 | Surface temp/sal | 2006-12-15 10:00:00 | 53.5332 N, 3.3607 W | RV Prince Madog PD37/06 |
| 747266 | Transmittance/attenuance, turbidity, or SPM conc. | 2006-12-15 10:00:00 | 53.5332 N, 3.3607 W | RV Prince Madog PD37/06 |
| 747334 | Water column chemistry | 2006-12-15 10:00:00 | 53.5332 N, 3.3607 W | RV Prince Madog PD37/06 |
| 747499 | Water column chemistry | 2006-12-15 10:08:00 | 53.5332 N, 3.3607 W | RV Prince Madog PD37/06 |
| 1003646 | CTD or STD cast | 2006-12-15 10:14:00 | 53.53367 N, 3.36617 W | RV Prince Madog PD37/06 |
| 747506 | Water column chemistry | 2006-12-22 00:02:00 | 53.5332 N, 3.3607 W | RV Prince Madog PD37/06 |
| 979037 | CTD or STD cast | 2007-02-14 11:31:00 | 53.534 N, 3.36417 W | RV Prince Madog PD02/07 |
| 1623040 | Currents -subsurface Eulerian | 2007-02-14 12:50:00 | 53.53417 N, 3.3585 W | RV Prince Madog PD02/07 |
| 753143 | Hydrography time series at depth | 2007-02-14 12:50:03 | 53.53417 N, 3.3585 W | RV Prince Madog PD02/07 |
| 752963 | Hydrography time series at depth | 2007-02-14 13:20:01 | 53.53317 N, 3.36267 W | RV Prince Madog PD02/07 |
| 752975 | Hydrography time series at depth | 2007-02-14 13:20:01 | 53.53317 N, 3.36267 W | RV Prince Madog PD02/07 |
| 862196 | Fluorescence or pigments | 2007-02-14 13:30:00 | 53.5331 N, 3.36265 W | RV Prince Madog PD02/07 |
| 862621 | PAR radiance and irradiance | 2007-02-14 13:30:00 | 53.5331 N, 3.36265 W | RV Prince Madog PD02/07 |
| 862725 | PAR radiance and irradiance | 2007-02-14 13:30:00 | 53.5331 N, 3.36265 W | RV Prince Madog PD02/07 |
| 861980 | Surface temp/sal | 2007-02-14 13:30:00 | 53.5331 N, 3.36265 W | RV Prince Madog PD02/07 |
| 862400 | Transmittance/attenuance, turbidity, or SPM conc. | 2007-02-14 13:30:00 | 53.5331 N, 3.36265 W | RV Prince Madog PD02/07 |
| 862829 | Water column chemistry | 2007-02-14 13:30:00 | 53.5331 N, 3.36265 W | RV Prince Madog PD02/07 |
| 1082291 | Water column chemistry | 2007-02-14 14:00:00 | 53.5331 N, 3.36265 W | RV Prince Madog PD02/07 |
| 979050 | CTD or STD cast | 2007-02-14 19:54:00 | 53.533 N, 3.3615 W | RV Prince Madog PD02/07 |
| 1082543 | Water column chemistry | 2007-02-15 00:00:00 | 53.5331 N, 3.36265 W | RV Prince Madog PD02/07 |
| 979222 | CTD or STD cast | 2007-02-15 09:58:00 | 53.53117 N, 3.35983 W | RV Prince Madog PD02/07 |
| 752999 | Hydrography time series at depth | 2007-04-16 13:40:01 | 53.53483 N, 3.361 W | RV Prince Madog PD06/07 |
| 753038 | Hydrography time series at depth | 2007-04-16 13:40:01 | 53.53483 N, 3.361 W | RV Prince Madog PD06/07 |
| 753432 | Hydrography time series at depth | 2007-04-16 13:50:00 | 53.53483 N, 3.361 W | RV Prince Madog PD06/07 |
| 753444 | Hydrography time series at depth | 2007-04-16 13:50:00 | 53.53483 N, 3.361 W | RV Prince Madog PD06/07 |
| 862203 | Fluorescence or pigments | 2007-04-16 14:00:00 | 53.5349 N, 3.36098 W | RV Prince Madog PD06/07 |
| 862633 | PAR radiance and irradiance | 2007-04-16 14:00:00 | 53.5349 N, 3.36098 W | RV Prince Madog PD06/07 |
| 862737 | PAR radiance and irradiance | 2007-04-16 14:00:00 | 53.5349 N, 3.36098 W | RV Prince Madog PD06/07 |
| 861992 | Surface temp/sal | 2007-04-16 14:00:00 | 53.5349 N, 3.36098 W | RV Prince Madog PD06/07 |
| 862412 | Transmittance/attenuance, turbidity, or SPM conc. | 2007-04-16 14:00:00 | 53.5349 N, 3.36098 W | RV Prince Madog PD06/07 |
| 862830 | Water column chemistry | 2007-04-16 14:00:00 | 53.5349 N, 3.36098 W | RV Prince Madog PD06/07 |
| 1082309 | Water column chemistry | 2007-04-16 14:00:00 | 53.5349 N, 3.36098 W | RV Prince Madog PD06/07 |
| 753167 | Hydrography time series at depth | 2007-04-16 14:40:03 | 53.5345 N, 3.35967 W | RV Prince Madog PD06/07 |
| 937502 | CTD or STD cast | 2007-04-16 14:47:00 | 53.5325 N, 3.3645 W | RV Prince Madog PD06/07 |
| 1082451 | Water column chemistry | 2007-04-17 00:00:00 | 53.5349 N, 3.36098 W | RV Prince Madog PD06/07 |
| 937680 | CTD or STD cast | 2007-04-19 20:57:00 | 53.532 N, 3.36533 W | RV Prince Madog PD06/07 |
| 941482 | CTD or STD cast | 2007-05-15 10:37:00 | 53.53267 N, 3.36217 W | RV Prince Madog PD09/07 |
| 753180 | Hydrography time series at depth | 2007-05-15 11:40:03 | 53.53417 N, 3.359 W | RV Prince Madog PD09/07 |
| 862215 | Fluorescence or pigments | 2007-05-15 12:00:00 | 53.53497 N, 3.36743 W | RV Prince Madog PD09/07 |
| 753002 | Hydrography time series at depth | 2007-05-15 12:00:00 | 53.535 N, 3.3675 W | RV Prince Madog PD09/07 |
| 753075 | Hydrography time series at depth | 2007-05-15 12:00:00 | 53.535 N, 3.3675 W | RV Prince Madog PD09/07 |
| 753456 | Hydrography time series at depth | 2007-05-15 12:00:00 | 53.535 N, 3.3675 W | RV Prince Madog PD09/07 |
| 753468 | Hydrography time series at depth | 2007-05-15 12:00:00 | 53.535 N, 3.3675 W | RV Prince Madog PD09/07 |
| 862645 | PAR radiance and irradiance | 2007-05-15 12:00:00 | 53.53497 N, 3.36743 W | RV Prince Madog PD09/07 |
| 862749 | PAR radiance and irradiance | 2007-05-15 12:00:00 | 53.53497 N, 3.36743 W | RV Prince Madog PD09/07 |
| 862006 | Surface temp/sal | 2007-05-15 12:00:00 | 53.53497 N, 3.36743 W | RV Prince Madog PD09/07 |
| 862424 | Transmittance/attenuance, turbidity, or SPM conc. | 2007-05-15 12:00:00 | 53.53497 N, 3.36743 W | RV Prince Madog PD09/07 |
| 862842 | Water column chemistry | 2007-05-15 12:00:00 | 53.53497 N, 3.36743 W | RV Prince Madog PD09/07 |
| 941494 | CTD or STD cast | 2007-05-15 15:00:00 | 53.5375 N, 3.347 W | RV Prince Madog PD09/07 |
| 941501 | CTD or STD cast | 2007-05-15 15:30:00 | 53.53733 N, 3.347 W | RV Prince Madog PD09/07 |
| 941513 | CTD or STD cast | 2007-05-15 16:00:00 | 53.53717 N, 3.347 W | RV Prince Madog PD09/07 |
| 941525 | CTD or STD cast | 2007-05-15 16:30:00 | 53.53667 N, 3.34583 W | RV Prince Madog PD09/07 |
| 941537 | CTD or STD cast | 2007-05-15 17:01:00 | 53.5365 N, 3.34567 W | RV Prince Madog PD09/07 |
| 941549 | CTD or STD cast | 2007-05-15 17:31:00 | 53.53667 N, 3.34533 W | RV Prince Madog PD09/07 |
| 941550 | CTD or STD cast | 2007-05-15 18:00:00 | 53.53683 N, 3.345 W | RV Prince Madog PD09/07 |
| 941562 | CTD or STD cast | 2007-05-15 18:32:00 | 53.53683 N, 3.34433 W | RV Prince Madog PD09/07 |
| 941574 | CTD or STD cast | 2007-05-15 19:03:00 | 53.53667 N, 3.344 W | RV Prince Madog PD09/07 |
| 941586 | CTD or STD cast | 2007-05-15 19:34:00 | 53.53667 N, 3.34417 W | RV Prince Madog PD09/07 |
| 941598 | CTD or STD cast | 2007-05-15 20:03:00 | 53.53667 N, 3.34417 W | RV Prince Madog PD09/07 |
| 941605 | CTD or STD cast | 2007-05-15 20:30:00 | 53.53667 N, 3.34417 W | RV Prince Madog PD09/07 |
| 941617 | CTD or STD cast | 2007-05-15 21:03:00 | 53.53667 N, 3.34417 W | RV Prince Madog PD09/07 |
| 941629 | CTD or STD cast | 2007-05-15 21:33:00 | 53.53667 N, 3.34417 W | RV Prince Madog PD09/07 |
| 941630 | CTD or STD cast | 2007-05-15 22:03:00 | 53.5365 N, 3.34433 W | RV Prince Madog PD09/07 |
| 941642 | CTD or STD cast | 2007-05-15 22:32:00 | 53.5365 N, 3.34433 W | RV Prince Madog PD09/07 |
| 941654 | CTD or STD cast | 2007-05-15 23:00:00 | 53.53633 N, 3.345 W | RV Prince Madog PD09/07 |
| 941666 | CTD or STD cast | 2007-05-15 23:30:00 | 53.53717 N, 3.3465 W | RV Prince Madog PD09/07 |
| 1082463 | Water column chemistry | 2007-05-16 00:00:00 | 53.53497 N, 3.36743 W | RV Prince Madog PD09/07 |
| 941678 | CTD or STD cast | 2007-05-16 00:01:00 | 53.53733 N, 3.34667 W | RV Prince Madog PD09/07 |
| 941691 | CTD or STD cast | 2007-05-16 00:31:00 | 53.53733 N, 3.3465 W | RV Prince Madog PD09/07 |
| 941709 | CTD or STD cast | 2007-05-16 01:00:00 | 53.53733 N, 3.3465 W | RV Prince Madog PD09/07 |
| 941710 | CTD or STD cast | 2007-05-16 01:32:00 | 53.53733 N, 3.34667 W | RV Prince Madog PD09/07 |
| 941722 | CTD or STD cast | 2007-05-16 02:01:00 | 53.53733 N, 3.34667 W | RV Prince Madog PD09/07 |
| 941734 | CTD or STD cast | 2007-05-16 03:00:00 | 53.537 N, 3.34717 W | RV Prince Madog PD09/07 |
| 941746 | CTD or STD cast | 2007-05-16 03:31:00 | 53.53683 N, 3.347 W | RV Prince Madog PD09/07 |
| 941758 | CTD or STD cast | 2007-05-16 03:59:00 | 53.537 N, 3.347 W | RV Prince Madog PD09/07 |
| 941771 | CTD or STD cast | 2007-05-16 04:29:00 | 53.53717 N, 3.34667 W | RV Prince Madog PD09/07 |
| 941783 | CTD or STD cast | 2007-05-16 05:00:00 | 53.5375 N, 3.34467 W | RV Prince Madog PD09/07 |
| 941795 | CTD or STD cast | 2007-05-16 05:31:00 | 53.53767 N, 3.34417 W | RV Prince Madog PD09/07 |
| 941802 | CTD or STD cast | 2007-05-16 06:00:00 | 53.53733 N, 3.34367 W | RV Prince Madog PD09/07 |
| 941814 | CTD or STD cast | 2007-05-16 06:29:00 | 53.53733 N, 3.3435 W | RV Prince Madog PD09/07 |
| 941826 | CTD or STD cast | 2007-05-16 07:03:00 | 53.53717 N, 3.3435 W | RV Prince Madog PD09/07 |
| 941838 | CTD or STD cast | 2007-05-16 07:30:00 | 53.53717 N, 3.3435 W | RV Prince Madog PD09/07 |
| 941851 | CTD or STD cast | 2007-05-16 08:00:00 | 53.537 N, 3.34333 W | RV Prince Madog PD09/07 |
| 941863 | CTD or STD cast | 2007-05-16 08:28:00 | 53.53717 N, 3.34333 W | RV Prince Madog PD09/07 |
| 941875 | CTD or STD cast | 2007-05-16 09:01:00 | 53.53717 N, 3.3435 W | RV Prince Madog PD09/07 |
| 941887 | CTD or STD cast | 2007-05-16 09:31:00 | 53.53717 N, 3.34333 W | RV Prince Madog PD09/07 |
| 941899 | CTD or STD cast | 2007-05-16 10:02:00 | 53.53717 N, 3.3435 W | RV Prince Madog PD09/07 |
| 941906 | CTD or STD cast | 2007-05-16 10:30:00 | 53.53717 N, 3.3435 W | RV Prince Madog PD09/07 |
| 941918 | CTD or STD cast | 2007-05-16 11:01:00 | 53.53733 N, 3.3435 W | RV Prince Madog PD09/07 |
| 941931 | CTD or STD cast | 2007-05-16 11:31:00 | 53.5375 N, 3.34367 W | RV Prince Madog PD09/07 |
| 941943 | CTD or STD cast | 2007-05-16 12:01:00 | 53.53717 N, 3.3455 W | RV Prince Madog PD09/07 |
| 941955 | CTD or STD cast | 2007-05-16 12:31:00 | 53.5375 N, 3.34633 W | RV Prince Madog PD09/07 |
| 941967 | CTD or STD cast | 2007-05-16 13:01:00 | 53.5365 N, 3.3465 W | RV Prince Madog PD09/07 |
| 941979 | CTD or STD cast | 2007-05-16 13:30:00 | 53.5365 N, 3.34633 W | RV Prince Madog PD09/07 |
| 941980 | CTD or STD cast | 2007-05-16 14:01:00 | 53.5375 N, 3.34683 W | RV Prince Madog PD09/07 |
| 941992 | CTD or STD cast | 2007-05-16 15:00:00 | 53.53683 N, 3.347 W | RV Prince Madog PD09/07 |
| 942006 | CTD or STD cast | 2007-05-16 15:31:00 | 53.53683 N, 3.347 W | RV Prince Madog PD09/07 |
| 942018 | CTD or STD cast | 2007-05-16 15:59:00 | 53.53683 N, 3.34683 W | RV Prince Madog PD09/07 |
| 942135 | CTD or STD cast | 2007-05-16 23:43:00 | 53.53383 N, 3.37783 W | RV Prince Madog PD09/07 |
| 942725 | CTD or STD cast | 2007-06-20 09:54:00 | 53.53517 N, 3.36067 W | RV Prince Madog PD13/07 |
| 952836 | Hydrography time series at depth | 2007-06-20 10:50:03 | 53.53433 N, 3.35467 W | RV Prince Madog PD13/07 |
| 952904 | Hydrography time series at depth | 2007-06-20 11:50:00 | 53.53533 N, 3.35717 W | RV Prince Madog PD13/07 |
| 952861 | Hydrography time series at depth | 2007-06-20 11:50:01 | 53.53533 N, 3.35717 W | RV Prince Madog PD13/07 |
| 952885 | Hydrography time series at depth | 2007-06-20 11:50:01 | 53.53533 N, 3.35717 W | RV Prince Madog PD13/07 |
| 862227 | Fluorescence or pigments | 2007-06-20 12:00:00 | 53.5363 N, 3.35708 W | RV Prince Madog PD13/07 |
| 862657 | PAR radiance and irradiance | 2007-06-20 12:00:00 | 53.5363 N, 3.35708 W | RV Prince Madog PD13/07 |
| 862750 | PAR radiance and irradiance | 2007-06-20 12:00:00 | 53.5363 N, 3.35708 W | RV Prince Madog PD13/07 |
| 862018 | Surface temp/sal | 2007-06-20 12:00:00 | 53.5363 N, 3.35708 W | RV Prince Madog PD13/07 |
| 862436 | Transmittance/attenuance, turbidity, or SPM conc. | 2007-06-20 12:00:00 | 53.5363 N, 3.35708 W | RV Prince Madog PD13/07 |
| 862854 | Water column chemistry | 2007-06-20 12:00:00 | 53.5363 N, 3.35708 W | RV Prince Madog PD13/07 |
| 942737 | CTD or STD cast | 2007-06-20 13:46:00 | 53.53867 N, 3.35167 W | RV Prince Madog PD13/07 |
| 942830 | CTD or STD cast | 2007-06-20 20:41:00 | 53.53767 N, 3.35817 W | RV Prince Madog PD13/07 |
| 943175 | CTD or STD cast | 2007-07-26 10:25:00 | 53.53783 N, 3.361 W | RV Prince Madog PD16/07 |
| 946345 | Hydrography time series at depth | 2007-07-26 12:00:03 | 53.53517 N, 3.35683 W | RV Prince Madog PD16/07 |
| 862239 | Fluorescence or pigments | 2007-07-26 12:30:00 | 53.53502 N, 3.35907 W | RV Prince Madog PD16/07 |
| 946370 | Hydrography time series at depth | 2007-07-26 12:30:00 | 53.535 N, 3.359 W | RV Prince Madog PD16/07 |
| 946382 | Hydrography time series at depth | 2007-07-26 12:30:00 | 53.535 N, 3.359 W | RV Prince Madog PD16/07 |
| 946401 | Hydrography time series at depth | 2007-07-26 12:30:00 | 53.535 N, 3.359 W | RV Prince Madog PD16/07 |
| 862669 | PAR radiance and irradiance | 2007-07-26 12:30:00 | 53.53502 N, 3.35907 W | RV Prince Madog PD16/07 |
| 862762 | PAR radiance and irradiance | 2007-07-26 12:30:00 | 53.53502 N, 3.35907 W | RV Prince Madog PD16/07 |
| 862031 | Surface temp/sal | 2007-07-26 12:30:00 | 53.53502 N, 3.35907 W | RV Prince Madog PD16/07 |
| 862448 | Transmittance/attenuance, turbidity, or SPM conc. | 2007-07-26 12:30:00 | 53.53502 N, 3.35907 W | RV Prince Madog PD16/07 |
| 862866 | Water column chemistry | 2007-07-26 12:30:00 | 53.53502 N, 3.35907 W | RV Prince Madog PD16/07 |
| 943187 | CTD or STD cast | 2007-07-26 14:56:00 | 53.53533 N, 3.352 W | RV Prince Madog PD16/07 |
| 943280 | CTD or STD cast | 2007-07-26 22:41:00 | 53.531 N, 3.36083 W | RV Prince Madog PD16/07 |
| 1082310 | Water column chemistry | 2007-07-27 02:00:00 | 53.53502 N, 3.35907 W | RV Prince Madog PD16/07 |
| 943568 | CTD or STD cast | 2007-08-29 11:12:00 | 53.53533 N, 3.33883 W | RV Prince Madog PD20/07 |
| 941433 | Hydrography time series at depth | 2007-08-29 13:20:03 | 53.535 N, 3.35733 W | RV Prince Madog PD20/07 |
| 941390 | Hydrography time series at depth | 2007-08-29 13:40:00 | 53.534 N, 3.36217 W | RV Prince Madog PD20/07 |
| 941408 | Hydrography time series at depth | 2007-08-29 13:40:00 | 53.534 N, 3.36217 W | RV Prince Madog PD20/07 |
| 941457 | Hydrography time series at depth | 2007-08-29 13:40:00 | 53.534 N, 3.36217 W | RV Prince Madog PD20/07 |
| 941469 | Hydrography time series at depth | 2007-08-29 13:40:00 | 53.534 N, 3.36217 W | RV Prince Madog PD20/07 |
| 862240 | Fluorescence or pigments | 2007-08-29 14:00:00 | 53.53393 N, 3.3621 W | RV Prince Madog PD20/07 |
| 862670 | PAR radiance and irradiance | 2007-08-29 14:00:00 | 53.53393 N, 3.3621 W | RV Prince Madog PD20/07 |
| 862774 | PAR radiance and irradiance | 2007-08-29 14:00:00 | 53.53393 N, 3.3621 W | RV Prince Madog PD20/07 |
| 862043 | Surface temp/sal | 2007-08-29 14:00:00 | 53.53393 N, 3.3621 W | RV Prince Madog PD20/07 |
| 862461 | Transmittance/attenuance, turbidity, or SPM conc. | 2007-08-29 14:00:00 | 53.53393 N, 3.3621 W | RV Prince Madog PD20/07 |
| 862878 | Water column chemistry | 2007-08-29 14:00:00 | 53.53393 N, 3.3621 W | RV Prince Madog PD20/07 |
| 943581 | CTD or STD cast | 2007-08-29 14:09:00 | 53.532 N, 3.37 W | RV Prince Madog PD20/07 |
| 943697 | CTD or STD cast | 2007-08-29 22:43:00 | 53.53067 N, 3.36067 W | RV Prince Madog PD20/07 |
| 1082322 | Water column chemistry | 2007-08-30 17:00:00 | 53.53393 N, 3.3621 W | RV Prince Madog PD20/07 |
| 1082475 | Water column chemistry | 2007-09-15 00:00:00 | 53.53393 N, 3.3621 W | RV Prince Madog PD20/07 |
| 945526 | CTD or STD cast | 2007-10-03 11:13:00 | 53.53267 N, 3.3575 W | RV Prince Madog PD23/07 |
| 767882 | Hydrography time series at depth | 2007-10-03 12:30:03 | 53.53517 N, 3.357 W | RV Prince Madog PD23/07 |
| 767901 | Hydrography time series at depth | 2007-10-03 12:50:00 | 53.53333 N, 3.36283 W | RV Prince Madog PD23/07 |
| 767833 | Hydrography time series at depth | 2007-10-03 12:50:01 | 53.53333 N, 3.36283 W | RV Prince Madog PD23/07 |
| 767869 | Hydrography time series at depth | 2007-10-03 12:50:01 | 53.53333 N, 3.36283 W | RV Prince Madog PD23/07 |
| 862252 | Fluorescence or pigments | 2007-10-03 13:00:00 | 53.5333 N, 3.36282 W | RV Prince Madog PD23/07 |
| 862682 | PAR radiance and irradiance | 2007-10-03 13:00:00 | 53.5333 N, 3.36282 W | RV Prince Madog PD23/07 |
| 862786 | PAR radiance and irradiance | 2007-10-03 13:00:00 | 53.5333 N, 3.36282 W | RV Prince Madog PD23/07 |
| 862055 | Surface temp/sal | 2007-10-03 13:00:00 | 53.5333 N, 3.36282 W | RV Prince Madog PD23/07 |
| 862473 | Transmittance/attenuance, turbidity, or SPM conc. | 2007-10-03 13:00:00 | 53.5333 N, 3.36282 W | RV Prince Madog PD23/07 |
| 862891 | Water column chemistry | 2007-10-03 13:00:00 | 53.5333 N, 3.36282 W | RV Prince Madog PD23/07 |
| 945538 | CTD or STD cast | 2007-10-03 13:17:00 | 53.53783 N, 3.356 W | RV Prince Madog PD23/07 |
| 1082334 | Water column chemistry | 2007-10-03 14:00:00 | 53.5333 N, 3.36282 W | RV Prince Madog PD23/07 |
| 945643 | CTD or STD cast | 2007-10-03 21:05:00 | 53.53233 N, 3.36183 W | RV Prince Madog PD23/07 |
| 1082487 | Water column chemistry | 2007-10-04 00:00:00 | 53.5333 N, 3.36282 W | RV Prince Madog PD23/07 |
| 946498 | CTD or STD cast | 2007-11-21 12:18:00 | 53.53083 N, 3.36317 W | RV Prince Madog PD27/07 |
| 770503 | Hydrography time series at depth | 2007-11-21 13:20:03 | 53.535 N, 3.35667 W | RV Prince Madog PD27/07 |
| 862264 | Fluorescence or pigments | 2007-11-21 13:30:00 | 53.53415 N, 3.35878 W | RV Prince Madog PD27/07 |
| 862694 | PAR radiance and irradiance | 2007-11-21 13:30:00 | 53.53415 N, 3.35878 W | RV Prince Madog PD27/07 |
| 862798 | PAR radiance and irradiance | 2007-11-21 13:30:00 | 53.53415 N, 3.35878 W | RV Prince Madog PD27/07 |
| 862067 | Surface temp/sal | 2007-11-21 13:30:00 | 53.53415 N, 3.35878 W | RV Prince Madog PD27/07 |
| 862485 | Transmittance/attenuance, turbidity, or SPM conc. | 2007-11-21 13:30:00 | 53.53415 N, 3.35878 W | RV Prince Madog PD27/07 |
| 862909 | Water column chemistry | 2007-11-21 13:30:00 | 53.53415 N, 3.35878 W | RV Prince Madog PD27/07 |
| 770515 | Hydrography time series at depth | 2007-11-21 13:40:00 | 53.53417 N, 3.35883 W | RV Prince Madog PD27/07 |
| 770527 | Hydrography time series at depth | 2007-11-21 13:40:00 | 53.53417 N, 3.35883 W | RV Prince Madog PD27/07 |
| 770552 | Hydrography time series at depth | 2007-11-21 13:40:00 | 53.53417 N, 3.35883 W | RV Prince Madog PD27/07 |
| 770564 | Hydrography time series at depth | 2007-11-21 13:40:00 | 53.53417 N, 3.35883 W | RV Prince Madog PD27/07 |
| 946505 | CTD or STD cast | 2007-11-21 13:54:00 | 53.536 N, 3.36083 W | RV Prince Madog PD27/07 |
| 1082346 | Water column chemistry | 2007-11-21 15:00:00 | 53.53415 N, 3.35878 W | RV Prince Madog PD27/07 |
| 946671 | CTD or STD cast | 2007-11-22 05:05:00 | 53.53617 N, 3.35267 W | RV Prince Madog PD27/07 |
| 1082499 | Water column chemistry | 2007-11-26 00:00:00 | 53.53415 N, 3.35878 W | RV Prince Madog PD27/07 |
| 946775 | CTD or STD cast | 2008-01-10 23:30:00 | 53.529 N, 3.35517 W | RV Prince Madog PD01/08 |
| 946867 | CTD or STD cast | 2008-01-11 06:42:00 | 53.53733 N, 3.3645 W | RV Prince Madog PD01/08 |
| 862276 | Fluorescence or pigments | 2008-01-11 08:00:00 | 53.53373 N, 3.35807 W | RV Prince Madog PD01/08 |
| 770460 | Hydrography time series at depth | 2008-01-11 08:00:00 | 53.53367 N, 3.358 W | RV Prince Madog PD01/08 |
| 770496 | Hydrography time series at depth | 2008-01-11 08:00:00 | 53.53367 N, 3.358 W | RV Prince Madog PD01/08 |
| 862701 | PAR radiance and irradiance | 2008-01-11 08:00:00 | 53.53373 N, 3.35807 W | RV Prince Madog PD01/08 |
| 862079 | Surface temp/sal | 2008-01-11 08:00:00 | 53.53373 N, 3.35807 W | RV Prince Madog PD01/08 |
| 862497 | Transmittance/attenuance, turbidity, or SPM conc. | 2008-01-11 08:00:00 | 53.53373 N, 3.35807 W | RV Prince Madog PD01/08 |
| 862910 | Water column chemistry | 2008-01-11 08:00:00 | 53.53373 N, 3.35807 W | RV Prince Madog PD01/08 |
| 1082358 | Water column chemistry | 2008-01-11 08:00:00 | 53.53373 N, 3.35807 W | RV Prince Madog PD01/08 |
| 770435 | Hydrography time series at depth | 2008-01-11 08:00:02 | 53.53367 N, 3.358 W | RV Prince Madog PD01/08 |
| 770459 | Hydrography time series at depth | 2008-01-11 08:00:02 | 53.53367 N, 3.358 W | RV Prince Madog PD01/08 |
| 862805 | PAR radiance and irradiance | 2008-01-11 08:30:00 | 53.53373 N, 3.35807 W | RV Prince Madog PD01/08 |
| 770411 | Hydrography time series at depth | 2008-01-11 10:30:03 | 53.53283 N, 3.3625 W | RV Prince Madog PD01/08 |
| 1623039 | Currents -subsurface Eulerian | 2008-01-11 10:30:38 | 53.53283 N, 3.3625 W | RV Prince Madog PD01/08 |
| 946879 | CTD or STD cast | 2008-01-11 10:46:00 | 53.53083 N, 3.35617 W | RV Prince Madog PD01/08 |
| 1082506 | Water column chemistry | 2008-01-13 00:00:00 | 53.53373 N, 3.35807 W | RV Prince Madog PD01/08 |
| 947103 | CTD or STD cast | 2008-03-14 07:57:00 | 53.53417 N, 3.36783 W | RV Prince Madog PD07/08 |
| 772374 | Hydrography time series at depth | 2008-03-14 10:30:03 | 53.53367 N, 3.35683 W | RV Prince Madog PD07/08 |
| 862288 | Fluorescence or pigments | 2008-03-14 11:00:00 | 53.53362 N, 3.35818 W | RV Prince Madog PD07/08 |
| 772386 | Hydrography time series at depth | 2008-03-14 11:00:00 | 53.53367 N, 3.35817 W | RV Prince Madog PD07/08 |
| 772405 | Hydrography time series at depth | 2008-03-14 11:00:00 | 53.53367 N, 3.35817 W | RV Prince Madog PD07/08 |
| 772430 | Hydrography time series at depth | 2008-03-14 11:00:00 | 53.53367 N, 3.35817 W | RV Prince Madog PD07/08 |
| 772442 | Hydrography time series at depth | 2008-03-14 11:00:00 | 53.53367 N, 3.35817 W | RV Prince Madog PD07/08 |
| 862713 | PAR radiance and irradiance | 2008-03-14 11:00:00 | 53.53362 N, 3.35818 W | RV Prince Madog PD07/08 |
| 862817 | PAR radiance and irradiance | 2008-03-14 11:00:00 | 53.53362 N, 3.35818 W | RV Prince Madog PD07/08 |
| 862080 | Surface temp/sal | 2008-03-14 11:00:00 | 53.53362 N, 3.35818 W | RV Prince Madog PD07/08 |
| 862504 | Transmittance/attenuance, turbidity, or SPM conc. | 2008-03-14 11:00:00 | 53.53362 N, 3.35818 W | RV Prince Madog PD07/08 |
| 862922 | Water column chemistry | 2008-03-14 11:00:00 | 53.53362 N, 3.35818 W | RV Prince Madog PD07/08 |
| 1082371 | Water column chemistry | 2008-03-14 11:00:00 | 53.53362 N, 3.35818 W | RV Prince Madog PD07/08 |
| 947115 | CTD or STD cast | 2008-03-14 11:31:00 | 53.52933 N, 3.35117 W | RV Prince Madog PD07/08 |
| 947244 | CTD or STD cast | 2008-04-16 09:26:00 | 53.53067 N, 3.363 W | RV Prince Madog PD09/08 |
| 772294 | Hydrography time series at depth | 2008-04-16 10:40:00 | 53.53367 N, 3.362 W | RV Prince Madog PD09/08 |
| 772313 | Hydrography time series at depth | 2008-04-16 10:40:00 | 53.53367 N, 3.362 W | RV Prince Madog PD09/08 |
| 772337 | Hydrography time series at depth | 2008-04-16 10:40:00 | 53.53367 N, 3.362 W | RV Prince Madog PD09/08 |
| 772349 | Hydrography time series at depth | 2008-04-16 10:40:00 | 53.53367 N, 3.362 W | RV Prince Madog PD09/08 |
| 1082229 | Fluorescence or pigments | 2008-04-16 11:00:00 | 53.53 N, 3.36 W | RV Prince Madog PD09/08 |
| 1082162 | Hydrography time series at depth | 2008-04-16 11:00:00 | 53.53 N, 3.36 W | RV Prince Madog PD09/08 |
| 1082426 | PAR radiance and irradiance | 2008-04-16 11:00:00 | 53.53 N, 3.36 W | RV Prince Madog PD09/08 |
| 1082555 | PAR radiance and irradiance | 2008-04-16 11:00:00 | 53.53 N, 3.36 W | RV Prince Madog PD09/08 |
| 1082242 | Transmittance/attenuance, turbidity, or SPM conc. | 2008-04-16 11:00:00 | 53.53 N, 3.36 W | RV Prince Madog PD09/08 |
| 1082383 | Water column chemistry | 2008-04-16 11:00:00 | 53.53 N, 3.36 W | RV Prince Madog PD09/08 |
| 1082402 | Water column chemistry | 2008-04-16 11:00:00 | 53.53 N, 3.36 W | RV Prince Madog PD09/08 |
| 947256 | CTD or STD cast | 2008-04-16 13:32:00 | 53.53767 N, 3.35917 W | RV Prince Madog PD09/08 |
| 772270 | Hydrography time series at depth | 2008-04-16 13:40:03 | 53.53367 N, 3.35683 W | RV Prince Madog PD09/08 |
| 1082518 | Water column chemistry | 2008-04-17 00:00:00 | 53.53 N, 3.36 W | RV Prince Madog PD09/08 |
| 947441 | CTD or STD cast | 2008-05-13 12:09:00 | 53.53633 N, 3.3625 W | RV Prince Madog PD14/08 |
| 838319 | Hydrography time series at depth | 2008-05-13 13:40:00 | 53.53433 N, 3.357 W | RV Prince Madog PD14/08 |
| 838332 | Hydrography time series at depth | 2008-05-13 13:40:00 | 53.53433 N, 3.357 W | RV Prince Madog PD14/08 |
| 838356 | Hydrography time series at depth | 2008-05-13 13:50:00 | 53.53433 N, 3.357 W | RV Prince Madog PD14/08 |
| 838368 | Hydrography time series at depth | 2008-05-13 13:50:00 | 53.53433 N, 3.357 W | RV Prince Madog PD14/08 |
| 1082230 | Fluorescence or pigments | 2008-05-13 14:00:00 | 53.53 N, 3.36 W | RV Prince Madog PD14/08 |
| 1082174 | Hydrography time series at depth | 2008-05-13 14:00:00 | 53.53 N, 3.36 W | RV Prince Madog PD14/08 |
| 1082438 | PAR radiance and irradiance | 2008-05-13 14:00:00 | 53.53 N, 3.36 W | RV Prince Madog PD14/08 |
| 1082567 | PAR radiance and irradiance | 2008-05-13 14:00:00 | 53.53 N, 3.36 W | RV Prince Madog PD14/08 |
| 1082254 | Transmittance/attenuance, turbidity, or SPM conc. | 2008-05-13 14:00:00 | 53.53 N, 3.36 W | RV Prince Madog PD14/08 |
| 1082414 | Water column chemistry | 2008-05-13 14:00:00 | 53.53 N, 3.36 W | RV Prince Madog PD14/08 |
| 947453 | CTD or STD cast | 2008-05-13 14:13:00 | 53.53183 N, 3.3505 W | RV Prince Madog PD14/08 |
| 1082395 | Water column chemistry | 2008-05-13 14:30:00 | 53.53 N, 3.36 W | RV Prince Madog PD14/08 |
| 947465 | CTD or STD cast | 2008-05-13 16:02:00 | 53.53783 N, 3.34667 W | RV Prince Madog PD14/08 |
| 947477 | CTD or STD cast | 2008-05-13 16:31:00 | 53.53733 N, 3.3465 W | RV Prince Madog PD14/08 |
| 947489 | CTD or STD cast | 2008-05-13 17:03:00 | 53.537 N, 3.34717 W | RV Prince Madog PD14/08 |
| 947490 | CTD or STD cast | 2008-05-13 17:31:00 | 53.53717 N, 3.34817 W | RV Prince Madog PD14/08 |
| 947508 | CTD or STD cast | 2008-05-13 18:05:00 | 53.53717 N, 3.34817 W | RV Prince Madog PD14/08 |
| 947521 | CTD or STD cast | 2008-05-13 18:32:00 | 53.53717 N, 3.34833 W | RV Prince Madog PD14/08 |
| 947533 | CTD or STD cast | 2008-05-13 19:02:00 | 53.53717 N, 3.34833 W | RV Prince Madog PD14/08 |
| 947545 | CTD or STD cast | 2008-05-13 19:30:00 | 53.53733 N, 3.34833 W | RV Prince Madog PD14/08 |
| 947557 | CTD or STD cast | 2008-05-13 20:04:00 | 53.53733 N, 3.34833 W | RV Prince Madog PD14/08 |
| 947569 | CTD or STD cast | 2008-05-13 20:33:00 | 53.53733 N, 3.3485 W | RV Prince Madog PD14/08 |
| 947570 | CTD or STD cast | 2008-05-13 21:02:00 | 53.5375 N, 3.34833 W | RV Prince Madog PD14/08 |
| 947582 | CTD or STD cast | 2008-05-13 21:32:00 | 53.5375 N, 3.3485 W | RV Prince Madog PD14/08 |
| 947594 | CTD or STD cast | 2008-05-13 22:01:00 | 53.5375 N, 3.3485 W | RV Prince Madog PD14/08 |
| 947601 | CTD or STD cast | 2008-05-13 22:30:00 | 53.5375 N, 3.34833 W | RV Prince Madog PD14/08 |
| 947613 | CTD or STD cast | 2008-05-13 23:01:00 | 53.5375 N, 3.3485 W | RV Prince Madog PD14/08 |
| 947625 | CTD or STD cast | 2008-05-13 23:33:00 | 53.5375 N, 3.3485 W | RV Prince Madog PD14/08 |
| 947637 | CTD or STD cast | 2008-05-14 00:00:00 | 53.5375 N, 3.3485 W | RV Prince Madog PD14/08 |
| 947649 | CTD or STD cast | 2008-05-14 00:29:00 | 53.5375 N, 3.3485 W | RV Prince Madog PD14/08 |
| 947650 | CTD or STD cast | 2008-05-14 01:03:00 | 53.53733 N, 3.3485 W | RV Prince Madog PD14/08 |
| 947662 | CTD or STD cast | 2008-05-14 01:32:00 | 53.53733 N, 3.34833 W | RV Prince Madog PD14/08 |
| 947674 | CTD or STD cast | 2008-05-14 02:03:00 | 53.53717 N, 3.34817 W | RV Prince Madog PD14/08 |
| 947686 | CTD or STD cast | 2008-05-14 02:31:00 | 53.53733 N, 3.34833 W | RV Prince Madog PD14/08 |
| 947698 | CTD or STD cast | 2008-05-14 03:02:00 | 53.537 N, 3.34783 W | RV Prince Madog PD14/08 |
| 947705 | CTD or STD cast | 2008-05-14 03:30:00 | 53.537 N, 3.34733 W | RV Prince Madog PD14/08 |
| 947717 | CTD or STD cast | 2008-05-14 04:01:00 | 53.53717 N, 3.34717 W | RV Prince Madog PD14/08 |
| 947729 | CTD or STD cast | 2008-05-14 04:28:00 | 53.537 N, 3.3475 W | RV Prince Madog PD14/08 |
| 947730 | CTD or STD cast | 2008-05-14 05:01:00 | 53.53717 N, 3.348 W | RV Prince Madog PD14/08 |
| 947742 | CTD or STD cast | 2008-05-14 05:46:00 | 53.53733 N, 3.34833 W | RV Prince Madog PD14/08 |
| 947754 | CTD or STD cast | 2008-05-14 06:02:00 | 53.53733 N, 3.34833 W | RV Prince Madog PD14/08 |
| 947766 | CTD or STD cast | 2008-05-14 06:28:00 | 53.53717 N, 3.34833 W | RV Prince Madog PD14/08 |
| 947778 | CTD or STD cast | 2008-05-14 07:04:00 | 53.53733 N, 3.34833 W | RV Prince Madog PD14/08 |
| 947791 | CTD or STD cast | 2008-05-14 07:29:00 | 53.53733 N, 3.34833 W | RV Prince Madog PD14/08 |
| 947809 | CTD or STD cast | 2008-05-14 08:00:00 | 53.53733 N, 3.34833 W | RV Prince Madog PD14/08 |
| 947810 | CTD or STD cast | 2008-05-14 08:31:00 | 53.53733 N, 3.34833 W | RV Prince Madog PD14/08 |
| 947822 | CTD or STD cast | 2008-05-14 09:01:00 | 53.5375 N, 3.34833 W | RV Prince Madog PD14/08 |
| 947834 | CTD or STD cast | 2008-05-14 09:34:00 | 53.53767 N, 3.34833 W | RV Prince Madog PD14/08 |
| 947846 | CTD or STD cast | 2008-05-14 10:00:00 | 53.53767 N, 3.34833 W | RV Prince Madog PD14/08 |
| 947858 | CTD or STD cast | 2008-05-14 10:28:00 | 53.53767 N, 3.34833 W | RV Prince Madog PD14/08 |
| 947871 | CTD or STD cast | 2008-05-14 11:01:00 | 53.53767 N, 3.34833 W | RV Prince Madog PD14/08 |
| 947883 | CTD or STD cast | 2008-05-14 11:31:00 | 53.53783 N, 3.34817 W | RV Prince Madog PD14/08 |
| 947895 | CTD or STD cast | 2008-05-14 12:02:00 | 53.53783 N, 3.34817 W | RV Prince Madog PD14/08 |
| 947902 | CTD or STD cast | 2008-05-14 12:32:00 | 53.53783 N, 3.34817 W | RV Prince Madog PD14/08 |
| 947914 | CTD or STD cast | 2008-05-14 13:03:00 | 53.53783 N, 3.34783 W | RV Prince Madog PD14/08 |
| 947926 | CTD or STD cast | 2008-05-14 13:33:00 | 53.53783 N, 3.34783 W | RV Prince Madog PD14/08 |
| 947938 | CTD or STD cast | 2008-05-14 14:02:00 | 53.5375 N, 3.34733 W | RV Prince Madog PD14/08 |
| 947951 | CTD or STD cast | 2008-05-14 14:37:00 | 53.53767 N, 3.34717 W | RV Prince Madog PD14/08 |
| 947963 | CTD or STD cast | 2008-05-14 15:03:00 | 53.53733 N, 3.34717 W | RV Prince Madog PD14/08 |
| 947975 | CTD or STD cast | 2008-05-14 15:32:00 | 53.5375 N, 3.3465 W | RV Prince Madog PD14/08 |
| 947987 | CTD or STD cast | 2008-05-14 16:03:00 | 53.53767 N, 3.3465 W | RV Prince Madog PD14/08 |
| 947999 | CTD or STD cast | 2008-05-14 16:33:00 | 53.5375 N, 3.3465 W | RV Prince Madog PD14/08 |
| 948002 | CTD or STD cast | 2008-05-14 17:05:00 | 53.53733 N, 3.3465 W | RV Prince Madog PD14/08 |
| 948118 | CTD or STD cast | 2008-05-15 03:16:00 | 53.5315 N, 3.36167 W | RV Prince Madog PD14/08 |
| 838288 | Hydrography time series at depth | 2008-05-15 13:30:03 | 53.53467 N, 3.35883 W | RV Prince Madog PD14/08 |
| 1082531 | Water column chemistry | 2008-05-18 00:00:00 | 53.53 N, 3.36 W | RV Prince Madog PD14/08 |
| 948500 | CTD or STD cast | 2008-06-25 10:49:00 | 53.5325 N, 3.35483 W | RV Prince Madog PD19/08 |
| 948745 | CTD or STD cast | 2008-06-26 07:34:00 | 53.53367 N, 3.356 W | RV Prince Madog PD19/08 |
| 949238 | CTD or STD cast | 2008-07-30 09:39:00 | 53.53583 N, 3.36283 W | RV Prince Madog PD23/08 |
| 1024583 | Fluorescence or pigments | 2008-07-30 12:30:00 | 53.53 N, 3.36 W | RV Prince Madog PD23/08 |
| 1024779 | PAR radiance and irradiance | 2008-07-30 12:30:00 | 53.53 N, 3.36 W | RV Prince Madog PD23/08 |
| 1024811 | PAR radiance and irradiance | 2008-07-30 12:30:00 | 53.53 N, 3.36 W | RV Prince Madog PD23/08 |
| 1024509 | Surface temp/sal | 2008-07-30 12:30:00 | 53.53 N, 3.36 W | RV Prince Madog PD23/08 |
| 1024663 | Transmittance/attenuance, turbidity, or SPM conc. | 2008-07-30 12:30:00 | 53.53 N, 3.36 W | RV Prince Madog PD23/08 |
| 1024743 | Water column chemistry | 2008-07-30 12:30:00 | 53.53 N, 3.36 W | RV Prince Madog PD23/08 |
| 949251 | CTD or STD cast | 2008-07-30 15:23:00 | 53.53867 N, 3.36367 W | RV Prince Madog PD23/08 |
| 949367 | CTD or STD cast | 2008-07-30 23:30:00 | 53.53333 N, 3.36983 W | RV Prince Madog PD23/08 |
| 857907 | Hydrography time series at depth | 2008-07-31 06:00:00 | 53.534 N, 3.36333 W | RV Prince Madog PD23/08 |
| 857932 | Hydrography time series at depth | 2008-07-31 06:00:02 | 53.534 N, 3.36333 W | RV Prince Madog PD23/08 |
| 857888 | Hydrography time series at depth | 2008-07-31 06:00:03 | 53.535 N, 3.35933 W | RV Prince Madog PD23/08 |
| 939220 | Hydrography time series at depth | 2008-09-10 11:30:03 | 53.53517 N, 3.35933 W | RV Prince Madog PD29/08 |
| 1024595 | Fluorescence or pigments | 2008-09-10 12:00:00 | 53.5342 N, 3.3596 W | RV Prince Madog PD29/08 |
| 939256 | Hydrography time series at depth | 2008-09-10 12:00:00 | 53.53483 N, 3.3605 W | RV Prince Madog PD29/08 |
| 939268 | Hydrography time series at depth | 2008-09-10 12:00:00 | 53.53483 N, 3.3605 W | RV Prince Madog PD29/08 |
| 939281 | Hydrography time series at depth | 2008-09-10 12:00:00 | 53.53483 N, 3.3605 W | RV Prince Madog PD29/08 |
| 939293 | Hydrography time series at depth | 2008-09-10 12:00:00 | 53.53483 N, 3.3605 W | RV Prince Madog PD29/08 |
| 1024780 | PAR radiance and irradiance | 2008-09-10 12:00:00 | 53.5342 N, 3.3596 W | RV Prince Madog PD29/08 |
| 1024823 | PAR radiance and irradiance | 2008-09-10 12:00:00 | 53.5342 N, 3.3596 W | RV Prince Madog PD29/08 |
| 1024510 | Surface temp/sal | 2008-09-10 12:00:00 | 53.5342 N, 3.3596 W | RV Prince Madog PD29/08 |
| 1024675 | Transmittance/attenuance, turbidity, or SPM conc. | 2008-09-10 12:00:00 | 53.5342 N, 3.3596 W | RV Prince Madog PD29/08 |
| 1024755 | Water column chemistry | 2008-09-10 12:00:00 | 53.5342 N, 3.3596 W | RV Prince Madog PD29/08 |
| 1024847 | Water column chemistry | 2008-09-10 13:39:00 | 53.5342 N, 3.3596 W | RV Prince Madog PD29/08 |
| 1024860 | Water column chemistry | 2008-09-11 00:00:00 | 53.5342 N, 3.3596 W | RV Prince Madog PD29/08 |
| 949668 | CTD or STD cast | 2008-10-22 14:50:00 | 53.53567 N, 3.36267 W | RV Prince Madog PD33/08 |
| 805455 | Hydrography time series at depth | 2008-10-22 16:30:03 | 53.5345 N, 3.35583 W | RV Prince Madog PD33/08 |
| 808730 | Hydrography time series at depth | 2008-10-22 16:30:12 | 53.5345 N, 3.35583 W | RV Prince Madog PD33/08 |
| 949681 | CTD or STD cast | 2008-10-22 16:39:00 | 53.53167 N, 3.35283 W | RV Prince Madog PD33/08 |
| 949889 | CTD or STD cast | 2008-12-10 13:17:00 | 53.5315 N, 3.36217 W | RV Prince Madog PD37/08 |
| 1022877 | Hydrography time series at depth | 2008-12-10 16:20:03 | 53.5335 N, 3.3575 W | RV Prince Madog PD37/08 |
| 1022889 | Hydrography time series at depth | 2008-12-10 16:20:12 | 53.5335 N, 3.3575 W | RV Prince Madog PD37/08 |
| 949890 | CTD or STD cast | 2008-12-10 16:21:00 | 53.53067 N, 3.35783 W | RV Prince Madog PD37/08 |
| 950092 | CTD or STD cast | 2008-12-11 08:24:00 | 53.53767 N, 3.3635 W | RV Prince Madog PD37/08 |
| 1022945 | Hydrography time series at depth | 2008-12-11 08:50:00 | 53.537 N, 3.357 W | RV Prince Madog PD37/08 |
| 1022957 | Hydrography time series at depth | 2008-12-11 08:50:00 | 53.537 N, 3.357 W | RV Prince Madog PD37/08 |
| 1022890 | Hydrography time series at depth | 2008-12-11 08:50:01 | 53.537 N, 3.357 W | RV Prince Madog PD37/08 |
| 1022933 | Hydrography time series at depth | 2008-12-11 08:50:01 | 53.537 N, 3.357 W | RV Prince Madog PD37/08 |
| 1024602 | Fluorescence or pigments | 2008-12-11 09:00:00 | 53.5369 N, 3.3571 W | RV Prince Madog PD37/08 |
| 1024792 | PAR radiance and irradiance | 2008-12-11 09:00:00 | 53.5369 N, 3.3571 W | RV Prince Madog PD37/08 |
| 1024835 | PAR radiance and irradiance | 2008-12-11 09:00:00 | 53.5369 N, 3.3571 W | RV Prince Madog PD37/08 |
| 1024522 | Surface temp/sal | 2008-12-11 09:00:00 | 53.5369 N, 3.3571 W | RV Prince Madog PD37/08 |
| 1024687 | Transmittance/attenuance, turbidity, or SPM conc. | 2008-12-11 09:00:00 | 53.5369 N, 3.3571 W | RV Prince Madog PD37/08 |
| 1024767 | Water column chemistry | 2008-12-11 09:00:00 | 53.5369 N, 3.3571 W | RV Prince Madog PD37/08 |
| 950111 | CTD or STD cast | 2008-12-11 09:30:00 | 53.53417 N, 3.35667 W | RV Prince Madog PD37/08 |
| 1024859 | Water column chemistry | 2008-12-11 10:10:00 | 53.5369 N, 3.3571 W | RV Prince Madog PD37/08 |
| 950203 | CTD or STD cast | 2009-02-05 08:36:00 | 53.53417 N, 3.35617 W | RV Prince Madog PD02/09B |
| 1048388 | Hydrography time series at depth | 2009-02-05 10:00:03 | 53.53333 N, 3.35783 W | RV Prince Madog PD02/09B |
| 1048407 | Hydrography time series at depth | 2009-02-05 10:00:12 | 53.53333 N, 3.35783 W | RV Prince Madog PD02/09B |
| 1075767 | Fluorescence or pigments | 2009-02-05 10:30:00 | 53.5335 N, 3.3614 W | RV Prince Madog PD02/09B |
| 1048419 | Hydrography time series at depth | 2009-02-05 10:30:00 | 53.5335 N, 3.36133 W | RV Prince Madog PD02/09B |
| 1048420 | Hydrography time series at depth | 2009-02-05 10:30:00 | 53.5335 N, 3.36133 W | RV Prince Madog PD02/09B |
| 1048456 | Hydrography time series at depth | 2009-02-05 10:30:00 | 53.5335 N, 3.36133 W | RV Prince Madog PD02/09B |
| 1048468 | Hydrography time series at depth | 2009-02-05 10:30:00 | 53.5335 N, 3.36133 W | RV Prince Madog PD02/09B |
| 1075350 | Hydrography time series at depth | 2009-02-05 10:30:00 | 53.5335 N, 3.3614 W | RV Prince Madog PD02/09B |
| 1076470 | PAR radiance and irradiance | 2009-02-05 10:30:00 | 53.5335 N, 3.3614 W | RV Prince Madog PD02/09B |
| 1076863 | PAR radiance and irradiance | 2009-02-05 10:30:00 | 53.5335 N, 3.3614 W | RV Prince Madog PD02/09B |
| 1075927 | Transmittance/attenuance, turbidity, or SPM conc. | 2009-02-05 10:30:00 | 53.5335 N, 3.3614 W | RV Prince Madog PD02/09B |
| 1076261 | Water column chemistry | 2009-02-05 10:30:00 | 53.5335 N, 3.3614 W | RV Prince Madog PD02/09B |
| 950589 | CTD or STD cast | 2009-02-05 10:57:00 | 53.53533 N, 3.36717 W | RV Prince Madog PD02/09B |
| 1076144 | Water column chemistry | 2009-02-05 12:09:00 | 53.5335 N, 3.3614 W | RV Prince Madog PD02/09B |
| 950461 | CTD or STD cast | 2009-02-06 07:29:00 | 53.53133 N, 3.3595 W | RV Prince Madog PD02/09B |
| 951218 | CTD or STD cast | 2009-04-01 06:22:00 | 53.54033 N, 3.35267 W | RV Prince Madog PD12/09 |
| 1075779 | Fluorescence or pigments | 2009-04-01 09:00:00 | 53.5328 N, 3.3648 W | RV Prince Madog PD12/09 |
| 1075362 | Hydrography time series at depth | 2009-04-01 09:00:00 | 53.5328 N, 3.3648 W | RV Prince Madog PD12/09 |
| 1076482 | PAR radiance and irradiance | 2009-04-01 09:00:00 | 53.5328 N, 3.3648 W | RV Prince Madog PD12/09 |
| 1076709 | PAR radiance and irradiance | 2009-04-01 09:00:00 | 53.5328 N, 3.3648 W | RV Prince Madog PD12/09 |
| 1075939 | Transmittance/attenuance, turbidity, or SPM conc. | 2009-04-01 09:00:00 | 53.5328 N, 3.3648 W | RV Prince Madog PD12/09 |
| 1076273 | Water column chemistry | 2009-04-01 09:00:00 | 53.5328 N, 3.3648 W | RV Prince Madog PD12/09 |
| 951231 | CTD or STD cast | 2009-04-01 09:08:00 | 53.53483 N, 3.36433 W | RV Prince Madog PD12/09 |
| 1076156 | Water column chemistry | 2009-04-01 09:40:00 | 53.5328 N, 3.3648 W | RV Prince Madog PD12/09 |
| 951488 | CTD or STD cast | 2009-04-02 05:32:00 | 53.53217 N, 3.366 W | RV Prince Madog PD12/09 |
| 953495 | CTD or STD cast | 2009-05-12 05:21:00 | 53.53733 N, 3.3665 W | RV Prince Madog PD18/09 |
| 1075780 | Fluorescence or pigments | 2009-05-12 08:30:00 | 53.5332 N, 3.3605 W | RV Prince Madog PD18/09 |
| 1075374 | Hydrography time series at depth | 2009-05-12 08:30:00 | 53.5332 N, 3.3605 W | RV Prince Madog PD18/09 |
| 1076494 | PAR radiance and irradiance | 2009-05-12 08:30:00 | 53.5332 N, 3.3605 W | RV Prince Madog PD18/09 |
| 1076710 | PAR radiance and irradiance | 2009-05-12 08:30:00 | 53.5332 N, 3.3605 W | RV Prince Madog PD18/09 |
| 1076617 | Transmittance/attenuance, turbidity, or SPM conc. | 2009-05-12 08:30:00 | 53.5332 N, 3.3605 W | RV Prince Madog PD18/09 |
| 1076285 | Water column chemistry | 2009-05-12 08:30:00 | 53.5332 N, 3.3605 W | RV Prince Madog PD18/09 |
| 953502 | CTD or STD cast | 2009-05-12 09:53:00 | 53.5305 N, 3.3575 W | RV Prince Madog PD18/09 |
| 1076408 | Water column chemistry | 2009-05-13 00:00:00 | 53.5332 N, 3.3605 W | RV Prince Madog PD18/09 |
| 953784 | CTD or STD cast | 2009-05-13 09:39:00 | 53.53717 N, 3.36067 W | RV Prince Madog PD18/09 |
| 1076168 | Water column chemistry | 2009-05-24 18:09:00 | 53.5332 N, 3.3605 W | RV Prince Madog PD18/09 |
| 1022982 | CTD or STD cast | 2009-06-17 07:10:00 | 53.53883 N, 3.359 W | RV Prince Madog PD24/09 |
| 1075792 | Fluorescence or pigments | 2009-06-17 08:30:00 | 53.534 N, 3.3595 W | RV Prince Madog PD24/09 |
| 1075386 | Hydrography time series at depth | 2009-06-17 08:30:00 | 53.534 N, 3.3595 W | RV Prince Madog PD24/09 |
| 1076501 | PAR radiance and irradiance | 2009-06-17 08:30:00 | 53.534 N, 3.3595 W | RV Prince Madog PD24/09 |
| 1076722 | PAR radiance and irradiance | 2009-06-17 08:30:00 | 53.534 N, 3.3595 W | RV Prince Madog PD24/09 |
| 1075940 | Transmittance/attenuance, turbidity, or SPM conc. | 2009-06-17 08:30:00 | 53.534 N, 3.3595 W | RV Prince Madog PD24/09 |
| 1076297 | Water column chemistry | 2009-06-17 08:30:00 | 53.534 N, 3.3595 W | RV Prince Madog PD24/09 |
| 1022994 | CTD or STD cast | 2009-06-17 08:35:00 | 53.53633 N, 3.36183 W | RV Prince Madog PD24/09 |
| 1023008 | CTD or STD cast | 2009-06-17 09:27:00 | 53.53533 N, 3.362 W | RV Prince Madog PD24/09 |
| 1023125 | CTD or STD cast | 2009-06-17 19:57:00 | 53.5355 N, 3.3635 W | RV Prince Madog PD24/09 |
| 1076421 | Water column chemistry | 2009-06-18 00:00:00 | 53.534 N, 3.3595 W | RV Prince Madog PD24/09 |
| 1023402 | CTD or STD cast | 2009-08-03 05:18:00 | 53.53767 N, 3.35433 W | RV Prince Madog PD33/09 |
| 1075811 | Fluorescence or pigments | 2009-08-03 07:30:00 | 53.534 N, 3.3637 W | RV Prince Madog PD33/09 |
| 1075398 | Hydrography time series at depth | 2009-08-03 07:30:00 | 53.534 N, 3.3637 W | RV Prince Madog PD33/09 |
| 1076513 | PAR radiance and irradiance | 2009-08-03 07:30:00 | 53.534 N, 3.3637 W | RV Prince Madog PD33/09 |
| 1076734 | PAR radiance and irradiance | 2009-08-03 07:30:00 | 53.534 N, 3.3637 W | RV Prince Madog PD33/09 |
| 1075952 | Transmittance/attenuance, turbidity, or SPM conc. | 2009-08-03 07:30:00 | 53.534 N, 3.3637 W | RV Prince Madog PD33/09 |
| 1076304 | Water column chemistry | 2009-08-03 07:30:00 | 53.534 N, 3.3637 W | RV Prince Madog PD33/09 |
| 1023414 | CTD or STD cast | 2009-08-03 07:54:00 | 53.53617 N, 3.35683 W | RV Prince Madog PD33/09 |
| 1023438 | CTD or STD cast | 2009-08-03 09:21:00 | 53.53583 N, 3.3605 W | RV Prince Madog PD33/09 |
| 1076181 | Water column chemistry | 2009-08-06 18:00:00 | 53.534 N, 3.3637 W | RV Prince Madog PD33/09 |
| 1024097 | CTD or STD cast | 2009-09-15 08:03:00 | 53.53133 N, 3.35783 W | RV Prince Madog PD38/09 |
| 1075823 | Fluorescence or pigments | 2009-09-15 09:30:00 | 53.5337 N, 3.3597 W | RV Prince Madog PD38/09 |
| 1075405 | Hydrography time series at depth | 2009-09-15 09:30:00 | 53.5337 N, 3.3597 W | RV Prince Madog PD38/09 |
| 1076525 | PAR radiance and irradiance | 2009-09-15 09:30:00 | 53.5337 N, 3.3597 W | RV Prince Madog PD38/09 |
| 1076746 | PAR radiance and irradiance | 2009-09-15 09:30:00 | 53.5337 N, 3.3597 W | RV Prince Madog PD38/09 |
| 1075964 | Transmittance/attenuance, turbidity, or SPM conc. | 2009-09-15 09:30:00 | 53.5337 N, 3.3597 W | RV Prince Madog PD38/09 |
| 1076678 | Water column chemistry | 2009-09-15 09:30:00 | 53.5337 N, 3.3597 W | RV Prince Madog PD38/09 |
| 1024104 | CTD or STD cast | 2009-09-15 09:41:00 | 53.53167 N, 3.359 W | RV Prince Madog PD38/09 |
| 1076193 | Water column chemistry | 2009-09-15 20:00:00 | 53.5337 N, 3.3597 W | RV Prince Madog PD38/09 |
| 1024362 | CTD or STD cast | 2009-09-16 05:56:00 | 53.53267 N, 3.35717 W | RV Prince Madog PD38/09 |
| 1030299 | CTD or STD cast | 2009-12-02 11:47:00 | 53.53233 N, 3.363 W | RV Prince Madog PD47/09 |
| 1075835 | Fluorescence or pigments | 2009-12-02 13:00:00 | 53.5342 N, 3.3638 W | RV Prince Madog PD47/09 |
| 1075417 | Hydrography time series at depth | 2009-12-02 13:00:00 | 53.5342 N, 3.3638 W | RV Prince Madog PD47/09 |
| 1076537 | PAR radiance and irradiance | 2009-12-02 13:00:00 | 53.5342 N, 3.3638 W | RV Prince Madog PD47/09 |
| 1076758 | PAR radiance and irradiance | 2009-12-02 13:00:00 | 53.5342 N, 3.3638 W | RV Prince Madog PD47/09 |
| 1075976 | Transmittance/attenuance, turbidity, or SPM conc. | 2009-12-02 13:00:00 | 53.5342 N, 3.3638 W | RV Prince Madog PD47/09 |
| 1076316 | Water column chemistry | 2009-12-02 13:00:00 | 53.5342 N, 3.3638 W | RV Prince Madog PD47/09 |
| 1030306 | CTD or STD cast | 2009-12-02 13:36:00 | 53.53583 N, 3.36717 W | RV Prince Madog PD47/09 |
| 1076433 | Water column chemistry | 2009-12-03 00:00:00 | 53.5342 N, 3.3638 W | RV Prince Madog PD47/09 |
| 1030367 | CTD or STD cast | 2010-01-26 08:50:00 | 53.53333 N, 3.36367 W | RV Prince Madog PD02/10 |
| 1075847 | Fluorescence or pigments | 2010-01-26 10:00:00 | 53.5332 N, 3.362 W | RV Prince Madog PD02/10 |
| 1075429 | Hydrography time series at depth | 2010-01-26 10:00:00 | 53.5332 N, 3.362 W | RV Prince Madog PD02/10 |
| 1076549 | PAR radiance and irradiance | 2010-01-26 10:00:00 | 53.5332 N, 3.362 W | RV Prince Madog PD02/10 |
| 1076771 | PAR radiance and irradiance | 2010-01-26 10:00:00 | 53.5332 N, 3.362 W | RV Prince Madog PD02/10 |
| 1075988 | Transmittance/attenuance, turbidity, or SPM conc. | 2010-01-26 10:00:00 | 53.5332 N, 3.362 W | RV Prince Madog PD02/10 |
| 1076328 | Water column chemistry | 2010-01-26 10:00:00 | 53.5332 N, 3.362 W | RV Prince Madog PD02/10 |
| 1030379 | CTD or STD cast | 2010-01-26 10:18:00 | 53.5345 N, 3.36683 W | RV Prince Madog PD02/10 |
| 1030540 | CTD or STD cast | 2010-01-27 04:00:00 | 53.5365 N, 3.35483 W | RV Prince Madog PD02/10 |
| 1038290 | CTD or STD cast | 2010-03-17 12:36:00 | 53.53167 N, 3.34967 W | RV Prince Madog PD05/10 |
| 1075859 | Fluorescence or pigments | 2010-03-17 13:30:00 | 53.5323 N, 3.3638 W | RV Prince Madog PD05/10 |
| 1075430 | Hydrography time series at depth | 2010-03-17 13:30:00 | 53.5323 N, 3.3638 W | RV Prince Madog PD05/10 |
| 1076550 | PAR radiance and irradiance | 2010-03-17 13:30:00 | 53.5323 N, 3.3638 W | RV Prince Madog PD05/10 |
| 1076783 | PAR radiance and irradiance | 2010-03-17 13:30:00 | 53.5323 N, 3.3638 W | RV Prince Madog PD05/10 |
| 1076003 | Transmittance/attenuance, turbidity, or SPM conc. | 2010-03-17 13:30:00 | 53.5323 N, 3.3638 W | RV Prince Madog PD05/10 |
| 1076200 | Water column chemistry | 2010-03-17 13:30:00 | 53.5323 N, 3.3638 W | RV Prince Madog PD05/10 |
| 1076341 | Water column chemistry | 2010-03-17 13:30:00 | 53.5323 N, 3.3638 W | RV Prince Madog PD05/10 |
| 1038308 | CTD or STD cast | 2010-03-17 13:52:00 | 53.53467 N, 3.36917 W | RV Prince Madog PD05/10 |
| 1076445 | Water column chemistry | 2010-03-18 00:00:00 | 53.5323 N, 3.3638 W | RV Prince Madog PD05/10 |
| 1075860 | Fluorescence or pigments | 2010-04-28 12:30:00 | 53.533 N, 3.3632 W | RV Prince Madog PD10/10 |
| 1075442 | Hydrography time series at depth | 2010-04-28 12:30:00 | 53.533 N, 3.3632 W | RV Prince Madog PD10/10 |
| 1076562 | PAR radiance and irradiance | 2010-04-28 12:30:00 | 53.533 N, 3.3632 W | RV Prince Madog PD10/10 |
| 1076795 | PAR radiance and irradiance | 2010-04-28 12:30:00 | 53.533 N, 3.3632 W | RV Prince Madog PD10/10 |
| 1076015 | Transmittance/attenuance, turbidity, or SPM conc. | 2010-04-28 12:30:00 | 53.533 N, 3.3632 W | RV Prince Madog PD10/10 |
| 1076353 | Water column chemistry | 2010-04-28 12:30:00 | 53.533 N, 3.3632 W | RV Prince Madog PD10/10 |
| 1076457 | Water column chemistry | 2010-04-29 00:00:00 | 53.533 N, 3.3632 W | RV Prince Madog PD10/10 |
| 1076212 | Water column chemistry | 2010-04-29 18:00:00 | 53.533 N, 3.3632 W | RV Prince Madog PD10/10 |
| 1090383 | CTD or STD cast | 2010-06-09 09:10:00 | 53.53033 N, 3.34717 W | RV Prince Madog PD17/10 |
| 1075872 | Fluorescence or pigments | 2010-06-09 10:30:00 | 53.5343 N, 3.3637 W | RV Prince Madog PD17/10 |
| 1075454 | Hydrography time series at depth | 2010-06-09 10:30:00 | 53.5343 N, 3.3637 W | RV Prince Madog PD17/10 |
| 1076574 | PAR radiance and irradiance | 2010-06-09 10:30:00 | 53.5343 N, 3.3637 W | RV Prince Madog PD17/10 |
| 1076802 | PAR radiance and irradiance | 2010-06-09 10:30:00 | 53.5343 N, 3.3637 W | RV Prince Madog PD17/10 |
| 1076027 | Transmittance/attenuance, turbidity, or SPM conc. | 2010-06-09 10:30:00 | 53.5343 N, 3.3637 W | RV Prince Madog PD17/10 |
| 1076365 | Water column chemistry | 2010-06-09 10:30:00 | 53.5343 N, 3.3637 W | RV Prince Madog PD17/10 |
| 1090395 | CTD or STD cast | 2010-06-09 12:32:00 | 53.53317 N, 3.3675 W | RV Prince Madog PD17/10 |
| 1090715 | CTD or STD cast | 2010-06-10 20:13:00 | 53.5285 N, 3.36117 W | RV Prince Madog PD17/10 |
| 1090739 | CTD or STD cast | 2010-07-07 07:55:00 | 53.53233 N, 3.3515 W | RV Prince Madog PD21/10 |
| 1075884 | Fluorescence or pigments | 2010-07-07 10:00:00 | 53.5352 N, 3.3615 W | RV Prince Madog PD21/10 |
| 1075466 | Hydrography time series at depth | 2010-07-07 10:00:00 | 53.5352 N, 3.3615 W | RV Prince Madog PD21/10 |
| 1076586 | PAR radiance and irradiance | 2010-07-07 10:00:00 | 53.5352 N, 3.3615 W | RV Prince Madog PD21/10 |
| 1076814 | PAR radiance and irradiance | 2010-07-07 10:00:00 | 53.5352 N, 3.3615 W | RV Prince Madog PD21/10 |
| 1076039 | Transmittance/attenuance, turbidity, or SPM conc. | 2010-07-07 10:00:00 | 53.5352 N, 3.3615 W | RV Prince Madog PD21/10 |
| 1076377 | Water column chemistry | 2010-07-07 10:00:00 | 53.5352 N, 3.3615 W | RV Prince Madog PD21/10 |
| 1090740 | CTD or STD cast | 2010-07-07 10:15:00 | 53.534 N, 3.36317 W | RV Prince Madog PD21/10 |
| 1090868 | CTD or STD cast | 2010-07-07 19:58:00 | 53.53717 N, 3.35767 W | RV Prince Madog PD21/10 |
| 1112036 | CTD or STD cast | 2010-08-11 06:16:00 | 53.5355 N, 3.34933 W | RV Prince Madog PD29/10 |
| 1075896 | Fluorescence or pigments | 2010-08-11 08:00:00 | 53.5332 N, 3.3613 W | RV Prince Madog PD29/10 |
| 1075478 | Hydrography time series at depth | 2010-08-11 08:00:00 | 53.5332 N, 3.3613 W | RV Prince Madog PD29/10 |
| 1076598 | PAR radiance and irradiance | 2010-08-11 08:00:00 | 53.5332 N, 3.3613 W | RV Prince Madog PD29/10 |
| 1076826 | PAR radiance and irradiance | 2010-08-11 08:00:00 | 53.5332 N, 3.3613 W | RV Prince Madog PD29/10 |
| 1076040 | Transmittance/attenuance, turbidity, or SPM conc. | 2010-08-11 08:00:00 | 53.5332 N, 3.3613 W | RV Prince Madog PD29/10 |
| 1076389 | Water column chemistry | 2010-08-11 08:00:00 | 53.5332 N, 3.3613 W | RV Prince Madog PD29/10 |
| 1112048 | CTD or STD cast | 2010-08-11 09:05:00 | 53.53967 N, 3.3505 W | RV Prince Madog PD29/10 |
| 1076224 | Water column chemistry | 2010-08-11 16:30:00 | 53.5332 N, 3.3613 W | RV Prince Madog PD29/10 |
| 1076666 | Water column chemistry | 2010-08-12 00:00:00 | 53.5332 N, 3.3613 W | RV Prince Madog PD29/10 |
| 1112313 | CTD or STD cast | 2010-08-12 08:04:00 | 53.5305 N, 3.35517 W | RV Prince Madog PD29/10 |
| 1113906 | CTD or STD cast | 2010-09-28 06:10:00 | 53.53617 N, 3.36783 W | RV Prince Madog PD36/10 |
| 1075903 | Fluorescence or pigments | 2010-09-28 09:00:00 | 53.5335 N, 3.3637 W | RV Prince Madog PD36/10 |
| 1075491 | Hydrography time series at depth | 2010-09-28 09:00:00 | 53.5335 N, 3.3637 W | RV Prince Madog PD36/10 |
| 1076605 | PAR radiance and irradiance | 2010-09-28 09:00:00 | 53.5335 N, 3.3637 W | RV Prince Madog PD36/10 |
| 1076838 | PAR radiance and irradiance | 2010-09-28 09:00:00 | 53.5335 N, 3.3637 W | RV Prince Madog PD36/10 |
| 1076052 | Transmittance/attenuance, turbidity, or SPM conc. | 2010-09-28 09:00:00 | 53.5335 N, 3.3637 W | RV Prince Madog PD36/10 |
| 1076691 | Water column chemistry | 2010-09-28 09:00:00 | 53.5335 N, 3.3637 W | RV Prince Madog PD36/10 |
| 1113918 | CTD or STD cast | 2010-09-28 09:42:00 | 53.53467 N, 3.35883 W | RV Prince Madog PD36/10 |
| 1076236 | Water column chemistry | 2010-09-28 10:00:00 | 53.5335 N, 3.3637 W | RV Prince Madog PD36/10 |
| 1114184 | CTD or STD cast | 2010-09-29 05:41:00 | 53.5355 N, 3.36983 W | RV Prince Madog PD36/10 |
| 1075915 | Fluorescence or pigments | 2010-12-07 13:00:00 | 53.5345 N, 3.3573 W | RV Prince Madog PD49/10 |
| 1075509 | Hydrography time series at depth | 2010-12-07 13:00:00 | 53.5345 N, 3.3573 W | RV Prince Madog PD49/10 |
| 1076851 | PAR radiance and irradiance | 2010-12-07 13:00:00 | 53.5345 N, 3.3573 W | RV Prince Madog PD49/10 |
| 1076064 | Transmittance/attenuance, turbidity, or SPM conc. | 2010-12-07 13:00:00 | 53.5345 N, 3.3573 W | RV Prince Madog PD49/10 |
| 1076390 | Water column chemistry | 2010-12-07 13:00:00 | 53.5345 N, 3.3573 W | RV Prince Madog PD49/10 |
| 1076248 | Water column chemistry | 2010-12-07 16:00:00 | 53.5345 N, 3.3573 W | RV Prince Madog PD49/10 |
| 1141041 | CTD or STD cast | 2010-12-07 22:34:00 | 53.5295 N, 3.35817 W | RV Prince Madog PD49/10 |
| 1076469 | Water column chemistry | 2010-12-08 00:00:00 | 53.5345 N, 3.3573 W | RV Prince Madog PD49/10 |
| 1148802 | CTD or STD cast | 2011-01-12 08:07:00 | 53.539 N, 3.35117 W | RV Prince Madog PD01/11 |
| 1166440 | Hydrography time series at depth | 2011-01-12 09:30:00 | 53.5472 N, 3.361 W | RV Prince Madog PD01/11 |
| 1166476 | PAR radiance and irradiance | 2011-01-12 09:30:00 | 53.5472 N, 3.361 W | RV Prince Madog PD01/11 |
| 1166488 | PAR radiance and irradiance | 2011-01-12 09:30:00 | 53.5472 N, 3.361 W | RV Prince Madog PD01/11 |
| 1166452 | Transmittance/attenuance, turbidity, or SPM conc. | 2011-01-12 09:30:00 | 53.5472 N, 3.361 W | RV Prince Madog PD01/11 |
| 1166464 | Water column chemistry | 2011-01-12 09:30:00 | 53.5472 N, 3.361 W | RV Prince Madog PD01/11 |
| 1148814 | CTD or STD cast | 2011-01-12 09:49:00 | 53.53267 N, 3.35683 W | RV Prince Madog PD01/11 |
| 1166821 | Water column chemistry | 2011-01-13 00:00:00 | 53.5472 N, 3.361 W | RV Prince Madog PD01/11 |
| 1149092 | CTD or STD cast | 2011-01-13 10:47:00 | 53.5335 N, 3.3675 W | RV Prince Madog PD01/11 |
| 1149669 | CTD or STD cast | 2011-03-16 10:03:00 | 53.53083 N, 3.35233 W | RV Prince Madog PD07/11 |
| 1166507 | Hydrography time series at depth | 2011-03-16 11:30:00 | 53.5333 N, 3.3624 W | RV Prince Madog PD07/11 |
| 1166532 | PAR radiance and irradiance | 2011-03-16 11:30:00 | 53.5333 N, 3.3624 W | RV Prince Madog PD07/11 |
| 1166544 | PAR radiance and irradiance | 2011-03-16 11:30:00 | 53.5333 N, 3.3624 W | RV Prince Madog PD07/11 |
| 1166556 | PAR radiance and irradiance | 2011-03-16 11:30:00 | 53.5333 N, 3.3624 W | RV Prince Madog PD07/11 |
| 1166519 | Transmittance/attenuance, turbidity, or SPM conc. | 2011-03-16 11:30:00 | 53.5333 N, 3.3624 W | RV Prince Madog PD07/11 |
| 1166520 | Water column chemistry | 2011-03-16 11:30:00 | 53.5333 N, 3.3624 W | RV Prince Madog PD07/11 |
| 1149670 | CTD or STD cast | 2011-03-16 11:46:00 | 53.53567 N, 3.36083 W | RV Prince Madog PD07/11 |
| 1166833 | Water column chemistry | 2011-03-16 13:30:00 | 53.5333 N, 3.3624 W | RV Prince Madog PD07/11 |
| 1149971 | CTD or STD cast | 2011-03-17 10:41:00 | 53.53033 N, 3.365 W | RV Prince Madog PD07/11 |
| 1150136 | CTD or STD cast | 2011-03-18 16:29:00 | 53.53267 N, 3.36083 W | RV Prince Madog PD07/11 |
| 1116873 | CTD or STD cast | 2011-04-18 10:24:00 | 53.53283 N, 3.3575 W | RV Prince Madog PD11/11 |
| 1116885 | CTD or STD cast | 2011-04-18 12:39:00 | 53.534 N, 3.36783 W | RV Prince Madog PD11/11 |
| 1116897 | CTD or STD cast | 2011-04-18 13:00:00 | 53.53067 N, 3.359 W | RV Prince Madog PD11/11 |
| 1116904 | CTD or STD cast | 2011-04-18 13:33:00 | 53.53067 N, 3.36 W | RV Prince Madog PD11/11 |
| 1116916 | CTD or STD cast | 2011-04-18 14:01:00 | 53.53067 N, 3.36 W | RV Prince Madog PD11/11 |
| 1116928 | CTD or STD cast | 2011-04-18 14:34:00 | 53.53067 N, 3.36 W | RV Prince Madog PD11/11 |
| 1116941 | CTD or STD cast | 2011-04-18 15:00:00 | 53.53067 N, 3.36 W | RV Prince Madog PD11/11 |
| 1116977 | CTD or STD cast | 2011-04-18 15:34:00 | 53.53083 N, 3.36 W | RV Prince Madog PD11/11 |
| 1116989 | CTD or STD cast | 2011-04-18 16:01:00 | 53.53083 N, 3.35983 W | RV Prince Madog PD11/11 |
| 1116990 | CTD or STD cast | 2011-04-18 16:32:00 | 53.53083 N, 3.35983 W | RV Prince Madog PD11/11 |
| 1117004 | CTD or STD cast | 2011-04-18 17:02:00 | 53.53067 N, 3.35983 W | RV Prince Madog PD11/11 |
| 1117016 | CTD or STD cast | 2011-04-18 17:32:00 | 53.53083 N, 3.35983 W | RV Prince Madog PD11/11 |
| 1117028 | CTD or STD cast | 2011-04-18 18:02:00 | 53.53067 N, 3.35967 W | RV Prince Madog PD11/11 |
| 1117041 | CTD or STD cast | 2011-04-18 18:31:00 | 53.5305 N, 3.35867 W | RV Prince Madog PD11/11 |
| 1117053 | CTD or STD cast | 2011-04-18 19:02:00 | 53.53033 N, 3.35833 W | RV Prince Madog PD11/11 |
| 1117065 | CTD or STD cast | 2011-04-18 19:32:00 | 53.53033 N, 3.35717 W | RV Prince Madog PD11/11 |
| 1117077 | CTD or STD cast | 2011-04-18 20:01:00 | 53.5305 N, 3.3565 W | RV Prince Madog PD11/11 |
| 1117089 | CTD or STD cast | 2011-04-18 21:03:00 | 53.53 N, 3.35667 W | RV Prince Madog PD11/11 |
| 1117090 | CTD or STD cast | 2011-04-18 21:32:00 | 53.53033 N, 3.3565 W | RV Prince Madog PD11/11 |
| 1117108 | CTD or STD cast | 2011-04-18 22:02:00 | 53.53033 N, 3.35667 W | RV Prince Madog PD11/11 |
| 1117121 | CTD or STD cast | 2011-04-18 22:32:00 | 53.5305 N, 3.35667 W | RV Prince Madog PD11/11 |
| 1117133 | CTD or STD cast | 2011-04-18 23:04:00 | 53.53033 N, 3.35683 W | RV Prince Madog PD11/11 |
| 1117145 | CTD or STD cast | 2011-04-18 23:36:00 | 53.5305 N, 3.3575 W | RV Prince Madog PD11/11 |
| 1117201 | CTD or STD cast | 2011-04-19 00:03:00 | 53.53033 N, 3.35783 W | RV Prince Madog PD11/11 |
| 1117213 | CTD or STD cast | 2011-04-19 00:33:00 | 53.53033 N, 3.3585 W | RV Prince Madog PD11/11 |
| 1117225 | CTD or STD cast | 2011-04-19 01:00:00 | 53.53033 N, 3.35883 W | RV Prince Madog PD11/11 |
| 1117237 | CTD or STD cast | 2011-04-19 01:32:00 | 53.53017 N, 3.35917 W | RV Prince Madog PD11/11 |
| 1117249 | CTD or STD cast | 2011-04-19 03:34:00 | 53.53033 N, 3.35983 W | RV Prince Madog PD11/11 |
| 1117250 | CTD or STD cast | 2011-04-19 04:10:00 | 53.53033 N, 3.35983 W | RV Prince Madog PD11/11 |
| 1117262 | CTD or STD cast | 2011-04-19 04:34:00 | 53.5305 N, 3.35983 W | RV Prince Madog PD11/11 |
| 1117274 | CTD or STD cast | 2011-04-19 05:03:00 | 53.53033 N, 3.35983 W | RV Prince Madog PD11/11 |
| 1117286 | CTD or STD cast | 2011-04-19 05:32:00 | 53.53033 N, 3.35983 W | RV Prince Madog PD11/11 |
| 1117298 | CTD or STD cast | 2011-04-19 06:01:00 | 53.53 N, 3.35967 W | RV Prince Madog PD11/11 |
| 1117305 | CTD or STD cast | 2011-04-19 06:32:00 | 53.53017 N, 3.35967 W | RV Prince Madog PD11/11 |
| 1117317 | CTD or STD cast | 2011-04-19 07:02:00 | 53.53 N, 3.3585 W | RV Prince Madog PD11/11 |
| 1117329 | CTD or STD cast | 2011-04-19 07:32:00 | 53.53033 N, 3.358 W | RV Prince Madog PD11/11 |
| 1117330 | CTD or STD cast | 2011-04-19 08:01:00 | 53.5305 N, 3.3575 W | RV Prince Madog PD11/11 |
| 1117342 | CTD or STD cast | 2011-04-19 08:31:00 | 53.53067 N, 3.35683 W | RV Prince Madog PD11/11 |
| 1117354 | CTD or STD cast | 2011-04-19 10:00:00 | 53.5305 N, 3.3565 W | RV Prince Madog PD11/11 |
| 1166568 | Hydrography time series at depth | 2011-04-19 10:00:00 | 53.5342 N, 3.3619 W | RV Prince Madog PD11/11 |
| 1166600 | PAR radiance and irradiance | 2011-04-19 10:00:00 | 53.5342 N, 3.3619 W | RV Prince Madog PD11/11 |
| 1166612 | PAR radiance and irradiance | 2011-04-19 10:00:00 | 53.5342 N, 3.3619 W | RV Prince Madog PD11/11 |
| 1166624 | PAR radiance and irradiance | 2011-04-19 10:00:00 | 53.5342 N, 3.3619 W | RV Prince Madog PD11/11 |
| 1166581 | Transmittance/attenuance, turbidity, or SPM conc. | 2011-04-19 10:00:00 | 53.5342 N, 3.3619 W | RV Prince Madog PD11/11 |
| 1166593 | Water column chemistry | 2011-04-19 10:00:00 | 53.5342 N, 3.3619 W | RV Prince Madog PD11/11 |
| 1166857 | Water column chemistry | 2011-04-19 10:00:00 | 53.5342 N, 3.3619 W | RV Prince Madog PD11/11 |
| 1117366 | CTD or STD cast | 2011-04-19 10:32:00 | 53.5305 N, 3.3565 W | RV Prince Madog PD11/11 |
| 1117378 | CTD or STD cast | 2011-04-19 11:01:00 | 53.5305 N, 3.35667 W | RV Prince Madog PD11/11 |
| 1117391 | CTD or STD cast | 2011-04-19 11:33:00 | 53.53033 N, 3.357 W | RV Prince Madog PD11/11 |
| 1117409 | CTD or STD cast | 2011-04-19 12:03:00 | 53.53017 N, 3.35717 W | RV Prince Madog PD11/11 |
| 1117410 | CTD or STD cast | 2011-04-19 12:34:00 | 53.53033 N, 3.35833 W | RV Prince Madog PD11/11 |
| 1117422 | CTD or STD cast | 2011-04-19 13:04:00 | 53.5305 N, 3.35867 W | RV Prince Madog PD11/11 |
| 1117434 | CTD or STD cast | 2011-04-19 13:32:00 | 53.53067 N, 3.35933 W | RV Prince Madog PD11/11 |
| 1117446 | CTD or STD cast | 2011-04-19 14:00:00 | 53.52983 N, 3.36283 W | RV Prince Madog PD11/11 |
| 1117711 | CTD or STD cast | 2011-04-20 09:21:00 | 53.53583 N, 3.3575 W | RV Prince Madog PD11/11 |
| 1166845 | Water column chemistry | 2011-04-23 00:00:00 | 53.5342 N, 3.3619 W | RV Prince Madog PD11/11 |
| 1118486 | CTD or STD cast | 2011-06-06 08:31:00 | 53.532 N, 3.35767 W | RV Prince Madog PD43/11 |
| 1166636 | Hydrography time series at depth | 2011-06-06 10:00:00 | 53.5175 N, 3.3618 W | RV Prince Madog PD43/11 |
| 1166661 | PAR radiance and irradiance | 2011-06-06 10:00:00 | 53.5175 N, 3.3618 W | RV Prince Madog PD43/11 |
| 1166673 | PAR radiance and irradiance | 2011-06-06 10:00:00 | 53.5175 N, 3.3618 W | RV Prince Madog PD43/11 |
| 1166685 | PAR radiance and irradiance | 2011-06-06 10:00:00 | 53.5175 N, 3.3618 W | RV Prince Madog PD43/11 |
| 1166648 | Transmittance/attenuance, turbidity, or SPM conc. | 2011-06-06 10:00:00 | 53.5175 N, 3.3618 W | RV Prince Madog PD43/11 |
| 1166870 | Water column chemistry | 2011-06-06 10:00:00 | 53.5175 N, 3.3618 W | RV Prince Madog PD43/11 |
| 1118498 | CTD or STD cast | 2011-06-06 10:01:00 | 53.53167 N, 3.35783 W | RV Prince Madog PD43/11 |
| 1118658 | CTD or STD cast | 2011-06-06 22:58:00 | 53.537 N, 3.35817 W | RV Prince Madog PD43/11 |
| 1166869 | Water column chemistry | 2011-06-11 00:00:00 | 53.5175 N, 3.3618 W | RV Prince Madog PD43/11 |
| 1166697 | Hydrography time series at depth | 2011-07-25 19:00:00 | 53.5339 N, 3.3648 W | RV Prince Madog PD21/11 |
| 1166728 | PAR radiance and irradiance | 2011-07-25 19:00:00 | 53.5339 N, 3.3648 W | RV Prince Madog PD21/11 |
| 1166741 | PAR radiance and irradiance | 2011-07-25 19:00:00 | 53.5339 N, 3.3648 W | RV Prince Madog PD21/11 |
| 1166753 | PAR radiance and irradiance | 2011-07-25 19:00:00 | 53.5339 N, 3.3648 W | RV Prince Madog PD21/11 |
| 1166704 | Transmittance/attenuance, turbidity, or SPM conc. | 2011-07-25 19:00:00 | 53.5339 N, 3.3648 W | RV Prince Madog PD21/11 |
| 1166716 | Water column chemistry | 2011-07-25 19:00:00 | 53.5339 N, 3.3648 W | RV Prince Madog PD21/11 |
| 1166894 | Water column chemistry | 2011-07-25 20:00:00 | 53.5339 N, 3.3648 W | RV Prince Madog PD21/11 |
| 1166882 | Transmittance/attenuance, turbidity, or SPM conc. | 2011-08-03 00:00:00 | 53.5339 N, 3.3648 W | RV Prince Madog PD21/11 |
| 1118333 | CTD or STD cast | 2011-09-19 09:06:00 | 53.53117 N, 3.363 W | RV Prince Madog PD25/11 |
| 1352981 | Water sample data | 2011-09-19 09:09:00 | 53.53113 N, 3.36305 W | RV Prince Madog PD25/11 |
| 1118345 | CTD or STD cast | 2011-09-19 11:36:00 | 53.537 N, 3.368 W | RV Prince Madog PD25/11 |
| 1118357 | CTD or STD cast | 2011-09-19 12:48:00 | 53.5315 N, 3.35117 W | RV Prince Madog PD25/11 |
| 1352993 | Water sample data | 2011-09-19 12:50:00 | 53.53158 N, 3.35122 W | RV Prince Madog PD25/11 |
| 1118437 | CTD or STD cast | 2011-09-20 07:48:00 | 53.53433 N, 3.36117 W | RV Prince Madog PD25/11 |
| 1353032 | Water sample data | 2011-09-20 07:52:00 | 53.5343 N, 3.36113 W | RV Prince Madog PD25/11 |
| 1166765 | Hydrography time series at depth | 2012-01-11 10:30:00 | 53.5316 N, 3.3612 W | RV Corystes CO 01/12 |
| 1166789 | PAR radiance and irradiance | 2012-01-11 10:30:00 | 53.5316 N, 3.3612 W | RV Corystes CO 01/12 |
| 1166790 | PAR radiance and irradiance | 2012-01-11 10:30:00 | 53.5316 N, 3.3612 W | RV Corystes CO 01/12 |
| 1166808 | PAR radiance and irradiance | 2012-01-11 10:30:00 | 53.5316 N, 3.3612 W | RV Corystes CO 01/12 |
| 1166777 | Water column chemistry | 2012-01-11 10:30:00 | 53.5316 N, 3.3612 W | RV Corystes CO 01/12 |
| 1623710 | Currents -subsurface Eulerian | 2002-08-07 12:55:00 | 53.53283 N, 3.36733 W | RV Prince Madog PD20/02 |
| 1623802 | Currents -subsurface Eulerian | 2002-09-25 19:15:00 | 53.53317 N, 3.36317 W | RV Prince Madog PD24/02 |
| 1623875 | Currents -subsurface Eulerian | 2002-11-13 14:15:00 | 53.53283 N, 3.36267 W | RV Prince Madog PD31/02 |
| 1623678 | Currents -subsurface Eulerian | 2002-12-12 15:45:00 | 53.534 N, 3.3625 W | RV Prince Madog PD35/02 |
| 1623598 | Currents -subsurface Eulerian | 2003-01-23 16:35:00 | 53.53283 N, 3.36033 W | RV Prince Madog PD02/03 |
| 1623783 | Currents -subsurface Eulerian | 2003-03-06 14:45:00 | 53.53317 N, 3.364 W | RV Prince Madog PD10/03 |
| 1623795 | Currents -subsurface Eulerian | 2003-04-16 13:45:00 | 53.53667 N, 3.37133 W | RV Prince Madog PD17/03 |
| 1623918 | Currents -subsurface Eulerian | 2005-03-03 07:55:00 | 53.53033 N, 3.36533 W | RV Prince Madog PD02/05 |
| 1623212 | Currents -subsurface Eulerian | 2006-05-09 14:30:00 | 53.53283 N, 3.36017 W | RV Prince Madog PD16/06 |
| 1623273 | Currents -subsurface Eulerian | 2006-06-28 10:06:52 | 53.53283 N, 3.361 W | RV Prince Madog PD20/06 |
| 1623304 | Currents -subsurface Eulerian | 2006-07-27 10:24:26 | 53.53283 N, 3.357 W | RV Prince Madog PD22/06 |
| 1623328 | Currents -subsurface Eulerian | 2006-08-15 18:50:00 | 53.53383 N, 3.35883 W | RV Prince Madog PD25/06 |
| 1623365 | Currents -subsurface Eulerian | 2006-09-21 12:00:00 | 53.53383 N, 3.35867 W | RV Prince Madog PD29/06 |
| 1623390 | Currents -subsurface Eulerian | 2006-11-01 14:40:00 | 53.534 N, 3.35783 W | RV Prince Madog PD35/06 |
| 1623408 | Currents -subsurface Eulerian | 2006-12-15 09:10:00 | 53.534 N, 3.35783 W | RV Prince Madog PD37/06 |
| 1623107 | Currents -subsurface Eulerian | 2007-04-16 14:40:00 | 53.5345 N, 3.35967 W | RV Prince Madog PD06/07 |
| 1623120 | Currents -subsurface Eulerian | 2007-05-15 11:40:00 | 53.53417 N, 3.359 W | RV Prince Madog PD09/07 |
| 1623193 | Currents -subsurface Eulerian | 2007-06-20 10:50:00 | 53.53433 N, 3.35467 W | RV Prince Madog PD13/07 |
| 1623236 | Currents -subsurface Eulerian | 2007-07-26 12:00:00 | 53.53517 N, 3.35683 W | RV Prince Madog PD16/07 |
| 1623285 | Currents -subsurface Eulerian | 2007-08-29 13:20:00 | 53.535 N, 3.35733 W | RV Prince Madog PD20/07 |
| 1623353 | Currents -subsurface Eulerian | 2007-11-21 13:20:00 | 53.535 N, 3.35667 W | RV Prince Madog PD27/07 |
| 1623156 | Currents -subsurface Eulerian | 2008-04-16 13:30:05 | 53.53367 N, 3.35683 W | RV Prince Madog PD09/08 |
| 1623605 | Currents -subsurface Eulerian | 2008-07-31 06:05:00 | 53.535 N, 3.35933 W | RV Prince Madog PD23/08 |
| 1623629 | Currents -subsurface Eulerian | 2008-09-10 11:35:00 | 53.53517 N, 3.35933 W | RV Prince Madog PD29/08 |
| 1623887 | Currents -subsurface Eulerian | 2008-10-22 16:35:00 | 53.5345 N, 3.35583 W | RV Prince Madog PD33/08 |
| 1623709 | Currents -subsurface Eulerian | 2008-12-10 16:25:00 | 53.5335 N, 3.3575 W | RV Prince Madog PD37/08 |
| 1623814 | Currents -subsurface Eulerian | 2009-02-05 09:55:02 | 53.53333 N, 3.35783 W | RV Prince Madog PD02/09B |
| 1640749 | Hydrography time series at depth | 2009-04-01 08:20:03 | 53.533 N, 3.35783 W | RV Prince Madog PD12/09 |
| 1623734 | Currents -subsurface Eulerian | 2009-04-01 08:25:00 | 53.533 N, 3.35783 W | RV Prince Madog PD12/09 |
| 1640750 | Hydrography time series at depth | 2009-04-01 08:40:00 | 53.53283 N, 3.36483 W | RV Prince Madog PD12/09 |
| 1640762 | Hydrography time series at depth | 2009-04-01 08:40:00 | 53.53283 N, 3.36483 W | RV Prince Madog PD12/09 |
| 1640701 | Hydrography time series at depth | 2009-04-01 08:40:01 | 53.53283 N, 3.36483 W | RV Prince Madog PD12/09 |
| 1640713 | Hydrography time series at depth | 2009-04-01 08:40:01 | 53.53283 N, 3.36483 W | RV Prince Madog PD12/09 |
| 1640842 | Hydrography time series at depth | 2009-05-12 07:20:03 | 53.5335 N, 3.3575 W | RV Prince Madog PD18/09 |
| 1623943 | Currents -subsurface Eulerian | 2009-05-12 07:25:00 | 53.5335 N, 3.3575 W | RV Prince Madog PD18/09 |
| 1640798 | Hydrography time series at depth | 2009-05-12 08:20:00 | 53.53317 N, 3.3605 W | RV Prince Madog PD18/09 |
| 1640817 | Hydrography time series at depth | 2009-05-12 08:20:00 | 53.53317 N, 3.3605 W | RV Prince Madog PD18/09 |
| 1640854 | Hydrography time series at depth | 2009-05-12 08:20:00 | 53.53317 N, 3.3605 W | RV Prince Madog PD18/09 |
| 1640866 | Hydrography time series at depth | 2009-05-12 08:20:00 | 53.53317 N, 3.3605 W | RV Prince Madog PD18/09 |
| 1640910 | Hydrography time series at depth | 2009-06-17 08:00:03 | 53.53367 N, 3.357 W | RV Prince Madog PD24/09 |
| 1623630 | Currents -subsurface Eulerian | 2009-06-17 08:05:00 | 53.53367 N, 3.357 W | RV Prince Madog PD24/09 |
| 1640934 | Hydrography time series at depth | 2009-06-17 08:30:00 | 53.534 N, 3.3595 W | RV Prince Madog PD24/09 |
| 1640946 | Hydrography time series at depth | 2009-06-17 08:30:00 | 53.534 N, 3.3595 W | RV Prince Madog PD24/09 |
| 1640891 | Hydrography time series at depth | 2009-06-17 08:30:01 | 53.534 N, 3.3595 W | RV Prince Madog PD24/09 |
| 1640909 | Hydrography time series at depth | 2009-06-19 12:00:01 | 53.534 N, 3.3595 W | RV Prince Madog PD24/09 |
| 1624006 | Currents -subsurface Eulerian | 2009-08-03 06:35:01 | 53.53367 N, 3.35667 W | RV Prince Madog PD33/09 |
| 1641009 | Hydrography time series at depth | 2009-08-03 07:00:03 | 53.53367 N, 3.35667 W | RV Prince Madog PD33/09 |
| 1641022 | Hydrography time series at depth | 2009-08-03 07:30:00 | 53.534 N, 3.36367 W | RV Prince Madog PD33/09 |
| 1641034 | Hydrography time series at depth | 2009-08-03 07:30:00 | 53.534 N, 3.36367 W | RV Prince Madog PD33/09 |
| 1640958 | Hydrography time series at depth | 2009-08-03 07:30:01 | 53.534 N, 3.36367 W | RV Prince Madog PD33/09 |
| 1640995 | Hydrography time series at depth | 2009-08-03 07:30:01 | 53.534 N, 3.36367 W | RV Prince Madog PD33/09 |
| 1641114 | Hydrography time series at depth | 2009-09-15 08:50:03 | 53.53333 N, 3.3575 W | RV Prince Madog PD38/09 |
| 1623838 | Currents -subsurface Eulerian | 2009-09-15 08:55:00 | 53.53333 N, 3.3575 W | RV Prince Madog PD38/09 |
| 1641138 | Hydrography time series at depth | 2009-09-15 09:10:00 | 53.53367 N, 3.35967 W | RV Prince Madog PD38/09 |
| 1641151 | Hydrography time series at depth | 2009-09-15 09:10:00 | 53.53367 N, 3.35967 W | RV Prince Madog PD38/09 |
| 1641071 | Hydrography time series at depth | 2009-09-15 09:10:01 | 53.53367 N, 3.35967 W | RV Prince Madog PD38/09 |
| 1641095 | Hydrography time series at depth | 2009-09-15 09:10:01 | 53.53367 N, 3.35967 W | RV Prince Madog PD38/09 |
| 1641231 | Hydrography time series at depth | 2009-12-02 12:50:03 | 53.533 N, 3.358 W | RV Prince Madog PD47/09 |
| 1623899 | Currents -subsurface Eulerian | 2009-12-02 12:55:00 | 53.533 N, 3.358 W | RV Prince Madog PD47/09 |
| 1641255 | Hydrography time series at depth | 2009-12-02 13:10:00 | 53.53417 N, 3.36383 W | RV Prince Madog PD47/09 |
| 1641267 | Hydrography time series at depth | 2009-12-02 13:10:00 | 53.53417 N, 3.36383 W | RV Prince Madog PD47/09 |
| 1641187 | Hydrography time series at depth | 2009-12-02 13:10:01 | 53.53417 N, 3.36383 W | RV Prince Madog PD47/09 |
| 1641206 | Hydrography time series at depth | 2009-12-02 13:10:01 | 53.53417 N, 3.36383 W | RV Prince Madog PD47/09 |
| 1641359 | Hydrography time series at depth | 2010-01-26 09:40:03 | 53.53267 N, 3.358 W | RV Prince Madog PD02/10 |
| 1624147 | Currents -subsurface Eulerian | 2010-01-26 09:45:11 | 53.53267 N, 3.358 W | RV Prince Madog PD02/10 |
| 1641360 | Hydrography time series at depth | 2010-01-26 10:00:00 | 53.53317 N, 3.362 W | RV Prince Madog PD02/10 |
| 1641372 | Hydrography time series at depth | 2010-01-26 10:00:00 | 53.53317 N, 3.362 W | RV Prince Madog PD02/10 |
| 1641292 | Hydrography time series at depth | 2010-01-26 10:00:01 | 53.53317 N, 3.362 W | RV Prince Madog PD02/10 |
| 1641311 | Hydrography time series at depth | 2010-01-26 10:00:01 | 53.53317 N, 3.362 W | RV Prince Madog PD02/10 |
| 1641452 | Hydrography time series at depth | 2010-03-17 13:20:03 | 53.53267 N, 3.35833 W | RV Prince Madog PD05/10 |
| 1624092 | Currents -subsurface Eulerian | 2010-03-17 13:25:00 | 53.53267 N, 3.35833 W | RV Prince Madog PD05/10 |
| 1641464 | Hydrography time series at depth | 2010-03-17 13:30:00 | 53.53233 N, 3.36383 W | RV Prince Madog PD05/10 |
| 1641476 | Hydrography time series at depth | 2010-03-17 13:30:00 | 53.53233 N, 3.36383 W | RV Prince Madog PD05/10 |
| 1641403 | Hydrography time series at depth | 2010-03-17 13:30:01 | 53.53233 N, 3.36383 W | RV Prince Madog PD05/10 |
| 1641427 | Hydrography time series at depth | 2010-03-17 13:30:01 | 53.53233 N, 3.36383 W | RV Prince Madog PD05/10 |
| 1641568 | Hydrography time series at depth | 2010-04-28 11:40:03 | 53.53283 N, 3.35817 W | RV Prince Madog PD10/10 |
| 1624018 | Currents -subsurface Eulerian | 2010-04-28 11:45:00 | 53.53283 N, 3.35817 W | RV Prince Madog PD10/10 |
| 1641581 | Hydrography time series at depth | 2010-04-28 12:30:00 | 53.533 N, 3.36317 W | RV Prince Madog PD10/10 |
| 1641593 | Hydrography time series at depth | 2010-04-28 12:30:00 | 53.533 N, 3.36317 W | RV Prince Madog PD10/10 |
| 1641520 | Hydrography time series at depth | 2010-04-28 12:30:01 | 53.533 N, 3.36317 W | RV Prince Madog PD10/10 |
| 1641544 | Hydrography time series at depth | 2010-04-28 12:30:01 | 53.533 N, 3.36317 W | RV Prince Madog PD10/10 |
| 1624067 | Currents -subsurface Eulerian | 2010-06-09 10:25:09 | 53.53317 N, 3.35867 W | RV Prince Madog PD17/10 |
| 1641624 | Hydrography time series at depth | 2010-06-09 10:30:01 | 53.53433 N, 3.36367 W | RV Prince Madog PD17/10 |
| 1641636 | Hydrography time series at depth | 2010-06-09 10:30:01 | 53.53433 N, 3.36367 W | RV Prince Madog PD17/10 |
| 1641673 | Hydrography time series at depth | 2010-06-09 10:30:03 | 53.53317 N, 3.35867 W | RV Prince Madog PD17/10 |
| 1641697 | Hydrography time series at depth | 2010-06-09 10:40:00 | 53.53433 N, 3.36367 W | RV Prince Madog PD17/10 |
| 1641704 | Hydrography time series at depth | 2010-06-09 10:40:00 | 53.53433 N, 3.36367 W | RV Prince Madog PD17/10 |
| 1641789 | Hydrography time series at depth | 2010-07-07 09:10:03 | 53.533 N, 3.35917 W | RV Prince Madog PD21/10 |
| 1624055 | Currents -subsurface Eulerian | 2010-07-07 09:14:59 | 53.533 N, 3.35917 W | RV Prince Madog PD21/10 |
| 1641808 | Hydrography time series at depth | 2010-07-07 09:50:00 | 53.53517 N, 3.3615 W | RV Prince Madog PD21/10 |
| 1641821 | Hydrography time series at depth | 2010-07-07 09:50:00 | 53.53517 N, 3.3615 W | RV Prince Madog PD21/10 |
| 1641753 | Hydrography time series at depth | 2010-07-07 09:50:01 | 53.53517 N, 3.3615 W | RV Prince Madog PD21/10 |
| 1641765 | Hydrography time series at depth | 2010-07-07 09:50:01 | 53.53517 N, 3.3615 W | RV Prince Madog PD21/10 |
| 1641882 | Hydrography time series at depth | 2010-08-11 07:20:03 | 53.5335 N, 3.358 W | RV Prince Madog PD29/10 |
| 1623979 | Currents -subsurface Eulerian | 2010-08-11 07:25:00 | 53.5335 N, 3.358 W | RV Prince Madog PD29/10 |
| 1641894 | Hydrography time series at depth | 2010-08-11 08:00:00 | 53.53317 N, 3.36133 W | RV Prince Madog PD29/10 |
| 1641901 | Hydrography time series at depth | 2010-08-11 08:00:00 | 53.53317 N, 3.36133 W | RV Prince Madog PD29/10 |
| 1641857 | Hydrography time series at depth | 2010-08-11 08:00:01 | 53.53317 N, 3.36133 W | RV Prince Madog PD29/10 |
| 1641869 | Hydrography time series at depth | 2010-08-11 08:00:01 | 53.53317 N, 3.36133 W | RV Prince Madog PD29/10 |
| 1641950 | Hydrography time series at depth | 2010-09-28 07:30:03 | 53.53367 N, 3.35817 W | RV Prince Madog PD36/10 |
| 1623863 | Currents -subsurface Eulerian | 2010-09-28 07:35:00 | 53.53367 N, 3.35817 W | RV Prince Madog PD36/10 |
| 1641974 | Hydrography time series at depth | 2010-09-28 08:50:00 | 53.5335 N, 3.36367 W | RV Prince Madog PD36/10 |
| 1641986 | Hydrography time series at depth | 2010-09-28 08:50:00 | 53.5335 N, 3.36367 W | RV Prince Madog PD36/10 |
| 1641925 | Hydrography time series at depth | 2010-09-28 08:50:01 | 53.5335 N, 3.36367 W | RV Prince Madog PD36/10 |
| 1641949 | Hydrography time series at depth | 2010-09-28 08:50:01 | 53.5335 N, 3.36367 W | RV Prince Madog PD36/10 |
| 1642050 | Hydrography time series at depth | 2010-12-07 12:30:03 | 53.53417 N, 3.35833 W | RV Prince Madog PD49/10 |
| 1623654 | Currents -subsurface Eulerian | 2010-12-07 12:35:00 | 53.53417 N, 3.35833 W | RV Prince Madog PD49/10 |
| 1642074 | Hydrography time series at depth | 2010-12-07 13:10:00 | 53.53067 N, 3.36167 W | RV Prince Madog PD49/10 |
| 1642086 | Hydrography time series at depth | 2010-12-07 13:10:00 | 53.53067 N, 3.36167 W | RV Prince Madog PD49/10 |
| 1642037 | Hydrography time series at depth | 2010-12-07 13:10:01 | 53.53067 N, 3.36167 W | RV Prince Madog PD49/10 |
| 1642049 | Hydrography time series at depth | 2010-12-07 13:10:01 | 53.53067 N, 3.36167 W | RV Prince Madog PD49/10 |
| 1642166 | Hydrography time series at depth | 2011-01-12 09:10:03 | 53.53433 N, 3.35733 W | RV Prince Madog PD01/11 |
| 1623758 | Currents -subsurface Eulerian | 2011-01-12 09:15:00 | 53.53433 N, 3.35733 W | RV Prince Madog PD01/11 |
| 1642191 | Hydrography time series at depth | 2011-01-12 09:30:00 | 53.53467 N, 3.361 W | RV Prince Madog PD01/11 |
| 1642154 | Hydrography time series at depth | 2011-01-12 09:30:01 | 53.53467 N, 3.361 W | RV Prince Madog PD01/11 |
| 1642129 | Hydrography time series at depth | 2011-01-12 09:30:02 | 53.53467 N, 3.361 W | RV Prince Madog PD01/11 |
| 1642302 | Hydrography time series at depth | 2011-03-16 11:20:00 | 53.53333 N, 3.36233 W | RV Prince Madog PD07/11 |
| 1642314 | Hydrography time series at depth | 2011-03-16 11:20:00 | 53.53333 N, 3.36233 W | RV Prince Madog PD07/11 |
| 1642234 | Hydrography time series at depth | 2011-03-16 11:20:01 | 53.53333 N, 3.36233 W | RV Prince Madog PD07/11 |
| 1642258 | Hydrography time series at depth | 2011-03-16 11:20:01 | 53.53333 N, 3.36233 W | RV Prince Madog PD07/11 |
| 1642283 | Hydrography time series at depth | 2011-03-16 11:20:03 | 53.53367 N, 3.35733 W | RV Prince Madog PD07/11 |
| 1624123 | Currents -subsurface Eulerian | 2011-03-16 12:59:50 | 53.53367 N, 3.35733 W | RV Prince Madog PD07/11 |
| 1623980 | Currents -subsurface Eulerian | 2011-04-18 11:05:00 | 53.53367 N, 3.3575 W | RV Prince Madog PD11/11 |
| 1623722 | Currents -subsurface Eulerian | 2011-06-06 09:15:00 | 53.534 N, 3.35733 W | RV Prince Madog PD43/11 |
| 1623931 | Currents -subsurface Eulerian | 2011-07-25 18:35:00 | 53.53383 N, 3.35283 W | RV Prince Madog PD21/11 |
