Metadata Report for BODC Series Reference Number 2012094
Metadata Summary
Problem Reports
Data Access Policy
Narrative Documents
Project Information
Data Activity or Cruise Information
Fixed Station Information
BODC Quality Flags
SeaDataNet Quality Flags
Metadata Summary
Data Description |
|||||||||||||||||||||||||||||||||||||||||||||||||||||||||||||||||||||||||||||||||||||
|
|||||||||||||||||||||||||||||||||||||||||||||||||||||||||||||||||||||||||||||||||||||
Data Identifiers |
|||||||||||||||||||||||||||||||||||||||||||||||||||||||||||||||||||||||||||||||||||||
|
|||||||||||||||||||||||||||||||||||||||||||||||||||||||||||||||||||||||||||||||||||||
Time Co-ordinates(UT) |
|||||||||||||||||||||||||||||||||||||||||||||||||||||||||||||||||||||||||||||||||||||
|
|||||||||||||||||||||||||||||||||||||||||||||||||||||||||||||||||||||||||||||||||||||
Spatial Co-ordinates | |||||||||||||||||||||||||||||||||||||||||||||||||||||||||||||||||||||||||||||||||||||
|
|||||||||||||||||||||||||||||||||||||||||||||||||||||||||||||||||||||||||||||||||||||
Parameters |
|||||||||||||||||||||||||||||||||||||||||||||||||||||||||||||||||||||||||||||||||||||
|
|||||||||||||||||||||||||||||||||||||||||||||||||||||||||||||||||||||||||||||||||||||
|
|||||||||||||||||||||||||||||||||||||||||||||||||||||||||||||||||||||||||||||||||||||
Problem Reports
No Problem Report Found in the Database
RRS James Cook Cruise JC136 meteorological data quality report
Further to the data processing documentation, data quality issues concerning meteorology data were noted.
All parameters
From 03/06/2016 10:21 to 04/06/2016 05:32 channels ERWSSS01, ERWDSS01, EWSBSS01, EWDASS01,CDTASS01, CRELSS01, CAPHTU01 were affected by spikes followed by prolonged period of unrealistic values until Techsas froze and restart. This was associated with arriving the vessel to Stornway port. These unrealistic values have been set to null.
Data Access Policy
Open Data supplied by Natural Environment Research Council (NERC)
You must always use the following attribution statement to acknowledge the source of the information: "Contains data supplied by Natural Environment Research Council."
Narrative Documents
Gill Instruments Windsonic Anemometer
The Gill Windsonic is a 2-axis ultrasonic wind sensor that monitors wind speed and direction using four transducers. The time taken for an ultrasonic pulse to travel from the North to the South transducers is measured and compared with the time for a pulse to travel from South to North. Travel times between the East and West transducers are similarly compared. The wind speed and direction are calculated from the differences in the times of flight along each axis. This calculation is independent of environmental factors such as temperature.
Specifications
| Ultrasonic output rate | 0.25, 0.5, 1, 2 or 4 Hz |
| Operating Temperature | -35 to 70°C |
| Operating Humidity | < 5 to 100% RH |
| Anemometer start up time | < 5 s |
| Wind speed | |
| Range | 0 to 60 m s-1 |
| Accuracy | ± 2% at 2 m s-1 |
| Resolution | 0.01 m s-1 |
| Response time | 0.25 s |
| Threshold | 0.01 m s-1 |
| Wind direction | |
| Range | 0 to 359° |
| Accuracy | ± 3° at 12 m s-1 |
| Resolution | 1° |
| Response time | 0.25 s |
Further details can be found in the manufacturer's specification sheet.
Kipp and Zonen Pyranometer Model CM6B
The CM6B pyranometer is intended for routine global solar radiation measurement research on a level surface. The CM6B features a sixty-four thermocouple junction (series connected) sensing element. The sensing element is coated with a highly stable carbon based non-organic coating, which delivers excellent spectral absorption and long term stability characteristics. The sensing element is housed under two concentric fitting Schott K5 glass domes.
Specifications
| Dimensions (W x H) | 150.0 mm x 91.5 mm |
|---|---|
| Weight | 850 grams |
| Operating Temperature | -40°C to +80°C |
| Spectral Range | 305 - 2800 nm (50% points) |
| Sensitivity | 9 -15 µV/W/m2 |
| Impedance (nominal) | 70 - 100 ohm |
| Response Time (95%) | 30 sec |
| Non-linearity | < ± 1.2% (<1000 W/m2) |
| Temperature dependence of sensitivity | < ± 2% (-10 to +40°C) |
| Zero-offset due to temperature changes | < ± 4 W/m2 at 5 K/h temperature change |
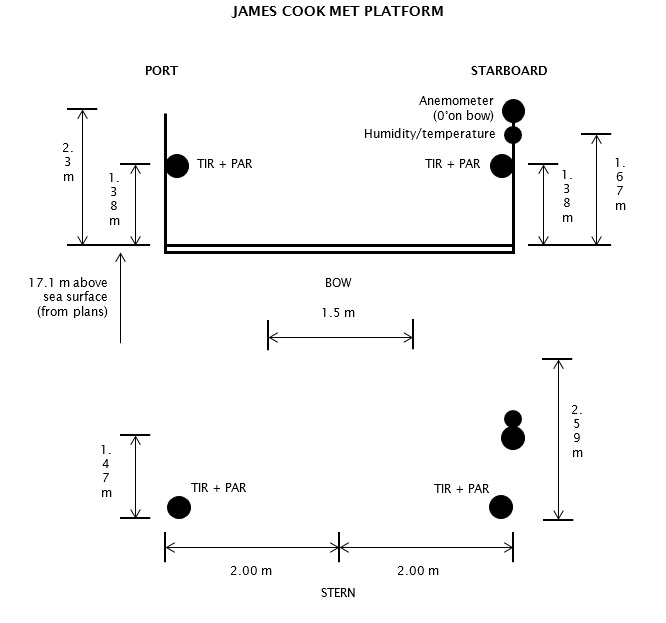
RRS James Cook JC136 cruise meteorology instrumentation
The meteorological suite of sensors was located on the forecastle deck, at approximately 17.1 m above sea level. The anemometer orientation was 0° on the bow.
The following instruments were used for meteorological measurements:
| Manufacturer | Model | Serial number | Last manufacturer's calibration date | Comments |
| Skye | SKE 510 | 28559 | 11/09/2015 | Port |
| Skye | SKE 510 | 28557 | 30/04/2015 | Starboard |
| Kipp and Zonen | CM 6B | 47462 | 01/06/2015 | Port |
| Kipp and Zonen | CM 6B | 47463 | 15/06/2015 | Starboard |
| Gill | Windsonic | 064537 | - | No calibration required |
| Vaisala | HMP45 | B4950010 | 12/08/2015 | No calibration required |
| Vaisala | PTB110 | J0710001 | 12/04/2016 | No calibration required |
 |
Skye Instruments PAR Energy Sensor Model SKE 510
The SKE 510 is suitable for measuring photosynthetically active radiation (PAR) from natural or artificial light sources. The sensor is fully waterproof and guaranteed submersible to 4m depth, and indoor versions are also available.
The instrument uses a blue-enhanced planar diffused silicon detector to measure energy (in W m-2) over the 400-700 nm waveband. It has a cosine-corrected head and a square spectral response. The sensor can operate over a temperature range of -35 to 70 °C and a humidity range of 0-100% RH.
Specifications
| Sensitivity (current) | 1.5µA or 100 W m-2 |
|---|---|
| Sensitivity (voltage) | 1mV or 100 W m-2 |
| Working Range | 0-5000 W m-2 |
| Linearity error | 0.2% |
| Absolute calibration error | typ. less than 3% 5% max |
| Response time - voltage output | 10 ns |
| Cosine error | 3% |
| Azimuth error | less than 1% |
| Temperature co-efficient | ±0.1% per °C |
| Internal resistance - voltage output | c. 300 ohms |
| Longterm stability | ±2% |
| Material | Dupont 'Delrin' |
| Dimensions | 34 mm diameter 38mm height |
| Cable | 2 core screened 7 - 2 - 2C |
| Sensor Passband | 400 - 700 nm |
| Detector | Silicon photocell |
| Filters | Glass type and/or metal interference |
Vaisala PTB110 barometer
An industrial, analog barometer which uses a silicon capacitive sensor (BAROCAP). The sensor produces either frequency or voltage output and is mountable on a (35 mm wide) DIN rail.
Operating ranges (1 hPa = 1 mbar)
| Pressure ranges | 500 ... 1100 hPa 600 ... 1100 hPa 800 ... 1100 hPa 800 ... 1060 hPa 600 ... 1060 hPa |
| Temperature range | -40 ... +60 °C (-40 ... +140 °F) |
| Humidity range | non-condensing |
General
| Output voltage | 0 ... 2.5 VDC 0 ... 5 VDC |
| Output frequency | 500 ... 1100 Hz |
| Resolution | 0.1 hPa |
Accuracy
| Linearity* | ±0.25 hPa |
| Hysteresis* | ±0.03 hPa |
| Repeatability* | ±0.03 hPa |
| Pressure calibration uncertainty** | ±0.15 hPa |
| Accuracy at +20 °C*** | ±0.3 hPa |
| Total accuracy at: | |
| +15 ... +25 °C (+59 ... +77 °F) 0 ... +40 °C (+32 ... +104 °F) -20 ... +45 °C (-4 ... +113 °F) -40 ... +60 °C (-40 ... +140 °F) | ±0.3 hPa ±0.6 hPa ±1.0 hPa ±1.5 hPa |
* Defined as ±2 standard deviation limits of end-point non-linearity, hysteresis error or repeatability error.
** Defined as ±2 standard deviation limits of inaccuracy of the working standard including traceability to NIST.
*** Defined as the root sum of the squares (RSS) of end-point non-linearity, hysteresis error, repeatability error and calibration uncertainty at room temperature when using voltage output.
More detailed information can be found in the manufacturer's data sheet and user's guide.
Vaisala Temperature and Relative Humidity HMP Sensors
A family of sensors and instruments (sensors plus integral displays or loggers) for the measurement of air temperature and relative humidity. All are based on a probe containing a patent (HUMICAP) capacitive thin polymer film capacitanece humidity sensor and a Pt100 platinum resistance thermometer. The probes are available with a wide range of packaging, cabling and interface options all of which have designations of the form HMPnn or HMPnnn such as HMP45 and HMP230. Vaisala sensors are incorporated into weather stations and marketed by Campbell Scientific.
All versions operate at up to 100% humidity. Operating temperature ranges vary between models, allowing users to select the version best suited to their requirements.
Further details can be found in the manufacturer's specification sheets for the HMP 45 series, HMP 70 series and HMP 230 series.
RRS James Cook cruise JC136 meteorology data processing procedures
Originator's Data Processing
The data were logged by the TECHSAS (TECHnical and Scientific sensors Acquisition System) system into daily NetCDF files. The TECHSAS system is used as the main data logging system on NMF-SS operated reserach vessels. The daily TECHSAS NetCDF navigation and bathymetry files provided to BODC were used for BODC processing. Data were additionally logged into the RVS Level-C format files which have been archived at BODC. A portion of the data were then processed daily using the National Oceanography Centre MSTAR data procesing routines (mstar_version_v3).
Files delivered to BODC
| Filename | Content description | Format | Interval | Start date/time (UTC) | End date/time (UTC) | Comments |
| *-*-Light-JC-SM_JC1.SURFMETv2 | Air pressure, photosynthetically active radiation (PAR), total irradiance (TIR) | NetCDF | 1 hz | 13-May-2016 12:52:54 | 22-June-2016 09:46:35 | |
| *-*-MET-JC-SM_JC1.SURFMETv2 | Apparent wind speed and direction, air temperature and humidity | NetCDF | 1 hz | 13-May-2016 12:52:54 | 22-June-2016 09:46:35 |
BODC Data Processing
The data were reformatted to the BODC internal format using standard banking procedures, and averaged at 60 second intervals. The following table shows how variables within the files were mapped to appropriate BODC parameter codes:
*-*-Light-DY-SM_DY1.SURFMETv3
| Originator's variable | Originator's units | Description | BODC Code | BODC Units | Unit conversion | Comments |
| pres | mbar | Air pressure | CAPHTU01 | mbar | N/A | - |
| ppar | Volts*10-5 | PAR (port) | DVLTRPSD | Volts | *0.00001 | - |
| spar | Volts*10-5 | PAR (starboard) | DVLTRSSD | Volts | *0.00001 | - |
| ptir | Volts*10-5 | TIR (port) | CVLTRP01 | Volts | *0.00001 | - |
| stir | Volts*10-5 | TIR (starboard) | CVLTRS01 | Volts | *0.00001 | - |
*-*-MET-DY-SM_DY1.SURFMETv3
| Originator's variable | Originator's units | Description | BODC Code | BODC Units | Unit conversion | Comments |
| humid | % | Relative air humidity | CRELZZ01 | % | N/A | - |
| airtemp | °C | Air temperature | CDTAZZ01 | °C | N/A | - |
| speed | m/s | Apparent wind speed | ERWSSS01 | m/s | N/A | - |
| direct | Degrees | Apparent wind direction | ERWDSS01 | Degrees | N/A | - |
All data expressed at measurement altitude.
Manufacturers Calibrations
PAR/TIRThe following manufacturer's calibrations were applied to the PAR and TIR light sensors using:
y (W m -2 ) = (a x 106 )/b
Where 'a' is the raw data in volts and 'b' is the calibration offset (µV per W m -2 ) as shown below:
| Sensor | Serial no | location | offset (µV per W m-2) |
| PAR | 28559 | port | 10.83 |
| PAR | 28557 | starboard | 10.77 |
| TIR | 47462 | port | 11.87 |
| TIR | 474623 | starboard | 10.62 |
Absolute wind speed and direction
Relative wind speed and direction were corrected to absolute winds using the ship's heading, speed over ground, course over ground and anemometer orientation on the bow in line with the SAMOS method. The link to the SAMOS method can be fine here.
Air pressure
A manufacturer's calibration was not applied to the barometer because there was no significant offset reported on the certified calibration certificate.
Air temperature and humidity
Manufacturer's calibrations were not applied to the temperature and humidity probe because there were no significant offsets reported on the certified calibration certificate.
Project Information
Deep Links: Influence of population connectivity on depth-dependent diversity of deep-sea marine benthic biota
Background
Species populations are connected to each other through both movement of adults (migration) and eggs, larvae and juveniles (dispersal). If populations become isolated from one another (i.e. are no longer connected), then through genetic mutation, drift and natural selection, they may become so different that they evolve into new biological species. Understanding how populations become isolated is critical to understanding the process of speciation. In the marine environment many species do not move as adults (e.g. corals) or move very slowly (sea urchins). This means that for different adult populations to remain connected they rely on dispersal of early life history stages. Most marine species have a larval stage that lives in the plankton for a period of time, moving with the currents, before settling in a new area. It is larval dispersal that keeps distant populations connected. So understanding patterns of larval dispersal is important to understanding connectivity.
In the deep-sea (>200m) the bathyal region of the continental slope has been identified as supporting high species richness and being an area where the rate of origination of new species may also be high. The reasons for this are not clear, but given the importance of connectivity to population isolation and speciation, it follows that the key to understanding patterns of species diversity in this region lies in understanding connectivity. New research has suggested that because the speed of the currents that carry larvae decreases as you go deeper, larvae might not be able to travel as far, leading to a greater tendency for populations at bathyal depths to become isolated over a given distance, and thus increasing the chances of speciation.
This study aims to test this theory by investigating how patterns of connectivity vary with depth. This will be done in 3 ways:
- Using genetic analysis (similar to DNA fingerprinting) to compare how related distant populations are and if they become less closely related as you go deeper
- Using a model of ocean currents to simulate the movement of larvae between sites
- Io look at the range and abundance of species present at distant locations to see if those at shallower depths are more similar to each-other than those at bathyal depths.
Fieldwork
Data were collected on James Cook cruise JC136 between 14th May and 23rd June 2016. During the cruise, 5 sites in the North East Atlantic (Rockall Bank, George Bligh Bank, Anton Dohrn Seamount, Wyville-Thomson Ridge, and Rosemary Bank) were visited undertaking 27 ROV dives, 12 AUV missions, 43 CTD casts, 2 mooring deployments. 3630 biological samples were obtained from sufficient depth and site coverage for molecular analysis for 3 target species.
Participants
- Dr Kerry Howell (Principal Investigator - Parent Grant) University of Plymouth
- Dr Andy Foggo (Co-Investigator) University of Plymouth
- Dr Alex Nimmo-Smith (Co-Investigator) University of Plymouth
- Dr Vasyl Vlasenko (Co-Investigator) University of Plymouth
- Professor Alex Rogers (Principal Investigator - Child Grant) University of Oxford
Funding
This project was funded by Natural Environment Research Council parent and child grants NE/K011855/1 and NE/K013513/1, entitled 'Influence of population connectivity on depth-dependent diversity of deep-sea marine benthic biota', with the former, parent grant led by Dr Kerry Howell, University of Plymouth, and the latter child grant led by Professor Alex Rogers, University of Oxford. The project was also in partnership with the Joint Nature Conservation Committee (JNCC) and the British Geological Survey (BGS). The project was active between 16th November 2015 and 31st December 2019.
Data Activity or Cruise Information
Cruise
| Cruise Name | JC136 |
| Departure Date | 2016-05-14 |
| Arrival Date | 2016-06-23 |
| Principal Scientist(s) | Kerry Howell (University of Plymouth School of Marine Science and Engineering), Michelle L Taylor (University of Oxford Department of Zoology) |
| Ship | RRS James Cook |
Complete Cruise Metadata Report is available here
Fixed Station Information
No Fixed Station Information held for the Series
BODC Quality Control Flags
The following single character qualifying flags may be associated with one or more individual parameters with a data cycle:
| Flag | Description |
|---|---|
| Blank | Unqualified |
| < | Below detection limit |
| > | In excess of quoted value |
| A | Taxonomic flag for affinis (aff.) |
| B | Beginning of CTD Down/Up Cast |
| C | Taxonomic flag for confer (cf.) |
| D | Thermometric depth |
| E | End of CTD Down/Up Cast |
| G | Non-taxonomic biological characteristic uncertainty |
| H | Extrapolated value |
| I | Taxonomic flag for single species (sp.) |
| K | Improbable value - unknown quality control source |
| L | Improbable value - originator's quality control |
| M | Improbable value - BODC quality control |
| N | Null value |
| O | Improbable value - user quality control |
| P | Trace/calm |
| Q | Indeterminate |
| R | Replacement value |
| S | Estimated value |
| T | Interpolated value |
| U | Uncalibrated |
| W | Control value |
| X | Excessive difference |
SeaDataNet Quality Control Flags
The following single character qualifying flags may be associated with one or more individual parameters with a data cycle:
| Flag | Description |
|---|---|
| 0 | no quality control |
| 1 | good value |
| 2 | probably good value |
| 3 | probably bad value |
| 4 | bad value |
| 5 | changed value |
| 6 | value below detection |
| 7 | value in excess |
| 8 | interpolated value |
| 9 | missing value |
| A | value phenomenon uncertain |
| B | nominal value |
| Q | value below limit of quantification |
