Metadata Report for BODC Series Reference Number 2026956
Metadata Summary
Problem Reports
Data Access Policy
Narrative Documents
Project Information
Data Activity or Cruise Information
Fixed Station Information
BODC Quality Flags
SeaDataNet Quality Flags
Metadata Summary
Data Description |
|||||||||||||||||||||||||||||||||||||||||||||||||||||||||||||||||||||||||||||||||||||
|
|||||||||||||||||||||||||||||||||||||||||||||||||||||||||||||||||||||||||||||||||||||
Data Identifiers |
|||||||||||||||||||||||||||||||||||||||||||||||||||||||||||||||||||||||||||||||||||||
|
|||||||||||||||||||||||||||||||||||||||||||||||||||||||||||||||||||||||||||||||||||||
Time Co-ordinates(UT) |
|||||||||||||||||||||||||||||||||||||||||||||||||||||||||||||||||||||||||||||||||||||
|
|||||||||||||||||||||||||||||||||||||||||||||||||||||||||||||||||||||||||||||||||||||
Spatial Co-ordinates | |||||||||||||||||||||||||||||||||||||||||||||||||||||||||||||||||||||||||||||||||||||
|
|||||||||||||||||||||||||||||||||||||||||||||||||||||||||||||||||||||||||||||||||||||
Parameters |
|||||||||||||||||||||||||||||||||||||||||||||||||||||||||||||||||||||||||||||||||||||
|
|||||||||||||||||||||||||||||||||||||||||||||||||||||||||||||||||||||||||||||||||||||
|
|||||||||||||||||||||||||||||||||||||||||||||||||||||||||||||||||||||||||||||||||||||
Problem Reports
Irradiance
The port and starboard TIR channels are offset by more than 5%. This is most likely due to sensor drift as the port TIR channel sensor was calibrated 15 months prior to the cruise whereas the starboard TIR sensor was calibrated 5 months prior. All the data within the CSLRRP01 channel has been flagged as suspect and should be used with caution.
Irradiance
The port and starboard TIR channels are offset by more than 5%. This is most likely due to sensor drift as the port TIR sensor was calibrated 15 months prior to the cruise whereas the starboard TIR sensor was calibrated 5 months prior. All the data within the CVLTRP01 channel has been flagged as suspect and should be used with caution.
RRS James Cook JC109 Meteorology Quality Control Report
Wind sensors
Wind speed channel looks quite good overall. Some occurrences of wind shielding and artificial acceleration have been flagged but cycles show a good level of consistency throughout. Additionally, absent data and unrealistic data value flags were automatically applied to some data points where infrequent spiking (possibly due to sensor malfunction) and drop outs have occurred.
Light sensors
All PAR and TIR channels display negative readings at times during night time and were flagged accordingly. Offsets between the port and starboard TIR & PAR pairs suggest shading during the day and were also flagged. Both PAR and TIR Sensors exhibited significant spiking at approximately the same times towards the end of the series. This spiking is consistent with the aforementioned spiking recorded in the wind channels. These were flagged accordingly.
Air temperature, relative humidity and atmospheric pressure
Overall the Temperature, Pressure and Humidity readings are within their expected ranges. There appears to be three short (< 4 cycles) a sensor malfunction inside all three channels. These we automatically flagged. Otherwise, there are no signs of discontinuity or stuck values.
Data Access Policy
Open Data supplied by Natural Environment Research Council (NERC)
You must always use the following attribution statement to acknowledge the source of the information: "Contains data supplied by Natural Environment Research Council."
Narrative Documents
Gill Instruments Windsonic Anemometer
The Gill Windsonic is a 2-axis ultrasonic wind sensor that monitors wind speed and direction using four transducers. The time taken for an ultrasonic pulse to travel from the North to the South transducers is measured and compared with the time for a pulse to travel from South to North. Travel times between the East and West transducers are similarly compared. The wind speed and direction are calculated from the differences in the times of flight along each axis. This calculation is independent of environmental factors such as temperature.
Specifications
| Ultrasonic output rate | 0.25, 0.5, 1, 2 or 4 Hz |
| Operating Temperature | -35 to 70°C |
| Operating Humidity | < 5 to 100% RH |
| Anemometer start up time | < 5 s |
| Wind speed | |
| Range | 0 to 60 m s-1 |
| Accuracy | ± 2% at 2 m s-1 |
| Resolution | 0.01 m s-1 |
| Response time | 0.25 s |
| Threshold | 0.01 m s-1 |
| Wind direction | |
| Range | 0 to 359° |
| Accuracy | ± 3° at 12 m s-1 |
| Resolution | 1° |
| Response time | 0.25 s |
Further details can be found in the manufacturer's specification sheet.
Kipp and Zonen Pyranometer Model CM6B
The CM6B pyranometer is intended for routine global solar radiation measurement research on a level surface. The CM6B features a sixty-four thermocouple junction (series connected) sensing element. The sensing element is coated with a highly stable carbon based non-organic coating, which delivers excellent spectral absorption and long term stability characteristics. The sensing element is housed under two concentric fitting Schott K5 glass domes.
Specifications
| Dimensions (W x H) | 150.0 mm x 91.5 mm |
|---|---|
| Weight | 850 grams |
| Operating Temperature | -40°C to +80°C |
| Spectral Range | 305 - 2800 nm (50% points) |
| Sensitivity | 9 -15 µV/W/m2 |
| Impedance (nominal) | 70 - 100 ohm |
| Response Time (95%) | 30 sec |
| Non-linearity | < ± 1.2% (<1000 W/m2) |
| Temperature dependence of sensitivity | < ± 2% (-10 to +40°C) |
| Zero-offset due to temperature changes | < ± 4 W/m2 at 5 K/h temperature change |
Skye Instruments PAR Energy Sensor Model SKE 510
The SKE 510 is suitable for measuring photosynthetically active radiation (PAR) from natural or artificial light sources. The sensor is fully waterproof and guaranteed submersible to 4m depth, and indoor versions are also available.
The instrument uses a blue-enhanced planar diffused silicon detector to measure energy (in W m-2) over the 400-700 nm waveband. It has a cosine-corrected head and a square spectral response. The sensor can operate over a temperature range of -35 to 70 °C and a humidity range of 0-100% RH.
Specifications
| Sensitivity (current) | 1.5µA or 100 W m-2 |
|---|---|
| Sensitivity (voltage) | 1mV or 100 W m-2 |
| Working Range | 0-5000 W m-2 |
| Linearity error | 0.2% |
| Absolute calibration error | typ. less than 3% 5% max |
| Response time - voltage output | 10 ns |
| Cosine error | 3% |
| Azimuth error | less than 1% |
| Temperature co-efficient | ±0.1% per °C |
| Internal resistance - voltage output | c. 300 ohms |
| Longterm stability | ±2% |
| Material | Dupont 'Delrin' |
| Dimensions | 34 mm diameter 38mm height |
| Cable | 2 core screened 7 - 2 - 2C |
| Sensor Passband | 400 - 700 nm |
| Detector | Silicon photocell |
| Filters | Glass type and/or metal interference |
Vaisala Analog Barometers Models PTB100 (A), (B) and PTB101 (B), (C)
The PTB 100 series analog barometers are designed both for accurate barometric measurements at room temperature and for general environmental pressure monitoring over a wide temperature range. The long-term stability of the barometer minimizes the need for field adjustment in many applications.
Physical Specifications
| Size | 97 x 60 x 22 mm |
|---|---|
| Weight | 85g |
The barometers use the BAROCAP* silicon capacitive absolute pressure sensor developed by Vaisala for barometric pressure measurements. The BAROCAP* sensor combines the elasticity characteristics and mechanical stability of a single-crystal silicon with the proven capacitive detection principle.
Sensor Specifications
| Model Number | Pressure Range (mbar) | Temperature Range (°C) | Humidity Range | Total Accuracy | |
|---|---|---|---|---|---|
| PTB100A | 800 to 1060 | -40 to +60 | non-condensing | +20 °C | ± 0.3 mbar |
| 0 to +40 °C | ± 1.0 mbar | ||||
| -20 to +45 °C | ± 1.5 mbar | ||||
| -40 to +60 °C | ± 2.5 mbar | ||||
| PTB100B | 600 to 1060 | -40 to +60 | non-condensing | +20 °C | ± 0.5 mbar |
| 0 to +40 °C | ± 1.5 mbar | ||||
| -20 to +45 °C | ± 2.0 mbar | ||||
| -40 to +60 °C | ± 3.0 mbar | ||||
| PTB101B | 600 to 1060 | -40 to +60 | non-condensing | +20 °C | ± 0.5 mbar |
| 0 to +40 °C | ± 1.5 mbar | ||||
| -20 to +45 °C | ± 2.0 mbar | ||||
| -40 to +60 °C | ± 3.0 mbar | ||||
| PTB101C | 900 to 1100 | -40 to +60 | non-condensing | +20 °C | ± 0.3 mbar |
| 0 to +40 °C | ± 1.0 mbar | ||||
| -20 to +45 °C | ± 1.5 mbar | ||||
| -40 to +60 °C | ± 2.5 mbar | ||||
* BAROCAP is a registered trademark of Vaisala
Vaisala Temperature and Relative Humidity HMP Sensors
A family of sensors and instruments (sensors plus integral displays or loggers) for the measurement of air temperature and relative humidity. All are based on a probe containing a patent (HUMICAP) capacitive thin polymer film capacitanece humidity sensor and a Pt100 platinum resistance thermometer. The probes are available with a wide range of packaging, cabling and interface options all of which have designations of the form HMPnn or HMPnnn such as HMP45 and HMP230. Vaisala sensors are incorporated into weather stations and marketed by Campbell Scientific.
All versions operate at up to 100% humidity. Operating temperature ranges vary between models, allowing users to select the version best suited to their requirements.
Further details can be found in the manufacturer's specification sheets for the HMP 45 series, HMP 70 series and HMP 230 series.
RRS James Cook JC109 Meteorology Data Processing Procedures
Originator's Data Processing
The data were logged by the TECHSAS (TECHnical and Scientific sensors Acquisition System) data logging system into daily NetCDF files which were provided to BODC for processing. Data was additionally logged into the RVS Level-C format which have been archived at BODC.
Files delivered to BODC
| Filename | Content description | Format | Interval | Start date/time (UTC) | End date/time (UTC) | Comments |
| yyyymmdd-000000-MET-JC-SM_JC1.SURFMETv2 | Air temperature, humidity, relative wind speed, relative wind direction | NetCDF | 1 sec. | 14-Oct-2014 17:37:00 | 05-Nov-2014 21:17:00 | |
| yyyymmdd-000000-Light-JC-SM_JC1.SURFMETv2 | Air pressure, PAR, TIR | NetCDF | 1 sec. | 14-Oct-2014 17:37:00 | 05-Nov-2014 21:17:00 |
BODC Data Processing
The data were reformatted to BODC internal format using standard banking procedures. Data were averaged at 60 second intervals. The following table shows how variables within the file were mapped to appropriate BODC parameter codes:
yyyymmdd-000000-MET-SURFMET.SURFMETv2
| Originator's variable | Originator's units | Description | BODC Code | BODC Units | Unit conversion | Comments |
| direct | degrees | Apparent wind direction | ERWDSS01 | degrees | none | |
| speed | m/s | Apparent wind speed | ERWSSS01 | m/s | none | |
| airtemp | degree celsius | Air temperature | CDTAZZ01 | degrees celsius | none | |
| humid | % | Relative air humidity | CRELZZ01 | % | none | |
| time | days since 1899-12-30 00:00:00 UTC | Acquisition time | Not transferred |
yyyymmdd-000000-Light-SURFMET.SURFMETv2
| Originator's variable | Originator's units | Description | BODC Code | BODC Units | Unit conversion | Comments |
| ptir | Volt x 105 | Port total irradiance | CVLTRP01 | Volts | /100000 | |
| stir | Volt x 105 | Starboard total irradiance | CVLTRS01 | Volts | /100000 | |
| ppar | Volt x 105 | Port side PAR sensor | DVLTRPSD | Volts | /100000 | |
| spar | Volt x 105 | Port side starboard sensor | DVLTRSSD | Volts | /100000 | |
| pres | hectopascal | Atmospheric pressure | CAPHTU01 | millibar | none | |
| time | days since 1899-12-30 00:00:00 UTC | Acquisition time | Not transferred |
All data expressed at measurement altitude.
Calibrations
Field Calibrations
No field calibrations were applied to the data at BODC.
Manufacturers Calibrations
PAR/TIR
The following manufacturer's calibrations were applied to the PAR and TIR light sensors using:
y (W m -2 ) = (a x 10 6 )/b
where 'a' is the raw data in volts and 'b' is the calibration offset (µV per W m -2 ) as shown below.
| Sensor | Serial no | location | offset (µV per W m -2) |
| PAR | 28562 | Port | 10.61 |
| PAR | 28560 | Starboard | 10.07 |
| TIR | 994135 | Port | 11.86 |
| TIR | 994133 | Starboard | 9.68 |
All the reformatted data were visualised using the in-house EDSERPLO software. Suspect data were marked by adding an appropriate quality control flag.
Absolute wind speed and direction
Relative wind speed and direction were corrected for the ship's heading and speed using the POS MV gyro heading, ship velocities (calculated at BODC from the main positional channels) and an anemometer orientation of 0° on the bow, thus obtaining the BODC derived absolute wind speed and direction parameters, with codes EWSBSS01 and ERWDSS01 respectively.
Air pressure
A manufacturer's calibration was not applied to the barometer because there was no significant offset reported on the certified calibration certificate.
Air temperature and humidity
Manufacturer's calibrations were not applied to the temperature and humidity probe because there were no significant offsets reported on the certified calibration certificate.
RRS James Cook JC109 Meteorology Instrumentation
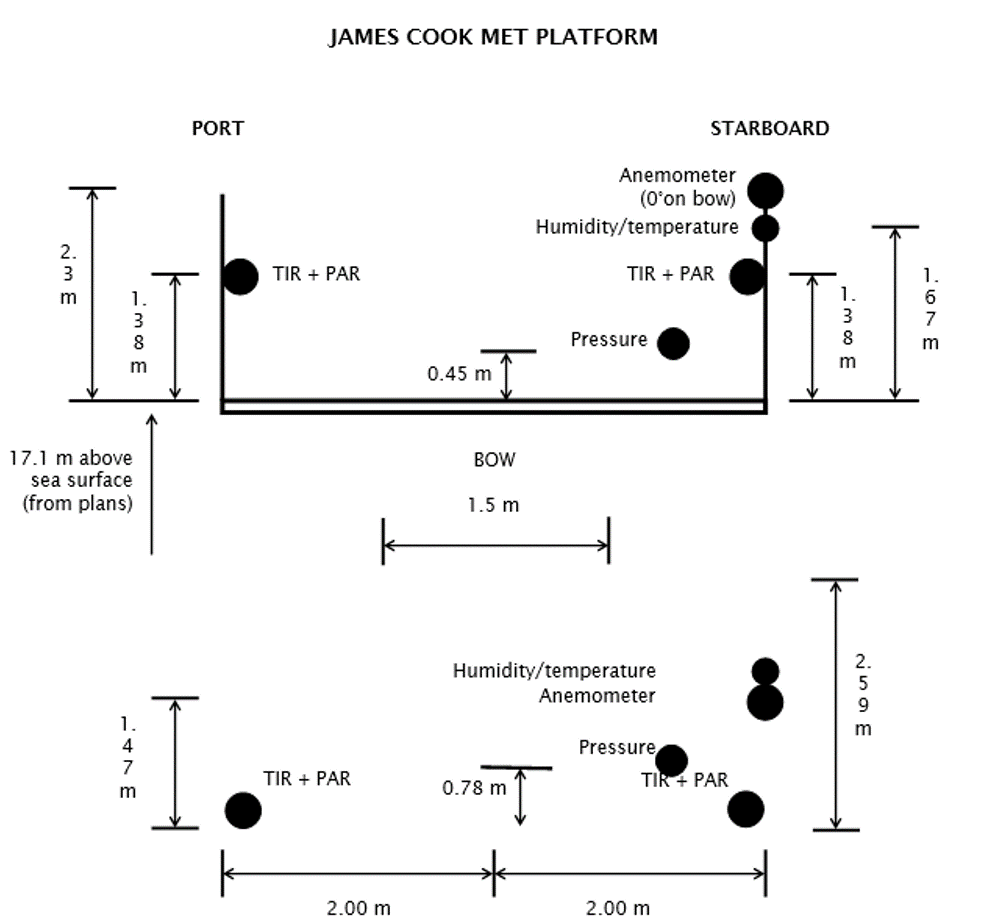
Instrumentation
The meteorological suite of sensors was located on the forecastle deck, at approximately 17.1 m above sea level. The anemometer orientation was 0° on the bow.
| Manufacturer | Model | Serial number | Last manufacturer's calibration date | Comments |
| Skye | SKE 510 | 28562 | 02/04/2014 | Port |
| Skye | SKE 510 | 28560 | 04/07/2013 | Starboard |
| Kipp and Zonen | CM6B | 994135 | 03/07/2013 | Port |
| Kipp and Zonen | CM6B | 994133 | 23/07/2014 | Starboard |
| Gill | Windsonic | 064537 | N/A | No calibration required |
| Vaisala | Humidity and Temperature Probe HMP 45 | E1055002 | 21/05/2014 | No calibration required |
| Vaisala | PTB110 Barometer Air pres | J0710002 | 03/03/2014 | No calibration required |
Project Information
Role and extent of detachment faulting at slow-spreading mid-ocean ridges
This is a 6 year project that aims to determine (1) the sub-surface geometry and extent of the detachments beneath the ridge axis, (2) the amount and detailed distribution of magmatic crust, and (3) the asymmetry of spreading rates associated with oceanic core complexes and the volcanic seafloor.
The research aims to make an improvement in our overall understanding of the nature and geometry of ocean detachments.
This project was funded by Natural Environment Research Council parent and child grants NE/J022551/1, NE/J02029X/1, and NE/J021741/1 led by Professor Tim Reston at the University of Birmingham, Professor Christine Pierce at Durham University, and Professor Chris MacLeod at Cardiff Univserity respectively. The project is funded from April 2013 to August 2020.
Data Activity or Cruise Information
Cruise
| Cruise Name | JC109 |
| Departure Date | 2014-10-11 |
| Arrival Date | 2014-11-05 |
| Principal Scientist(s) | Christine Peirce (University of Durham, Department of Earth Sciences) |
| Ship | RRS James Cook |
Complete Cruise Metadata Report is available here
Fixed Station Information
No Fixed Station Information held for the Series
BODC Quality Control Flags
The following single character qualifying flags may be associated with one or more individual parameters with a data cycle:
| Flag | Description |
|---|---|
| Blank | Unqualified |
| < | Below detection limit |
| > | In excess of quoted value |
| A | Taxonomic flag for affinis (aff.) |
| B | Beginning of CTD Down/Up Cast |
| C | Taxonomic flag for confer (cf.) |
| D | Thermometric depth |
| E | End of CTD Down/Up Cast |
| G | Non-taxonomic biological characteristic uncertainty |
| H | Extrapolated value |
| I | Taxonomic flag for single species (sp.) |
| K | Improbable value - unknown quality control source |
| L | Improbable value - originator's quality control |
| M | Improbable value - BODC quality control |
| N | Null value |
| O | Improbable value - user quality control |
| P | Trace/calm |
| Q | Indeterminate |
| R | Replacement value |
| S | Estimated value |
| T | Interpolated value |
| U | Uncalibrated |
| W | Control value |
| X | Excessive difference |
SeaDataNet Quality Control Flags
The following single character qualifying flags may be associated with one or more individual parameters with a data cycle:
| Flag | Description |
|---|---|
| 0 | no quality control |
| 1 | good value |
| 2 | probably good value |
| 3 | probably bad value |
| 4 | bad value |
| 5 | changed value |
| 6 | value below detection |
| 7 | value in excess |
| 8 | interpolated value |
| 9 | missing value |
| A | value phenomenon uncertain |
| B | nominal value |
| Q | value below limit of quantification |
