Metadata Report for BODC Series Reference Number 2047137
Metadata Summary
Problem Reports
Data Access Policy
Narrative Documents
Project Information
Data Activity or Cruise Information
Fixed Station Information
BODC Quality Flags
SeaDataNet Quality Flags
Metadata Summary
Data Description |
|||||||||||||||||||||||||||||||||||||||||||||||||||||||||||||||||||||||||||||||||||||
|
|||||||||||||||||||||||||||||||||||||||||||||||||||||||||||||||||||||||||||||||||||||
Data Identifiers |
|||||||||||||||||||||||||||||||||||||||||||||||||||||||||||||||||||||||||||||||||||||
|
|||||||||||||||||||||||||||||||||||||||||||||||||||||||||||||||||||||||||||||||||||||
Time Co-ordinates(UT) |
|||||||||||||||||||||||||||||||||||||||||||||||||||||||||||||||||||||||||||||||||||||
|
|||||||||||||||||||||||||||||||||||||||||||||||||||||||||||||||||||||||||||||||||||||
Spatial Co-ordinates | |||||||||||||||||||||||||||||||||||||||||||||||||||||||||||||||||||||||||||||||||||||
|
|||||||||||||||||||||||||||||||||||||||||||||||||||||||||||||||||||||||||||||||||||||
Parameters |
|||||||||||||||||||||||||||||||||||||||||||||||||||||||||||||||||||||||||||||||||||||
|
|||||||||||||||||||||||||||||||||||||||||||||||||||||||||||||||||||||||||||||||||||||
|
|||||||||||||||||||||||||||||||||||||||||||||||||||||||||||||||||||||||||||||||||||||
Problem Reports
TIR
The port and starboard TIR channels are offset by approximately 48% and this exceeds the 2.5% instrumental uncertainty specified in the sensor calibration certificates. This is most likely due to sensor drift as the port TIR channel sensor was calibrated 15 months prior to the cruise where as the starboard TIR sensor was calibrated 5 months prior. All the data within the CSLRRP01 channel has been flagged as suspect and should be used with caution (BODC assessment).
JC112 Meteorology Quality Control Report
Wind
The true wind speed (EWSBSS01) channel is of moderate quality with approximately 40% of the data flagged. The flags were applied to multiple instances of wind shielding, artificial acceleration and spiking throughout the series.
Air temperature, relative humidity and atmospheric pressure
Outside of the flagged instances where the ship's meteorology suite was being shielded by the ship's super structure, the air temperature (CDTAZZ01) and air humidity (CRELZZ01) channels are of good quality and no additional flags have been applied. In addition, the atmospheric pressure (CAPHTU01) is of very good quality and no flags have been applied to any of its cycles.
Data Access Policy
Open Data supplied by Natural Environment Research Council (NERC)
You must always use the following attribution statement to acknowledge the source of the information: "Contains data supplied by Natural Environment Research Council."
Narrative Documents
JC112 Underway Document
Cruise Details
| Cruise Details | 5th Dec 2014 - 16th Jan 2015 (UTC) |
| Principal Scientific Officer | Miguel Angel Morales Maqueda (National Oceanography Centre, Liverpool) |
Gill Instruments Windsonic Anemometer
The Gill Windsonic is a 2-axis ultrasonic wind sensor that monitors wind speed and direction using four transducers. The time taken for an ultrasonic pulse to travel from the North to the South transducers is measured and compared with the time for a pulse to travel from South to North. Travel times between the East and West transducers are similarly compared. The wind speed and direction are calculated from the differences in the times of flight along each axis. This calculation is independent of environmental factors such as temperature.
Specifications
| Ultrasonic output rate | 0.25, 0.5, 1, 2 or 4 Hz |
| Operating Temperature | -35 to 70°C |
| Operating Humidity | < 5 to 100% RH |
| Anemometer start up time | < 5 s |
| Wind speed | |
| Range | 0 to 60 m s-1 |
| Accuracy | ± 2% at 2 m s-1 |
| Resolution | 0.01 m s-1 |
| Response time | 0.25 s |
| Threshold | 0.01 m s-1 |
| Wind direction | |
| Range | 0 to 359° |
| Accuracy | ± 3° at 12 m s-1 |
| Resolution | 1° |
| Response time | 0.25 s |
Further details can be found in the manufacturer's specification sheet.
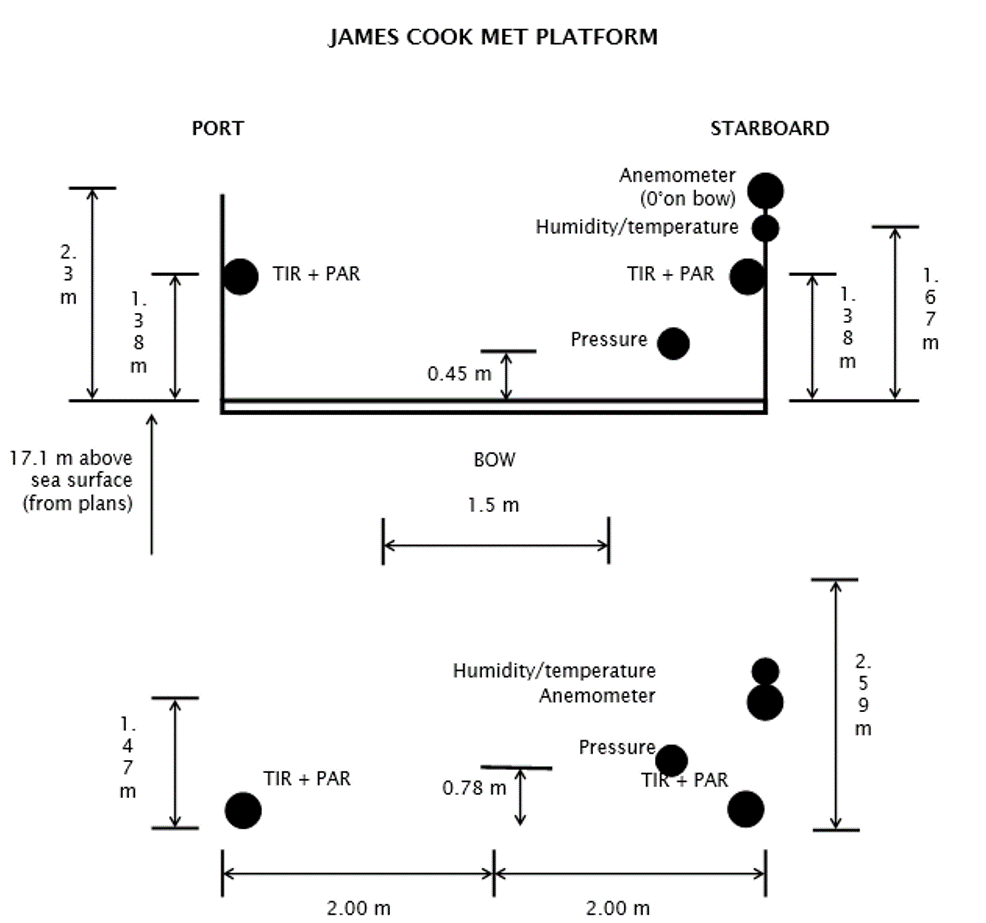
JC112 Meteorology Instrumentation
Instrumentation
The meteorological suite of sensors was located on the forecastle deck, at approximately 17.1 m above sea level. The anemometer orientation was 0° on the bow.
| Manufacturer | Model | Serial number | Last manufacturer's calibration date | Comments |
| Skye | SKE 510 | 28562 | 02/04/2014 | Port |
| Skye | SKE 510 | 28560 | 04/07/2013 | Starboard |
| Kipp and Zonen | CM6B | 994135 | 03/07/2013 | Port |
| Kipp and Zonen | CM6B | 994133 | 23/07/2014 | Starboard |
| Gill | Windsonic | 064537 | N/A | No calibration required |
| Vaisala | Humidity and Temperature Probe HMP 45 | E1055002 | 21/05/2014 | No calibration required |
| Vaisala | PTB110 Barometer Air pres | J0710002 | 03/03/2014 | No calibration required |
Kipp and Zonen Pyranometer Model CM6B
The CM6B pyranometer is intended for routine global solar radiation measurement research on a level surface. The CM6B features a sixty-four thermocouple junction (series connected) sensing element. The sensing element is coated with a highly stable carbon based non-organic coating, which delivers excellent spectral absorption and long term stability characteristics. The sensing element is housed under two concentric fitting Schott K5 glass domes.
Specifications
| Dimensions (W x H) | 150.0 mm x 91.5 mm |
|---|---|
| Weight | 850 grams |
| Operating Temperature | -40°C to +80°C |
| Spectral Range | 305 - 2800 nm (50% points) |
| Sensitivity | 9 -15 µV/W/m2 |
| Impedance (nominal) | 70 - 100 ohm |
| Response Time (95%) | 30 sec |
| Non-linearity | < ± 1.2% (<1000 W/m2) |
| Temperature dependence of sensitivity | < ± 2% (-10 to +40°C) |
| Zero-offset due to temperature changes | < ± 4 W/m2 at 5 K/h temperature change |
Skye Instruments PAR Energy Sensor Model SKE 510
The SKE 510 is suitable for measuring photosynthetically active radiation (PAR) from natural or artificial light sources. The sensor is fully waterproof and guaranteed submersible to 4m depth, and indoor versions are also available.
The instrument uses a blue-enhanced planar diffused silicon detector to measure energy (in W m-2) over the 400-700 nm waveband. It has a cosine-corrected head and a square spectral response. The sensor can operate over a temperature range of -35 to 70 °C and a humidity range of 0-100% RH.
Specifications
| Sensitivity (current) | 1.5µA or 100 W m-2 |
|---|---|
| Sensitivity (voltage) | 1mV or 100 W m-2 |
| Working Range | 0-5000 W m-2 |
| Linearity error | 0.2% |
| Absolute calibration error | typ. less than 3% 5% max |
| Response time - voltage output | 10 ns |
| Cosine error | 3% |
| Azimuth error | less than 1% |
| Temperature co-efficient | ±0.1% per °C |
| Internal resistance - voltage output | c. 300 ohms |
| Longterm stability | ±2% |
| Material | Dupont 'Delrin' |
| Dimensions | 34 mm diameter 38mm height |
| Cable | 2 core screened 7 - 2 - 2C |
| Sensor Passband | 400 - 700 nm |
| Detector | Silicon photocell |
| Filters | Glass type and/or metal interference |
Vaisala Analog Barometers Models PTB100 (A), (B) and PTB101 (B), (C)
The PTB 100 series analog barometers are designed both for accurate barometric measurements at room temperature and for general environmental pressure monitoring over a wide temperature range. The long-term stability of the barometer minimizes the need for field adjustment in many applications.
Physical Specifications
| Size | 97 x 60 x 22 mm |
|---|---|
| Weight | 85g |
The barometers use the BAROCAP* silicon capacitive absolute pressure sensor developed by Vaisala for barometric pressure measurements. The BAROCAP* sensor combines the elasticity characteristics and mechanical stability of a single-crystal silicon with the proven capacitive detection principle.
Sensor Specifications
| Model Number | Pressure Range (mbar) | Temperature Range (°C) | Humidity Range | Total Accuracy | |
|---|---|---|---|---|---|
| PTB100A | 800 to 1060 | -40 to +60 | non-condensing | +20 °C | ± 0.3 mbar |
| 0 to +40 °C | ± 1.0 mbar | ||||
| -20 to +45 °C | ± 1.5 mbar | ||||
| -40 to +60 °C | ± 2.5 mbar | ||||
| PTB100B | 600 to 1060 | -40 to +60 | non-condensing | +20 °C | ± 0.5 mbar |
| 0 to +40 °C | ± 1.5 mbar | ||||
| -20 to +45 °C | ± 2.0 mbar | ||||
| -40 to +60 °C | ± 3.0 mbar | ||||
| PTB101B | 600 to 1060 | -40 to +60 | non-condensing | +20 °C | ± 0.5 mbar |
| 0 to +40 °C | ± 1.5 mbar | ||||
| -20 to +45 °C | ± 2.0 mbar | ||||
| -40 to +60 °C | ± 3.0 mbar | ||||
| PTB101C | 900 to 1100 | -40 to +60 | non-condensing | +20 °C | ± 0.3 mbar |
| 0 to +40 °C | ± 1.0 mbar | ||||
| -20 to +45 °C | ± 1.5 mbar | ||||
| -40 to +60 °C | ± 2.5 mbar | ||||
* BAROCAP is a registered trademark of Vaisala
Vaisala Temperature and Relative Humidity HMP Sensors
A family of sensors and instruments (sensors plus integral displays or loggers) for the measurement of air temperature and relative humidity. All are based on a probe containing a patent (HUMICAP) capacitive thin polymer film capacitanece humidity sensor and a Pt100 platinum resistance thermometer. The probes are available with a wide range of packaging, cabling and interface options all of which have designations of the form HMPnn or HMPnnn such as HMP45 and HMP230. Vaisala sensors are incorporated into weather stations and marketed by Campbell Scientific.
All versions operate at up to 100% humidity. Operating temperature ranges vary between models, allowing users to select the version best suited to their requirements.
Further details can be found in the manufacturer's specification sheets for the HMP 45 series, HMP 70 series and HMP 230 series.
JC112 Meteorology Data Processing Procedures
Originator's Data Processing
The data were logged by the TECHSAS (TECHnical and Scientific sensors Acquisition System) data logging system into daily NetCDF files which were provided to BODC for processing. Data was additionally logged into the RVS Level-C format which have been archived at BODC.
Files delivered to BODC
| Filename | Content description | Format | Interval | Start date/time (UTC) | End date/time (UTC) | Comments |
| yyyymmdd-000000-MET-JC-SM_JC1.SURFMETv2 | Air temperature, humidity, relative wind speed, relative wind direction | NetCDF | 1 sec. | 27-Nov-2014 13:47:24 | 16-Jan-2015 00:37:00 | |
| yyyymmdd-000000-Light-JC-SM_JC1.SURFMETv2 | Air pressure, PAR, TIR | NetCDF | 1 sec. | 27-Nov-2014 13:47:24 | 16-Jan-2015 00:37:00 |
BODC Data Processing
The data were reformatted to BODC internal format using standard banking procedures. Data were averaged at 60 second intervals. The following table shows how variables within the file were mapped to appropriate BODC parameter codes:
yyyymmdd-000000-MET-SURFMET.SURFMETv2
| Originator's variable | Originator's units | Description | BODC Code | BODC Units | Unit conversion | Comments |
| direct | degrees | Apparent wind direction | ERWDSS01 | degrees | none | |
| speed | m/s | Apparent wind speed | ERWSSS01 | m/s | none | |
| airtemp | degree celsius | Air temperature | CDTAZZ01 | degrees celsius | none | |
| humid | % | Relative air humidity | CRELZZ01 | % | none | |
| time | days since 1899-12-30 00:00:00 UTC | Acquisition time | Not transferred |
yyyymmdd-000000-Light-SURFMET.SURFMETv2
| Originator's variable | Originator's units | Description | BODC Code | BODC Units | Unit conversion | Comments |
| ptir | Volt x 105 | Port total irradiance | CVLTRP01 | Volts | /100000 | |
| stir | Volt x 105 | Starboard total irradiance | CVLTRS01 | Volts | /100000 | |
| ppar | Volt x 105 | Port side PAR sensor | DVLTRPSD | Volts | /100000 | |
| spar | Volt x 105 | Port side starboard sensor | DVLTRSSD | Volts | /100000 | |
| pres | hectopascal | Atmospheric pressure | CAPHTU01 | millibar | none | |
| time | days since 1899-12-30 00:00:00 UTC | Acquisition time | Not transferred |
All data expressed at measurement altitude.
Calibrations
Field Calibrations
No field calibrations were applied to the data at BODC.
Manufacturers Calibrations
Air pressure
A manufacturer's calibration was not applied to the Vaisala PTB110 barometer because there was no significant offset reported on the certified calibration certificate.
PAR/TIR
The following manufacturer's calibrations were applied to the PAR and TIR light sensors using:
y (W m -2) = (a x 10 6)/b
Where 'a' is the raw data in volts and 'b' is the calibration offset (µV per W m -2) as shown below:
| Sensor | Serial No. | Location | Offset (µV per W m -2 ) |
| PAR | 28562 | Port | 10.61 |
| PAR | 28560 | Starboard | 10.07 |
| TIR | 994135 | Port | 11.86 |
| TIR | 994133 | Starboard | 9.68 |
Relative wind speed and direction
Relative wind speed and direction were corrected for the ship's heading and speed using the POSMV gyro heading, ship velocities (calculated at BODC from the main positional channels) and an anemometer orientation of 0° on the bow following the Shipboard Automated Meteorological and Oceanographic System (SAMOS) method, thus obtaining the BODC derived absolute wind speed and direction parameters, with codes EWSBSS01 and EWDASS01 respectively.
Relative humidity and air temperature
Manufacturer's calibrations were not applied to the Vaisala HMP45 temperature and humidity probe data because there were no significant offsets reported on the certified calibration certificate.
Screening
All reformatted data were visualised using the in-house EDSERPLO software. Where calibrations had been applied, only the calibrated versions of those parameters were screened. Suspect data were marked by adding an appropriate quality control flag.
Project Information
Oceanographic and Seismic Characterisation of heat dissipation and alteration by hydrothermal fluids at an Axial Ridge (OSCAR)
Background
The cooling of young oceanic crust is the main physical process responsible for removing heat from the solid Earth to the hydrosphere. Close to the mid-ocean ridge rapid cooling is dominated by hydrothermal circulation of seawater through the porous and fractured basalt crust. This hydrothermal fluid is then discharged into the ocean mainly along the ridge. Once in the ocean, released heated seawater mixes with the ambient cold water to form a plume, which provides a mechanism to lift the densest waters away from the bottom boundary layer. These waters are then more readily available for further mixing and heating as part of the global thermohaline circulation system.
The data collected as part of the interdisciplinary OSCAR project will be used to investigate the effects of heat loss and hydrothermal circulation in both the solid Earth and the ocean.
The aim is to:
- Characterise how heat from the interior of the Earth is transported across the crust into the ocean by hydrothermal flows
- Determine the impact the hydrothermal and geothermal fluxes have on the circulation of the abyssal ocean and on the evolution of the oceanic crust.
With this aim, the data will be used to derive a new integrated model of the ocean and hydrothermal circulations at active ocean ridges and ridge flanks. The model will be constrained by geophysical, geological, and physical oceanography data and include fluxes through a permeable seabed. These data and resultant models will set a new benchmark for integrated multi-physics experiments. They will result in a new understanding of the fluid and heat fluxes at ocean ridges and a better understanding of what geophysical and oceanographic data actually resolve in the context of an oceanic axial ridge setting. The result is also a predictive model that can be applied to similar ocean ridge systems world-wide.
Fieldwork
Data collection took place in the Panama Basin, bounded in the north-west by the Cocos Ridge, by the Carnegie Ridge in the south and by South and Central America in the east and north, respectively. Measurements were collected during RRS James Cook cruises JC112 and JC113 (05/12/2014 to 16/01/2015), RRS James Cook cruise JC114 (22/01/2015 to 08/03/2015) and RV Sonne cruise SO328 (06/02/2015 to 06/03/2015). Data were collected using Bottom Pressure Recorder, Acoustic Doppler Current Profiler (ADCP), Magnetotelluric Lander, CTD, Vertical Microstructure Profiler, Synthetic Aperture Radar, Ocean-bottom seismograph and Multibeam echosounder. Measurement of salinity, oxygen and helium were also made and zooplankton samples collected with vertical net casts.
Participants
- Professor Richard W Hobbs (Principal Investigator - Parent Grant) Durham University
- Professor Christine Peirce (Co-Investigator) Durham University
- Professor Christopher J Ballentine (Co-Investigator) University of Oxford
- Professor Joanna V Morgan (Co-Investigator) Imperial College London
- Dr Miguel Morales Maqueda (Principal Investigator - Child Grant) Newcastle University
- Dr David A Smeed (Co-Investigator - Child Grant) National Oceanography Centre
- Dr Vincent CH Tong (Principal Investigator - Child Grant) Birkbeck College
Funding
This project was funded by Natural Environment Research Council parent grant NE/I027010/1 and child grants NE/I022868/1, NE/I022868/2, NE/I022957/1, and NE/I022957/2, entitled 'OSCAR - Oceanographic and Seismic Characterisation of heat dissipation and alteration by hydrothermal fluids at an Axial Ridge', with the former, parent grant led by Professor Richard W Hobbs, Durham University, and the latter child grants led by Dr Miguel Morales Maqueda, Newcastle University and Dr Vincent CH Tong, Birkbeck College.
Data Activity or Cruise Information
Cruise
| Cruise Name | JC112 |
| Departure Date | 2014-11-27 |
| Arrival Date | 2015-01-16 |
| Principal Scientist(s) | Miguel Angel Morales Maqueda (National Oceanography Centre, Liverpool) |
| Ship | RRS James Cook |
Complete Cruise Metadata Report is available here
Fixed Station Information
No Fixed Station Information held for the Series
BODC Quality Control Flags
The following single character qualifying flags may be associated with one or more individual parameters with a data cycle:
| Flag | Description |
|---|---|
| Blank | Unqualified |
| < | Below detection limit |
| > | In excess of quoted value |
| A | Taxonomic flag for affinis (aff.) |
| B | Beginning of CTD Down/Up Cast |
| C | Taxonomic flag for confer (cf.) |
| D | Thermometric depth |
| E | End of CTD Down/Up Cast |
| G | Non-taxonomic biological characteristic uncertainty |
| H | Extrapolated value |
| I | Taxonomic flag for single species (sp.) |
| K | Improbable value - unknown quality control source |
| L | Improbable value - originator's quality control |
| M | Improbable value - BODC quality control |
| N | Null value |
| O | Improbable value - user quality control |
| P | Trace/calm |
| Q | Indeterminate |
| R | Replacement value |
| S | Estimated value |
| T | Interpolated value |
| U | Uncalibrated |
| W | Control value |
| X | Excessive difference |
SeaDataNet Quality Control Flags
The following single character qualifying flags may be associated with one or more individual parameters with a data cycle:
| Flag | Description |
|---|---|
| 0 | no quality control |
| 1 | good value |
| 2 | probably good value |
| 3 | probably bad value |
| 4 | bad value |
| 5 | changed value |
| 6 | value below detection |
| 7 | value in excess |
| 8 | interpolated value |
| 9 | missing value |
| A | value phenomenon uncertain |
| B | nominal value |
| Q | value below limit of quantification |
