Metadata Report for BODC Series Reference Number 1118308
Metadata Summary
Problem Reports
Data Access Policy
Narrative Documents
Project Information
Data Activity or Cruise Information
Fixed Station Information
BODC Quality Flags
SeaDataNet Quality Flags
Metadata Summary
Data Description |
|||||||||||||||||||||||||||||||||||||||||||||||||
|
|||||||||||||||||||||||||||||||||||||||||||||||||
Data Identifiers |
|||||||||||||||||||||||||||||||||||||||||||||||||
|
|||||||||||||||||||||||||||||||||||||||||||||||||
Time Co-ordinates(UT) |
|||||||||||||||||||||||||||||||||||||||||||||||||
|
|||||||||||||||||||||||||||||||||||||||||||||||||
Spatial Co-ordinates | |||||||||||||||||||||||||||||||||||||||||||||||||
|
|||||||||||||||||||||||||||||||||||||||||||||||||
Parameters |
|||||||||||||||||||||||||||||||||||||||||||||||||
|
|||||||||||||||||||||||||||||||||||||||||||||||||
|
|||||||||||||||||||||||||||||||||||||||||||||||||
Problem Reports
No Problem Report Found in the Database
RRS Discovery D344 Meteorology Quality Control Report
Wind speed and direction
The wind channels look good overall. There were some minor instances of wind shielding where the ships superstructure is likely to have shielded the anemometer. Some artifical acceleration was also observed where true wind speed increased due to changes in the ships heading. These instances have been flagged accordingly.
Light sensors
The PAR and TIR channels look good. The night cycles have flags applied to them because the PAR and TIR sensors experience radiation loss during the night time, when the outside temperature is lower than the temperature inside the housing dome.
Air pressure, temperature and relative humidity
The Temperature, pressure and humidity data look good. Readings are within their expected ranges and no quality control flags were applied.
Data Access Policy
Open Data supplied by Natural Environment Research Council (NERC)
You must always use the following attribution statement to acknowledge the source of the information: "Contains data supplied by Natural Environment Research Council."
Narrative Documents
Gill Instruments Windsonic Anemometer
The Gill Windsonic is a 2-axis ultrasonic wind sensor that monitors wind speed and direction using four transducers. The time taken for an ultrasonic pulse to travel from the North to the South transducers is measured and compared with the time for a pulse to travel from South to North. Travel times between the East and West transducers are similarly compared. The wind speed and direction are calculated from the differences in the times of flight along each axis. This calculation is independent of environmental factors such as temperature.
Specifications
| Ultrasonic output rate | 0.25, 0.5, 1, 2 or 4 Hz |
| Operating Temperature | -35 to 70°C |
| Operating Humidity | < 5 to 100% RH |
| Anemometer start up time | < 5 s |
| Wind speed | |
| Range | 0 to 60 m s-1 |
| Accuracy | ± 2% at 2 m s-1 |
| Resolution | 0.01 m s-1 |
| Response time | 0.25 s |
| Threshold | 0.01 m s-1 |
| Wind direction | |
| Range | 0 to 359° |
| Accuracy | ± 3° at 12 m s-1 |
| Resolution | 1° |
| Response time | 0.25 s |
Further details can be found in the manufacturer's specification sheet.
Kipp and Zonen Pyranometer Model CM6B
The CM6B pyranometer is intended for routine global solar radiation measurement research on a level surface. The CM6B features a sixty-four thermocouple junction (series connected) sensing element. The sensing element is coated with a highly stable carbon based non-organic coating, which delivers excellent spectral absorption and long term stability characteristics. The sensing element is housed under two concentric fitting Schott K5 glass domes.
Specifications
| Dimensions (W x H) | 150.0 mm x 91.5 mm |
|---|---|
| Weight | 850 grams |
| Operating Temperature | -40°C to +80°C |
| Spectral Range | 305 - 2800 nm (50% points) |
| Sensitivity | 9 -15 µV/W/m2 |
| Impedance (nominal) | 70 - 100 ohm |
| Response Time (95%) | 30 sec |
| Non-linearity | < ± 1.2% (<1000 W/m2) |
| Temperature dependence of sensitivity | < ± 2% (-10 to +40°C) |
| Zero-offset due to temperature changes | < ± 4 W/m2 at 5 K/h temperature change |
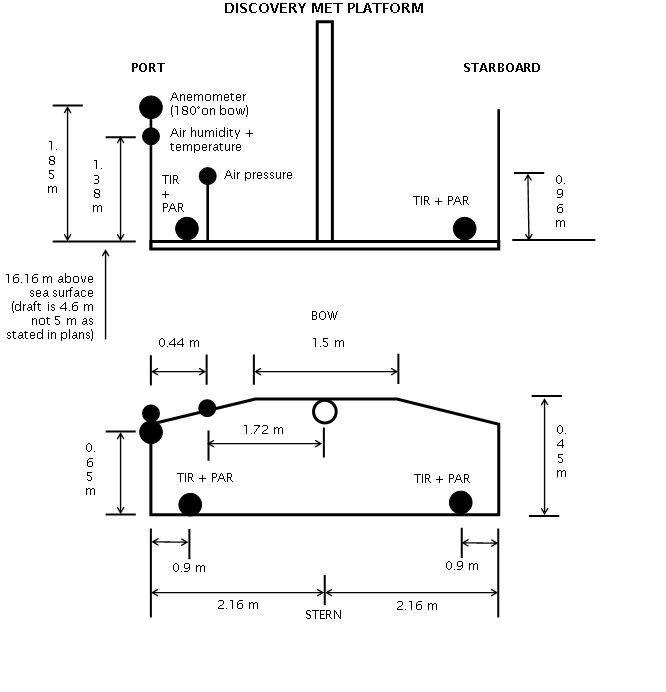
RRS Discovery D344 Meteorology Instrumentation
All instruments are located on the foremast with the exception of the barometer, which is located in the main lab.
| Sensor | Serial number | Last calibration date |
|---|---|---|
| Vaisala PTB100A (barometric pressure) sensor | S361008 | 23/02/2009 |
| Vaisala HMP45 (air temperature and relative humidity) sensor | B4950010 | 11/02/2009 |
| SKYE PPAR | 28557 | 12/02/2009 |
| SKYE SPAR | 28556 | 12/02/2009 |
| Kipp and Zonen PTIR | CM 6B 994133 | 23/06/2008 |
| Kipp and Zonen STIR | CM 6B 962301 | 19/02/2009 |
| Gill Instruments WindSonic | 071123 | - |
Skye Instruments PAR Energy Sensor Model SKE 510
The SKE 510 is suitable for measuring photosynthetically active radiation (PAR) from natural or artificial light sources. The sensor is fully waterproof and guaranteed submersible to 4m depth, and indoor versions are also available.
The instrument uses a blue-enhanced planar diffused silicon detector to measure energy (in W m-2) over the 400-700 nm waveband. It has a cosine-corrected head and a square spectral response. The sensor can operate over a temperature range of -35 to 70 °C and a humidity range of 0-100% RH.
Specifications
| Sensitivity (current) | 1.5µA or 100 W m-2 |
|---|---|
| Sensitivity (voltage) | 1mV or 100 W m-2 |
| Working Range | 0-5000 W m-2 |
| Linearity error | 0.2% |
| Absolute calibration error | typ. less than 3% 5% max |
| Response time - voltage output | 10 ns |
| Cosine error | 3% |
| Azimuth error | less than 1% |
| Temperature co-efficient | ±0.1% per °C |
| Internal resistance - voltage output | c. 300 ohms |
| Longterm stability | ±2% |
| Material | Dupont 'Delrin' |
| Dimensions | 34 mm diameter 38mm height |
| Cable | 2 core screened 7 - 2 - 2C |
| Sensor Passband | 400 - 700 nm |
| Detector | Silicon photocell |
| Filters | Glass type and/or metal interference |
Vaisala Analog Barometers Models PTB100 (A), (B) and PTB101 (B), (C)
The PTB 100 series analog barometers are designed both for accurate barometric measurements at room temperature and for general environmental pressure monitoring over a wide temperature range. The long-term stability of the barometer minimizes the need for field adjustment in many applications.
Physical Specifications
| Size | 97 x 60 x 22 mm |
|---|---|
| Weight | 85g |
The barometers use the BAROCAP* silicon capacitive absolute pressure sensor developed by Vaisala for barometric pressure measurements. The BAROCAP* sensor combines the elasticity characteristics and mechanical stability of a single-crystal silicon with the proven capacitive detection principle.
Sensor Specifications
| Model Number | Pressure Range (mbar) | Temperature Range (°C) | Humidity Range | Total Accuracy | |
|---|---|---|---|---|---|
| PTB100A | 800 to 1060 | -40 to +60 | non-condensing | +20 °C | ± 0.3 mbar |
| 0 to +40 °C | ± 1.0 mbar | ||||
| -20 to +45 °C | ± 1.5 mbar | ||||
| -40 to +60 °C | ± 2.5 mbar | ||||
| PTB100B | 600 to 1060 | -40 to +60 | non-condensing | +20 °C | ± 0.5 mbar |
| 0 to +40 °C | ± 1.5 mbar | ||||
| -20 to +45 °C | ± 2.0 mbar | ||||
| -40 to +60 °C | ± 3.0 mbar | ||||
| PTB101B | 600 to 1060 | -40 to +60 | non-condensing | +20 °C | ± 0.5 mbar |
| 0 to +40 °C | ± 1.5 mbar | ||||
| -20 to +45 °C | ± 2.0 mbar | ||||
| -40 to +60 °C | ± 3.0 mbar | ||||
| PTB101C | 900 to 1100 | -40 to +60 | non-condensing | +20 °C | ± 0.3 mbar |
| 0 to +40 °C | ± 1.0 mbar | ||||
| -20 to +45 °C | ± 1.5 mbar | ||||
| -40 to +60 °C | ± 2.5 mbar | ||||
* BAROCAP is a registered trademark of Vaisala
Vaisala Temperature and Relative Humidity HMP Sensors
A family of sensors and instruments (sensors plus integral displays or loggers) for the measurement of air temperature and relative humidity. All are based on a probe containing a patent (HUMICAP) capacitive thin polymer film capacitanece humidity sensor and a Pt100 platinum resistance thermometer. The probes are available with a wide range of packaging, cabling and interface options all of which have designations of the form HMPnn or HMPnnn such as HMP45 and HMP230. Vaisala sensors are incorporated into weather stations and marketed by Campbell Scientific.
All versions operate at up to 100% humidity. Operating temperature ranges vary between models, allowing users to select the version best suited to their requirements.
Further details can be found in the manufacturer's specification sheets for the HMP 45 series, HMP 70 series and HMP 230 series.
RRS Discovery D344 Meteorology Data Processing Procedures
Originator's processing
Meteorological data were taken from the ship's TECHSAS streams and formatted into MSTAR NetCDF format.
Speed made good and course made good are calculated and, along with corrected heading, merged onto the same time stamps as the wind data from the anemometer. True wind speed and direction are then calculated following the method of Smith et al. (1998).
Port and starboard PAR and TIR sensors on the foremast and air pressure from the barometer in the main lab were logged to a separate TECHSAS file. These were then reformatted into MSTAR netCDF. Manufacturer's calibrations were applied to convert the data into physical units.
| Filename | Content description | Format | Interval | Start date/time (UTC) | End date/time (UTC) | Comments |
| met_di344_01.nc | Air temperature, humidity | NetCDF | 2 sec. | 18-Oct-2009 00:00:01 | 18-Nov-2009 13:30:36 | |
| wind_di344_01.nc | relative wind speed, relative wind direction, true wind speed, true wind direction, speed over ground, course over ground | NetCDF | 2 sec. | 18-Oct-2009 00:00:01 | 18-Nov-2009 13:30:36 | |
| met_light_di344_cal_01.nc | Air pressure, PAR, TIR | NetCDF | 2 sec. | 18-Oct-2009 00:00:01 | 18-Nov-2009 13:30:36 |
BODC processing
The files were reformatted to BODC internal format using standard data banking procedures. All files were averaged to 60 second intervals.
Records from the port and starboard PAR and solar radiation channels were each merged into a single channel by taking the maximum of the port or starboard sensor value at every cycle to minimise shading effects. No additional processing was carried out by BODC. The following table shows how the variables within the files were mapped to appropriate BODC parameter codes:
met_di344_01.nc
| Originator's Variable | Originator's units | Description | BODC Code | BODC Units | Unit conversion | Comments |
| airtemp | degrees | Air temperature | CDTASS01 | °C | none | |
| humid | percentage | Air humidity | CRELSS01 | % | none |
wind_di344_01.nc
| Originator's Variable | Originator's units | Description | BODC Code | BODC Units | Unit conversion | Comments |
| true_wind_speed | ms-1 | True wind speed | EWSBSS01 | ms-1 | none | |
| true_wind_direction | degrees | True wind direction | EWDASS01 | degrees | none | |
| press | mbar | Atmospheric pressure | CAPHZZ01 | mbar | none |
met_light_di344_cal_01.nc
| Originator's Variable | Originator's units | Description | BODC Code | BODC Units | Unit conversion | Comments |
| - | Wm-2 | Solar radiation | CSLRR1XS | Wm-2 | none | Merged port and starboard solar radiation, generated at BODC |
| - | Wm-2 | PAR radiation | DWIRRXMX | Wm-2 | none | Merged port and starboard solar radiation, generated at BODC |
Calibrations
Field Calibrations
No field calibrations were applied to the data at BODC.
Manufacturers Calibrations
PAR/TIR
The following manufacturer's calibrations were applied to the PAR and TIR light sensors using:
y (W m -2 ) = (a x 10 6 )/b
where 'a' is the raw data in volts and 'b' is the calibration offset (µV per W m -2 ) as shown below.
| Sensor | Serial no | location | offset (µV per W m -2 ) |
| PAR | 28557 | Port | 11.04 |
| PAR | 28556 | Starboard | 10.53 |
| TIR | 994133 | Port | 9.60 |
| TIR | 962301 | Starboard | 9.76 |
All the reformatted data were visualised using the in-house EDSERPLO software. Suspect data were marked by adding an appropriate quality control flag
Project Information
Monitoring the Meridional Overturning Circulation at 26.5N (RAPIDMOC)
Scientific Rationale
There is a northward transport of heat throughout the Atlantic, reaching a maximum of 1.3PW (25% of the global heat flux) around 24.5°N. The heat transport is a balance of the northward flux of a warm Gulf Stream, and a southward flux of cooler thermocline and cold North Atlantic Deep Water that is known as the meridional overturning circulation (MOC). As a consequence of the MOC northwest Europe enjoys a mild climate for its latitude: however abrupt rearrangement of the Atlantic Circulation has been shown in climate models and in palaeoclimate records to be responsible for a cooling of European climate of between 5-10°C. A principal objective of the RAPID programme is the development of a pre-operational prototype system that will continuously observe the strength and structure of the MOC. An initiative has been formed to fulfill this objective and consists of three interlinked projects:
- A mooring array spanning the Atlantic at 26.5°N to measure the southward branch of the MOC (Hirschi et al., 2003 and Baehr et al., 2004).
- Additional moorings deployed in the western boundary along 26.5°N (by Prof. Bill Johns, University of Miami) to resolve transport in the Deep Western Boundary Current (Bryden et al., 2005). These moorings allow surface-to-bottom density profiles along the western boundary, Mid-Atlantic Ridge, and eastern boundary to be observed. As a result, the transatlantic pressure gradient can be continuously measured.
- Monitoring of the northward branch of the MOC using submarine telephone cables in the Florida Straits (Baringer et al., 2001) led by Dr Molly Baringer (NOAA/AOML/PHOD).
The entire monitoring array system created by the three projects will be recovered and redeployed annually until 2008 under RAPID funding. From 2008 until 2014 the array will continue to be serviced annually under RAPID-WATCH funding.
The array will be focussed on three regions, the Eastern Boundary (EB), the Mid Atlantic Ridge (MAR) and the Western Boundary (WB). The geographical extent of these regions are as follows:
- Eastern Boundary (EB) array defined as a box with the south-east corner at 23.5°N, 25.5°W and the north-west corner at 29.0°N, 12.0°W
- Mid Atlantic Ridge (MAR) array defined as a box with the south-east corner at 23.0°N, 52.1°W and the north-west corner at 26.5°N, 40.0°W
- Western Boundary (WB) array defined as a box with the south-east corner at 26.0°N, 77.5°W and the north-west corner at 27.5°N, 69.5°W
References
Baehr, J., Hirschi, J., Beismann, J.O. and Marotzke, J. (2004) Monitoring the meridional overturning circulation in the North Atlantic: A model-based array design study. Journal of Marine Research, Volume 62, No 3, pp 283-312.
Baringer, M.O'N. and Larsen, J.C. (2001) Sixteen years of Florida Current transport at 27N Geophysical Research Letters, Volume 28, No 16, pp3179-3182
Bryden, H.L., Johns, W.E. and Saunders, P.M. (2005) Deep Western Boundary Current East of Abaco: Mean structure and transport. Journal of Marine Research, Volume 63, No 1, pp 35-57.
Hirschi, J., Baehr, J., Marotzke J., Stark J., Cunningham S.A. and Beismann J.O. (2003) A monitoring design for the Atlantic meridional overturning circulation. Geophysical Research Letters, Volume 30, No 7, article number 1413 (DOI 10.1029/2002GL016776)
RAPID- Will the Atlantic Thermohaline Circulation Halt? (RAPID-WATCH)
RAPID-WATCH (2007-2014) is a continuation programme of the Natural Environment Research Council's (NERC) Rapid Climate Change (RAPID) programme. It aims to deliver a robust and scientifically credible assessment of the risk to the climate of UK and Europe arising from a rapid change in the Atlantic Meridional Overturning Circulation (MOC). The programme will also assess the need for a long-term observing system that could detect major MOC changes, narrow uncertainty in projections of future change, and possibly be the start of an 'early warning' prediction system.
The effort to design a system to continuously monitor the strength and structure of the North Atlantic MOC is being matched by comparative funding from the US National Science Foundation (NSF) for the existing collaborations started during RAPID for the observational arrays.
Scientific Objectives
- To deliver a decade-long time series (2004-2014) of calibrated and quality-controlled measurements of the Atlantic MOC from the RAPID-WATCH arrays.
- To exploit the data from the RAPID-WATCH arrays and elsewhere to determine and interpret recent changes in the Atlantic MOC, assess the risk of rapid climate change, and investigate the potential for predictions of the MOC and its impacts on climate.
This work will be carried out in collaboration with the Hadley Centre in the UK and through international partnerships.
Mooring Arrays
The RAPID-WATCH arrays are the existing 26°N MOC observing system array (RAPIDMOC) and the WAVE array that monitors the Deep Western Boundary Current. The data from these arrays will work towards meeting the first scientific objective.
The RAPIDMOC array consists of moorings focused in three geographical regions (sub-arrays) along 26.5° N: Eastern Boundary, Mid-Atlantic Ridge and Western Boundary. The Western Boundary sub-array has moorings managed by both the UK and US scientists. The other sub-arrays are solely led by the UK scientists. The lead PI is Dr Stuart Cunningham of the National Oceanography Centre, Southampton, UK.
The WAVE array consists of one line of moorings off Halifax, Nova Scotia. The line will be serviced in partnership with the Bedford Institute of Oceanography (BIO), Halifax, Canada. The lead PI is Dr Chris Hughes of the Proudman Oceanographic Laboratory, Liverpool, UK.
All arrays will be serviced (recovered and redeployed) either on an annual or biennial basis using Research Vessels from the UK, US and Canada.
Modelling Projects
The second scientific objective will be addressed through numerical modelling studies designed to answer four questions:
- How can we exploit data from the RAPID-WATCH arrays to obtain estimates of the MOC and related variables?
- What do the observations from the RAPID-WATCH arrays and other sources tell us about the nature and causes of recent changes in the Atlantic Ocean?
- What are the implications of RAPID-WATCH array data and other recent observations for estimates of the risk due to rapid change in the MOC?
- Could we use RAPID-WATCH and other observations to help predict future changes in the MOC and climate?
Data Activity or Cruise Information
Cruise
| Cruise Name | D344 |
| Departure Date | 2009-10-21 |
| Arrival Date | 2009-11-18 |
| Principal Scientist(s) | Stuart A Cunningham (National Oceanography Centre, Southampton) |
| Ship | RRS Discovery |
Complete Cruise Metadata Report is available here
Fixed Station Information
No Fixed Station Information held for the Series
BODC Quality Control Flags
The following single character qualifying flags may be associated with one or more individual parameters with a data cycle:
| Flag | Description |
|---|---|
| Blank | Unqualified |
| < | Below detection limit |
| > | In excess of quoted value |
| A | Taxonomic flag for affinis (aff.) |
| B | Beginning of CTD Down/Up Cast |
| C | Taxonomic flag for confer (cf.) |
| D | Thermometric depth |
| E | End of CTD Down/Up Cast |
| G | Non-taxonomic biological characteristic uncertainty |
| H | Extrapolated value |
| I | Taxonomic flag for single species (sp.) |
| K | Improbable value - unknown quality control source |
| L | Improbable value - originator's quality control |
| M | Improbable value - BODC quality control |
| N | Null value |
| O | Improbable value - user quality control |
| P | Trace/calm |
| Q | Indeterminate |
| R | Replacement value |
| S | Estimated value |
| T | Interpolated value |
| U | Uncalibrated |
| W | Control value |
| X | Excessive difference |
SeaDataNet Quality Control Flags
The following single character qualifying flags may be associated with one or more individual parameters with a data cycle:
| Flag | Description |
|---|---|
| 0 | no quality control |
| 1 | good value |
| 2 | probably good value |
| 3 | probably bad value |
| 4 | bad value |
| 5 | changed value |
| 6 | value below detection |
| 7 | value in excess |
| 8 | interpolated value |
| 9 | missing value |
| A | value phenomenon uncertain |
| B | nominal value |
| Q | value below limit of quantification |
