Metadata Report for BODC Series Reference Number 2079766
Metadata Summary
Problem Reports
Data Access Policy
Narrative Documents
Project Information
Data Activity or Cruise Information
Fixed Station Information
BODC Quality Flags
SeaDataNet Quality Flags
Metadata Summary
Data Description |
|||||||||||||||||||||||||||||||||||||||||||||||||||||||||||||||||||||||||||||
|
|||||||||||||||||||||||||||||||||||||||||||||||||||||||||||||||||||||||||||||
Data Identifiers |
|||||||||||||||||||||||||||||||||||||||||||||||||||||||||||||||||||||||||||||
|
|||||||||||||||||||||||||||||||||||||||||||||||||||||||||||||||||||||||||||||
Time Co-ordinates(UT) |
|||||||||||||||||||||||||||||||||||||||||||||||||||||||||||||||||||||||||||||
|
|||||||||||||||||||||||||||||||||||||||||||||||||||||||||||||||||||||||||||||
Spatial Co-ordinates | |||||||||||||||||||||||||||||||||||||||||||||||||||||||||||||||||||||||||||||
|
|||||||||||||||||||||||||||||||||||||||||||||||||||||||||||||||||||||||||||||
Parameters |
|||||||||||||||||||||||||||||||||||||||||||||||||||||||||||||||||||||||||||||
|
|||||||||||||||||||||||||||||||||||||||||||||||||||||||||||||||||||||||||||||
|
|||||||||||||||||||||||||||||||||||||||||||||||||||||||||||||||||||||||||||||
Problem Reports
No Problem Report Found in the Database
Data Access Policy
Open Data supplied by Natural Environment Research Council (NERC)
You must always use the following attribution statement to acknowledge the source of the information: "Contains data supplied by Natural Environment Research Council."
Narrative Documents
D346 Meteorology Instrumentation
The instruments used to collect this data set are presented in the table below:
| Sensor | Serial number | Last calibration date |
|---|---|---|
| Vaisala PTB100A (barometric pressure) sensor | S3610008 | 23/02/2009 |
| Vaisala HMP45 (air temperature and relative humidity) sensor | B4950010 | 11/02/2009 |
| SKYE PPAR | 28557 | 12/02/2009 |
| SKYE SPAR | 28556 | 12/02/2009 |
| Kipp and Zonen PTIR | CM 6B 994133 | 23/06/2008 |
| Kipp and Zonen STIR | CM 6B 962301 | 19/02/2009 |
| Gill Instruments WindSonic | 071123 | - |
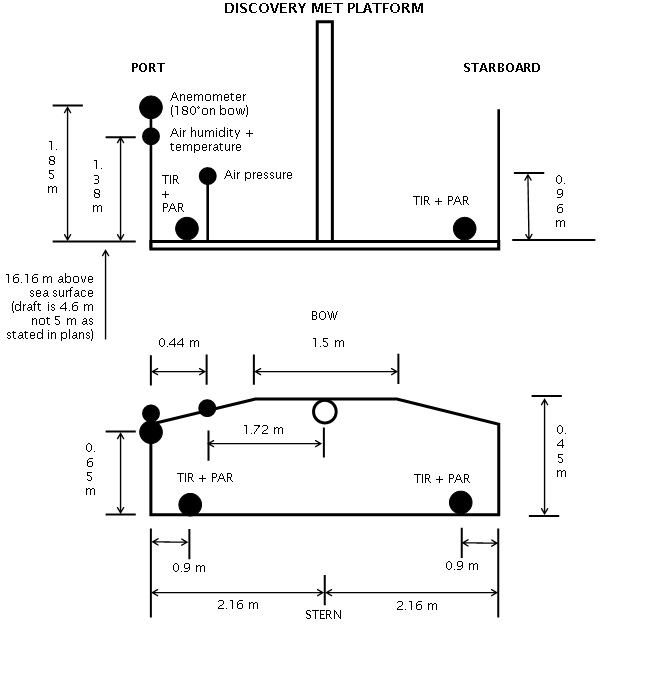
All instruments are located on the foremast in order to obtain the best exposure.
Gill Instruments Windsonic Anemometer
The Gill Windsonic is a 2-axis ultrasonic wind sensor that monitors wind speed and direction using four transducers. The time taken for an ultrasonic pulse to travel from the North to the South transducers is measured and compared with the time for a pulse to travel from South to North. Travel times between the East and West transducers are similarly compared. The wind speed and direction are calculated from the differences in the times of flight along each axis. This calculation is independent of environmental factors such as temperature.
Specifications
| Ultrasonic output rate | 0.25, 0.5, 1, 2 or 4 Hz |
| Operating Temperature | -35 to 70°C |
| Operating Humidity | < 5 to 100% RH |
| Anemometer start up time | < 5 s |
| Wind speed | |
| Range | 0 to 60 m s-1 |
| Accuracy | ± 2% at 2 m s-1 |
| Resolution | 0.01 m s-1 |
| Response time | 0.25 s |
| Threshold | 0.01 m s-1 |
| Wind direction | |
| Range | 0 to 359° |
| Accuracy | ± 3° at 12 m s-1 |
| Resolution | 1° |
| Response time | 0.25 s |
Further details can be found in the manufacturer's specification sheet.
Kipp and Zonen Pyranometer Model CM6B
The CM6B pyranometer is intended for routine global solar radiation measurement research on a level surface. The CM6B features a sixty-four thermocouple junction (series connected) sensing element. The sensing element is coated with a highly stable carbon based non-organic coating, which delivers excellent spectral absorption and long term stability characteristics. The sensing element is housed under two concentric fitting Schott K5 glass domes.
Specifications
| Dimensions (W x H) | 150.0 mm x 91.5 mm |
|---|---|
| Weight | 850 grams |
| Operating Temperature | -40°C to +80°C |
| Spectral Range | 305 - 2800 nm (50% points) |
| Sensitivity | 9 -15 µV/W/m2 |
| Impedance (nominal) | 70 - 100 ohm |
| Response Time (95%) | 30 sec |
| Non-linearity | < ± 1.2% (<1000 W/m2) |
| Temperature dependence of sensitivity | < ± 2% (-10 to +40°C) |
| Zero-offset due to temperature changes | < ± 4 W/m2 at 5 K/h temperature change |
Skye Instruments PAR Energy Sensor Model SKE 510
The SKE 510 is suitable for measuring photosynthetically active radiation (PAR) from natural or artificial light sources. The sensor is fully waterproof and guaranteed submersible to 4m depth, and indoor versions are also available.
The instrument uses a blue-enhanced planar diffused silicon detector to measure energy (in W m-2) over the 400-700 nm waveband. It has a cosine-corrected head and a square spectral response. The sensor can operate over a temperature range of -35 to 70 °C and a humidity range of 0-100% RH.
Specifications
| Sensitivity (current) | 1.5µA or 100 W m-2 |
|---|---|
| Sensitivity (voltage) | 1mV or 100 W m-2 |
| Working Range | 0-5000 W m-2 |
| Linearity error | 0.2% |
| Absolute calibration error | typ. less than 3% 5% max |
| Response time - voltage output | 10 ns |
| Cosine error | 3% |
| Azimuth error | less than 1% |
| Temperature co-efficient | ±0.1% per °C |
| Internal resistance - voltage output | c. 300 ohms |
| Longterm stability | ±2% |
| Material | Dupont 'Delrin' |
| Dimensions | 34 mm diameter 38mm height |
| Cable | 2 core screened 7 - 2 - 2C |
| Sensor Passband | 400 - 700 nm |
| Detector | Silicon photocell |
| Filters | Glass type and/or metal interference |
Vaisala Analog Barometers Models PTB100 (A), (B) and PTB101 (B), (C)
The PTB 100 series analog barometers are designed both for accurate barometric measurements at room temperature and for general environmental pressure monitoring over a wide temperature range. The long-term stability of the barometer minimizes the need for field adjustment in many applications.
Physical Specifications
| Size | 97 x 60 x 22 mm |
|---|---|
| Weight | 85g |
The barometers use the BAROCAP* silicon capacitive absolute pressure sensor developed by Vaisala for barometric pressure measurements. The BAROCAP* sensor combines the elasticity characteristics and mechanical stability of a single-crystal silicon with the proven capacitive detection principle.
Sensor Specifications
| Model Number | Pressure Range (mbar) | Temperature Range (°C) | Humidity Range | Total Accuracy | |
|---|---|---|---|---|---|
| PTB100A | 800 to 1060 | -40 to +60 | non-condensing | +20 °C | ± 0.3 mbar |
| 0 to +40 °C | ± 1.0 mbar | ||||
| -20 to +45 °C | ± 1.5 mbar | ||||
| -40 to +60 °C | ± 2.5 mbar | ||||
| PTB100B | 600 to 1060 | -40 to +60 | non-condensing | +20 °C | ± 0.5 mbar |
| 0 to +40 °C | ± 1.5 mbar | ||||
| -20 to +45 °C | ± 2.0 mbar | ||||
| -40 to +60 °C | ± 3.0 mbar | ||||
| PTB101B | 600 to 1060 | -40 to +60 | non-condensing | +20 °C | ± 0.5 mbar |
| 0 to +40 °C | ± 1.5 mbar | ||||
| -20 to +45 °C | ± 2.0 mbar | ||||
| -40 to +60 °C | ± 3.0 mbar | ||||
| PTB101C | 900 to 1100 | -40 to +60 | non-condensing | +20 °C | ± 0.3 mbar |
| 0 to +40 °C | ± 1.0 mbar | ||||
| -20 to +45 °C | ± 1.5 mbar | ||||
| -40 to +60 °C | ± 2.5 mbar | ||||
* BAROCAP is a registered trademark of Vaisala
Vaisala HMP 45 humidity and temperature probe
A humidity and temperature sensor designed for use with the HMI41 Humidity Indicator to measure temperature and humidity, as well as dew point, wet bulb temperature, absolute humidity and mixing ratio. It is also suitable for spot-checking applications. The HMP45 probe is attached to the HMI141 Indicator via a spiral cable. The HMP45 probe features a patented HUMICAP 180 capacitive thin film polymer humidity sensor and a Pt1000 platinum resistance thermometer. The HMP45 measures humidity from 0-100 percent RH at an accuracy of +/- 3 percent RH at 20 degC. It measures temperature from -20 to +60 degC.
For more information, please see this document: https://www.bodc.ac.uk/data/documents/nodb/pdf/Vaisala_HMP_41_42_45.pdf
RAPID Cruise D346 Underway Navigation, Meteorology and Sea Surface Hydrography Series
Cruise details
| Dates | 2010-01-05 - 2010-02-19 |
|---|---|
| Principal Scientific Officer | Dr Brian King (NOCS) |
| Data supplied by | Dr Brian King (NOCS) |
Cruise D346 occupied a hydrographic section at a nominal latitude of 24.5°N in the Atlantic Ocean during January - February 2010 on RRS Discovery. The primary objective of this cruise was to measure ocean physical, chemical and biological parameters in order to establish regional budgets of heat, freshwater and carbon, and to infer decadal variability.
Content of data series
| Parameter | Units | BODC Parameter code | Units | Comments | File where parameter originated from |
|---|---|---|---|---|---|
| Longitude | ° (+ve E) | ALATEWGS | ° (+ve E) | Transferred as a dummy channel and then dropped when it was decided that ALONGP01 was the preferred channel | met_di346_truewind.nc |
| Latitude | ° (+ve N) | ALATGP01 | ° (+ve N) | - | bst_di346_01.nc |
| Latitude | ° (+ve N) | ALATNWGS | ° (+ve N) | Transferred as a dummy channel and then dropped when it was decided that ALATGP01 was the preferred channel | met_di346_truewind.nc |
| Longitude | ° (+ve E) | ALONGP01 | ° (+ve E) | - | bst_di346_01.nc |
| Ship's direction of motion over ground | ° true | APDAZZ01 | ° true | - | met_di346_truewind.nc |
| Ship's eastward velocity | ms-1 | APEWGP01 | cms-1 | Unit conversion required: *100 | met_di346_truewind.nc |
| Ship's northward velocity | ms-1 | APNSGP01 | cms-1 | Unit conversion required: *100 | met_di346_truewind.nc |
| Ship's speed over ground | ms-1 | APSAZZ01 | ms-1 | - | met_di346_truewind.nc |
| Attenuance | Volts | ATTNUN25 | m-1 | Calibrated at BODC | - |
| Atmospheric pressure | mbar | CAPHZZ01 | mbar | - | press_correct_di346_01.nc |
| Air temperature | °C | CDTASS01 | °C | - | met_di346_truewind.nc |
| Conductivity | Sm-1 | CNDCSG01 | Sm-1 | - | met_tsg_di346_01.nc |
| Conductivity | Sm-1 | CNDCSG02 | Sm-1 | Transferred as a dummy channel and then dropped when it was decided that CNDCSG01 was the preferred channel | tsgnav_d346_final.nc |
| Chlorophyll-a concentration | mgl-1 | CPHLPM01 | mg m-3 | Calibrated at BODC | - |
| Air humidity | % | CRELZZ01 | % | - | met_di346_truewind.nc |
| Port solar radiation | Wm-2 | CSLRRP01 | Wm-2 | - | met_light_di346_01.nc |
| Starboard solar radiation | Wm-2 | CSLRRS01 | Wm-2 | - | met_light_di346_01.nc |
| Solar radiation | Wm-2 | CSLRR1XS | Wm-2 | Merged port and starboard solar radiation, generated at BODC | - |
| Distance travelled | km | DSRNCV01 | km | Computed at BODC | met_di346_truewind.nc |
| Port PAR irradiance | Wm-2 | DWIRRPSD | Wm-2 | - | met_light_di346_01.nc |
| Starboard PAR irradiance | Wm-2 | DWIRRSSD | Wm-2 | - | met_light_di346_01.nc |
| PAR irradiance | Wm-2 | DWIRRXMX | Wm-2 | Merged port and starboard PAR, generated at BODC | - |
| True wind direction | ° | EWDASS01 | ° | Corrected for ship's motion | met_di346_truewind.nc |
| True wind in eastward direction | ms-1 | EWEWSS01 | ms-1 | - | met_di346_truewind.nc |
| True wind in northward direction | ms-1 | EWNSSS01 | ms-1 | - | met_di346_truewind.nc |
| True wind speed | ms-1 | EWSBSS01 | ms-1 | Corrected for ship's motion | met_di346_truewind.nc |
| Ship's heading | ° | HEADCM01 | ° | - | met_di346_truewind.nc |
| Corrected bathymetric depth (Simrad EA500 hydrographic echosounder with hull transducer and towed fish) | m | MBANCT01 | m | Corrected using Carter's tables | sim_di346_nav_merged.nc |
| Bathymetric depth (GEBCO) | m | MBANGB08 | m | GEBCO_08 30 arc-second global grid | - |
| Salinity | - | PSALSG01 | dimensionless | Calibrated against discrete sample data at BODC | - |
| Salinity | - | PSALSG02 | dimensionless | Transferred as a dummy channel and then dropped when it was decided that PSALSU01 was the preferred channel | tsgnav_d346_final.nc |
| Salinity | - | PSALSU01 | dimensionless | No in-situ calibration applied by Originator | tsgnav_d346_final.nc |
| Salinity | - | PSALSZ01 | dimensionless | Transferred as a dummy channel and then dropped when it was decided that PSALSU01 was the preferred channel | met_tsg_di346_01.nc |
| Sea Surface Temperature | °C | TEMPBT01 | °C | Transferred as a dummy channel and then dropped when it was decided that TEMPHU01 was the preferred channel | met_tsg_di346_01.nc |
| Sea surface temperature | °C | TEMPET01 | °C | Transferred as a dummy channel and then dropped when it was decided that TEMPHU01 was the preferred channel | tsgnav_d346_final.nc |
| Sea surface temperature | °C | TEMPHG01 | °C | Calibrated against surface CTD data at BODC | - |
| Sea surface temperature | °C | TEMPHU01 | °C | No in-situ calibration applied by Originator | tsgnav_d346_final.nc |
| Temperature of conductivity measurement | °C | TMESSG01 | °C | - | met_tsg_di346_01.nc |
| Temperature of conductivity measurement | °C | TMESSG02 | °C | Transferred as a dummy channel and then dropped when it was decided that TMESSG01 was the preferred channel | tsgnav_d346_final.nc |
Instrumentation
Sea surface hydrography (HIUWAY)
The instruments used to collect this data set are presented in the table below:
| Sensor | Serial number | Last calibration date |
|---|---|---|
| Sea-Bird SBE 45 MicroTSG | 0229 | 25/02/2009 |
| Sea-Bird SBE 38 digital thermometer | 0476 | 01/01/2009 |
| WET Labs C-star transmissometer | CST-112R | 30/04/2009 |
| WET Labs fluorometer | WS3S-247 | 18/06/2008 |
Near surface temperature was measured with a SBE 38 probe located in the forward hold on the starboard side, measuring the temperature of water 6-7 metres below the surface. The seawater intake projects about 0.5 metres below the hull.
A SBE45 MicroTSG is fitted in the wet lab and the non-toxic supply runs from this intake. Samples were taken every four hours from the non-toxic supply on the upstream side of the SBE 45 in order to calibrate the conductivity data.
Meteorology (HIMET)
The instruments used to collect this data set are presented in the table below:
| Sensor | Serial number | Last calibration date |
|---|---|---|
| Vaisala PTB100A (barometric pressure) sensor | S3610008 | 23/02/2009 |
| Vaisala HMP45A (air temperature and relative humidity) sensor | B4950010 | 11/02/2009 |
| SKYE PPAR | 28557 | 12/02/2009 |
| SKYE SPAR | 28556 | 12/02/2009 |
| Kipp and Zonen PTIR | CM 6B 994133 | 23/06/2008 |
| Kipp and Zonen STIR | CM 6B 962301 | 19/02/2009 |
| Gill Instruments WindSonic | 071123 | - |
All instruments are located on the foremast in order to obtain the best exposure.
Navigation and bathymetry (HIPLAT)
The RRS Discovery has three GPS receivers: the Trimble 4000, which is a differential GPS; the Ashtech and the GPS G12. The ship also uses a gyrocompass and Chernikeeff Electromagnetic (EM) log to measure speed and heading.
Bathymetric depth data were obtained using a Simrad EA500 hydrographic echosounder and a Precision Echosounding transducer (PES) mounted in a 'Fish'.
Data processing procedures
Sea surface hydrography (HPUWAY)
Originator's processing
Data were taken from the ship's TECHSAS streams and formatted into MSTAR netCDF format. All times were defined as seconds from 00:00:00 01/01/2010.
The hydrography measurements were performed by a number of instruments in the ship's flow through system and a temperature sensor (SBE38) located near the flow through intake. A SBE45 MicroTSG was used in the wet lab, measuring the temperature and conductivity of the water pumped up through the ship's flow through system.
Salinity data were calibrated by calibrating the conductivity channel and then deriving salinity. Discrete bottle conductivities were compared with the TSG conductivities.
BODC processing
All 1 second sea surface hydrographic data were transferred from an MSTAR format into a BODC internal format (a netCDF subset) to allow use of the in-house visualisation tool (EDSERPLO). All hydrography parameters were matched against BODC codes as presented in the table above. Reformatting and data calibration was carried out, and is discussed below. Each data channel was visually inspected and any spikes or periods of dubious data flagged as suspect with an 'M'. The capabilities of the screening software allows comparative screening checks between channels.
All parameters were screened in EDSERPLO and suspect data were flagged.
-
Temperature
The hull temperature data were calibrated at BODC using CTD temperature data. The offset (CTD temperature - Underway temperature) was examined to see if it varied with time or temperature. Outliers, with high standard deviations, were identified and discarded. A significant correlation was found to exist between the offset and CTD temperature or time. Therefore the data correction is in the form of a regression equation (n = 129, standard deviation = 0.01361 with a P value of 0.000):
Regression equation:
Offset = -0.0805 + 0.00338 * CTD temperature
Therefore:
Calibrated underway temperature = (1.003391 * underway temperature) - 0.0807730
with an R2 value of 0.0%
-
Salinity
Salinity data were calibrated at BODC using 193 discrete TSG samples collected during the cruise. The offset (discrete TSG samples - underway salinity) was examined to determine if it varied with salinity or time. Outliers with high standard deviations were identified and removed. A significant correlation and trend existed between the offset and discrete TSG samples (n = 182, standard deviation = 0.004995, with a P value of 0.001) and so a regression equation was applied to calibrate this data:
Regression equation:
offset = 0.140 - 0.00381 * TSG discrete bottle samples
Therefore
Calibrated underway salinity = (0.996204 * underway salinity) + 0.139556
with an R2 value of 0.0%
-
Beam attenuation
Raw transmissometer data were converted to beam attenuation using the formulae:
c=-1/0.25 x ln(tr)
where
Tr=(Vsig-0.060)/(4.731-0.060)
-
Fluorescence
Fluorescence data were converted from raw voltages using the formulae:
CHL (µg/l) = 12.4 x (Output - 0.055)
No other processing methods were carried out by BODC.
Meteorology (HPMET)
Originator's processing
Meteorological data were taken from the ship's TECHSAS streams and formatted into MSTAR netCDF format. All times were defined as seconds from 00:00:00 01/01/2010.
Wind data were collected using a Gill Windsonic anemometer which was located on the ship's foremast. This instrument measured apparent wind speed and direction during the cruise.
Speed made good and course made good are calculated and, along with corrected heading and distance run, merged onto the same time stamps as the wind data from the anemometer. Wind speed and direction were corrected on board by the Originator to remove the effects of ship movement.
Port and starboard PAR and TIR sensors on the foremast and air pressure from the barometer in the main lab were logged to a separate TECHSAS file. These were then reformatted into MSTAR netCDF. Manufacturer's calibrations were applied to convert the data into physical units.
Humidity and air temperature were recorded using a Vaisala HMP45A probe located on the starboard side of the foremast. All data were logged using the TECHSAS system.
BODC processing
All 1 second meteorological data were transferred from an MSTAR format a into BODC internal format (a netCDF subset) to allow use of the in-house visualisation tool (EDSERPLO). Reformatting and data calibration was carried out, and is discussed below. Each data channel was visually inspected and any spikes or periods of dubious data flagged as suspect. The capabilities of the screening software allows comparative screening checks between channels.
All parameters were screened in EDSERPLO and suspect data were flagged.
Records from the port and starboard PAR and solar radiation channels were each merged into a single channel by taking the maximum of the port or starboard sensor value at every cycle to minimise shading effects.
Navigation and bathymetry (HPPLAT)
Originator's processing
Bathymetry data were taken from the ship's TECHSAS streams and formatted into MSTAR netCDF format. All times were defined as seconds from 00:00:00 01/01/2010. Depths from the echosounder were visualised and bad data replaced with NaNs. A Carter correction was then applied.
All navigational data were downloaded from the TECHSAS system. Data from the Ashtech GPS was used to correct the heading given by the gyro compass. The differences were calculated and then cleaned to produce a correction. This was then applied to the heading from the gyro compass.
BODC processing
All 1 second navigational data were transferred from an MSTAR format into a BODC internal format (a netCDF subset) to allow use of the in-house visualisation tool (EDSERPLO). Reformatting and data calibration was carried out, and is discussed below. Each data channel was visually inspected and any spikes or periods of dubious data flagged as suspect. The capabilities of the screening software allows comparative screening checks between channels.
All parameters were screened in EDSERPLO and suspect data were flagged.
Navigation was checked for gaps and improbable ship speeds at BODC. No improbable speeds were found and so no interpolation was required.
Distance run was recalculated using the clean latitude and longitude at BODC.
References
King, B.A., McCarthy, G., Hamersley, D.R.C. (ed.) (2012) RRS DiscoveryCruise D346, 05 Jan - 19 Feb 2011. The 2010 transatlantic hydrography section at 24.5 ° N. Southampton, UK, National Oceanography Centre, Southampton, 177pp. (National Oceanography Centre Southampton Cruise Report, 97-120).
Data quality report
Sea surface hydrography (HQUWAY)
Transmissometer: Noise is present in the transmissometer channel, mainly occurring between 18 January 2010 00:08:00 and 27 January 2010 21:44:00. There is also some uncertainty over the units assigned to this parameter by the Originator. The Originator provided these data to BODC with a unit of millivolts, however, further investigation shows that these original data might actually have been supplied in volts. These data should therefore be used with caution at the discretion of the user.
All other channels are of good quality with erroneous points marked suspect.
Meteorology (HQMET)
Negative solar radiation and PAR irradiance that occur at night have been flagged suspect.
Navigation and bathymetry (HQPLAT)
All channels are of good quality with erroneous points marked suspect.
BODC quality control flags
The following single character qualifying flags may be associated with one or more individual parameters within a data cycle:
| Flag | Description |
|---|---|
| Blank | Unqualified |
| < | Below detection limit |
| > | In excess of quoted value |
| A | Taxonomic flag for affinis (aff.) |
| B | Beginning of CTD Down/Up Cast |
| C | Taxonomic flag for confer (cf.) |
| D | Thermometric depth |
| E | End of CTD Down/Up Cast |
| H | Extrapolated value |
| I | Taxonomic flag for single species (sp.) |
| K | Improbable value - unknown quality control source |
| L | Improbable value - originator's quality control |
| M | Improbable value - BODC quality control |
| N | Null value |
| O | Improbable value - user quality control |
| P | Trace/calm |
| Q | Indeterminate |
| R | Replacement value |
| S | Estimated value |
| T | Interpolated value |
| U | Uncalibrated |
| W | Control value |
| X | Excessive difference |
Project Information
Oceans 2025 - The NERC Marine Centres' Strategic Research Programme 2007-2012
Who funds the programme?
The Natural Environment Research Council (NERC) funds the Oceans 2025 programme, which was originally planned in the context of NERC's 2002-2007 strategy and later realigned to NERC's subsequent strategy (Next Generation Science for Planet Earth; NERC 2007).
Who is involved in the programme?
The Oceans 2025 programme was designed by and is to be implemented through seven leading UK marine centres. The marine centres work together in coordination and are also supported by cooperation and input from government bodies, universities and other partners. The seven marine centres are:
- National Oceanography Centre, Southampton (NOCS)
- Plymouth Marine Laboratory (PML)
- Marine Biological Association (MBA)
- Sir Alister Hardy Foundation for Marine Science (SAHFOS)
- Proudman Oceanographic Laboratory (POL)
- Scottish Association for Marine Science (SAMS)
- Sea Mammal Research Unit (SMRU)
Oceans2025 provides funding to three national marine facilities, which provide services to the wider UK marine community, in addition to the Oceans 2025 community. These facilities are:
- British Oceanographic Data Centre (BODC), hosted at POL
- Permanent Service for Mean Sea Level (PSMSL), hosted at POL
- Culture Collection of Algae and Protozoa (CCAP), hosted at SAMS
The NERC-run Strategic Ocean Funding Initiative (SOFI) provides additional support to the programme by funding additional research projects and studentships that closely complement the Oceans 2025 programme, primarily through universities.
What is the programme about?
Oceans 2025 sets out to address some key challenges that face the UK as a result of a changing marine environment. The research funded through the programme sets out to increase understanding of the size, nature and impacts of these changes, with the aim to:
- improve knowledge of how the seas behave, not just now but in the future;
- help assess what that might mean for the Earth system and for society;
- assist in developing sustainable solutions for the management of marine resources for future generations;
- enhance the research capabilities and facilities available for UK marine science.
In order to address these aims there are nine science themes supported by the Oceans 2025 programme:
- Climate, circulation and sea level (Theme 1)
- Marine biogeochemical cycles (Theme 2)
- Shelf and coastal processes (Theme 3)
- Biodiversity and ecosystem functioning (Theme 4)
- Continental margins and deep ocean (Theme 5)
- Sustainable marine resources (Theme 6)
- Technology development (Theme 8)
- Next generation ocean prediction (Theme 9)
- Integration of sustained observations in the marine environment (Theme 10)
In the original programme proposal there was a theme on health and human impacts (Theme 7). The elements of this Theme have subsequently been included in Themes 3 and 9.
When is the programme active?
The programme started in April 2007 with funding for 5 years.
Brief summary of the programme fieldwork/data
Programme fieldwork and data collection are to be achieved through:
- physical, biological and chemical parameters sampling throughout the North and South Atlantic during collaborative research cruises aboard NERC's research vessels RRS Discovery, RRS James Cook and RRS James Clark Ross;
- the Continuous Plankton Recorder being deployed by SAHFOS in the North Atlantic and North Pacific on 'ships of opportunity';
- physical parameters measured and relayed in near real-time by fixed moorings and ARGO floats;
- coastal and shelf sea observatory data (Liverpool Bay Coastal Observatory (LBCO) and Western Channel Observatory (WCO)) using the RV Prince Madog and RV Quest.
The data is to be fed into models for validation and future projections. Greater detail can be found in the Theme documents.
Oceans 2025 Theme 1: Climate, Ocean Circulation and Sea Level
Through fieldwork, analysis and modelling, Theme 1 will provide detailed knowledge of how the Atlantic, Arctic and Southern Oceans are responding to, and driving, climate change. In combination with geodetic studies, it will also improve our ability to predict global sea level and UK land movements in the century ahead.
The official Oceans 2025 documentation for this Theme is available from the following link: Oceans 2025 Theme 1
Weblink: http://www.oceans2025.org/
Data Activity or Cruise Information
Cruise
| Cruise Name | D346 |
| Departure Date | 2010-01-05 |
| Arrival Date | 2010-02-19 |
| Principal Scientist(s) | Brian A King (National Oceanography Centre, Southampton) |
| Ship | RRS Discovery |
Complete Cruise Metadata Report is available here
Fixed Station Information
No Fixed Station Information held for the Series
BODC Quality Control Flags
The following single character qualifying flags may be associated with one or more individual parameters with a data cycle:
| Flag | Description |
|---|---|
| Blank | Unqualified |
| < | Below detection limit |
| > | In excess of quoted value |
| A | Taxonomic flag for affinis (aff.) |
| B | Beginning of CTD Down/Up Cast |
| C | Taxonomic flag for confer (cf.) |
| D | Thermometric depth |
| E | End of CTD Down/Up Cast |
| G | Non-taxonomic biological characteristic uncertainty |
| H | Extrapolated value |
| I | Taxonomic flag for single species (sp.) |
| K | Improbable value - unknown quality control source |
| L | Improbable value - originator's quality control |
| M | Improbable value - BODC quality control |
| N | Null value |
| O | Improbable value - user quality control |
| P | Trace/calm |
| Q | Indeterminate |
| R | Replacement value |
| S | Estimated value |
| T | Interpolated value |
| U | Uncalibrated |
| W | Control value |
| X | Excessive difference |
SeaDataNet Quality Control Flags
The following single character qualifying flags may be associated with one or more individual parameters with a data cycle:
| Flag | Description |
|---|---|
| 0 | no quality control |
| 1 | good value |
| 2 | probably good value |
| 3 | probably bad value |
| 4 | bad value |
| 5 | changed value |
| 6 | value below detection |
| 7 | value in excess |
| 8 | interpolated value |
| 9 | missing value |
| A | value phenomenon uncertain |
| B | nominal value |
| Q | value below limit of quantification |
