Metadata Report for BODC Series Reference Number 252392
Metadata Summary
Problem Reports
Data Access Policy
Narrative Documents
Project Information
Data Activity or Cruise Information
Fixed Station Information
BODC Quality Flags
SeaDataNet Quality Flags
Metadata Summary
Data Description |
|||||||||||||||||||||||||
|
|||||||||||||||||||||||||
Data Identifiers |
|||||||||||||||||||||||||
|
|||||||||||||||||||||||||
Time Co-ordinates(UT) |
|||||||||||||||||||||||||
|
|||||||||||||||||||||||||
Spatial Co-ordinates | |||||||||||||||||||||||||
|
|||||||||||||||||||||||||
Parameters |
|||||||||||||||||||||||||
|
|||||||||||||||||||||||||
|
|||||||||||||||||||||||||
Problem Reports
No Problem Report Found in the Database
Data Access Policy
Open Data supplied by Natural Environment Research Council (NERC)
You must always use the following attribution statement to acknowledge the source of the information: "Contains data supplied by Natural Environment Research Council."
Narrative Documents
Bissett-Bermann 9040 Conductivity Temperature and Depth
The basic configuration of the B-B 9040 CTD incorporates pressure, temperature and conductivity sensors which could be logged digitally. This system also made it possible to derive other parameters, such as salinity, depth and sound velocity.
The instrument was versatile and it was possible to attach a dissolved oxygen sensor or to change the CTD housing, allowing it to obtain data from deeper layers in the water column. The accuracy for salinity is ±0.02 ppt , and ±0.02°C for temperature.
This instrument was also known as the Plessey 9040.
RRS Challenger Cruise 22/87 CTD Data Documentation
Introduction
Documentation for the CTD data collected on RRS Challenger Cruise 22/87 (November-December 1987) by the Scottish Marine Biological Association, Oban, Argyll, Scotland, UK, under the direction of D. J. Ellett.
Instrumentation
The instrument used was a Bissett Berman 9040 CTD system and the data were logged on a Hewlett Packard 9820 and stored in an integer format. Instrument lowering and raising speeds were between 0.5 m/s and 1 m/s. An acoustic pinger was placed above the CTD to give an accurate depth measurement, this could then be used to check the CTD pressure calibration. An NIO bottle with reversing thermometers was placed above the pinger, within 2m of the CTD system. A bottle sample was taken at the bottom of the cast providing the temperature and salinity are uniform at that point. If large temperature or salinity gradients were present then the bottle sample was triggered at a suitable site on the upcast. A surface salinity sample was also taken at the start of the dip.
Calibration
The CTD was not calibrated in the laboratory. The manufacturer's calibration was used and water samples taken to check the calibration and apply corrections where necessary.
Temperature
The manufacturer's calibration was used to convert the raw data to to physical units using the equation below:
Temperature (°C) = (106/Pt -2238.68/55.84)
where Pt is the temperature period in microseconds
These values were then plotted against the water bottle (i.e. reversing thermometer) temperatures and a regression line fitted to the data such that:
Temperature(WB) = m x Temperature(CTD) + c
Then the regression coefficients (m and c) were applied to correct the CTD temperature data - these are given in the table below.
Conductivity
The manufacturer's calibration was used to convert the raw data to to physical units using the equation below:
Conductivity (mmho/cm) = (106/Pc - 4995)/58.12 + 10
where Pc is the conductivity period in microseconds
The water bottle salinities and corrected CTD temperatures were used to calculate the water bottle conductivity values. These values were then plotted against the CTD conductivities and a regression line fitted to the data such that:
Conductivity(WB) = m x Conductivity(CTD) + c
Then the regression coefficients were applied to correct the CTD conductivity data - these are given in the table below.
Pressure
The depths from the acoustic pinger were noted where the bottle samples were taken and then used to check the calibration of the pressure sensor - unless calibration values were available from the reversing thermometers. The equation below was used to convert the pressure period to physical units.
Pressure = (106/Pd - 9712)/0.26267
where Pd is the pressure period in microseconds
A regression fit was carried out using the calibration values and the slope and intercept determined. The pressure values could then be corrected using:
Pressure (CORR) = m x Pressure(CTD) + c
The fit of the CTD data to the water bottle calibration data is given in the table below:
| Variable | Slope (m) | Intercept (c) |
|---|---|---|
| Temperature (°C) | 0.9960931 | 0.077843 |
| Conductivity (mmho/cm) | 1.0146160 | -0.502686 |
| Pressure (dbar) | 1.0404258 | 15.153070 |
Data processing
Obvious wild points were edited out of the calibration file and the calibration programs run to obtain values for the slopes and intercepts for temperature, pressure and conductivity. These were then applied to the uncalibrated data. Conductivities were converted to conductivity ratios and then converted to salinities using UNESCO recommended routines and sigma-t was calculated. The data values were then sieved to ensure a minimum separation between pressure values of 1 dbar. The data were then visually inspected and major spikes flagged.
References
Fofonoff, N.P. and Millard Jr., R.C. (1983).
Algorithms for the computation of fundamental properties of sea water. UNESCO Technical Paper on Marine Science 44.
Project Information
No Project Information held for the Series
Data Activity or Cruise Information
Cruise
| Cruise Name | CH22 |
| Departure Date | 1987-11-23 |
| Arrival Date | 1987-12-05 |
| Principal Scientist(s) | David J Ellett (Scottish Marine Biological Association) |
| Ship | RRS Challenger |
Complete Cruise Metadata Report is available here
Fixed Station Information
Fixed Station Information
| Station Name | DML Line J Station 4J |
| Category | Offshore location |
| Latitude | 58° 14.00' N |
| Longitude | 7° 46.50' W |
| Water depth below MSL | 52.0 m |
DML Station 4J
Station 4J is one of nine fixed CTD stations crossing the Hebridean Shelf from Loch Resort on the Isle of Lewis, Scotland. The station was established by scientists at Dunstaffnage Marine Laboratory (DML).
Related Fixed Station activities are detailed in Appendix 1
Fixed Station Information
| Station Name | DML Outer Hebrides STD/CTD Sections |
| Category | Offshore area |
| Latitude | 58° 15.25' N |
| Longitude | 8° 5.75' W |
| Water depth below MSL |
DML Outer Hebrides STD/CTD Sections
The shelf area to the north and west of the Scottish Outer Hebrides has been extensively surveyed since the mid 1970s by numerous research and government institutes. The region contains several repeated hydrographic stations, which collectively form transects. These repeated survey transects represent the northern part of a greater network of similar sections on the western Scottish continental shelf, which were established by Dunstaffnage Marine Laboratory (DML).
Map of standard Outer Hebrides STD/CTD Stations
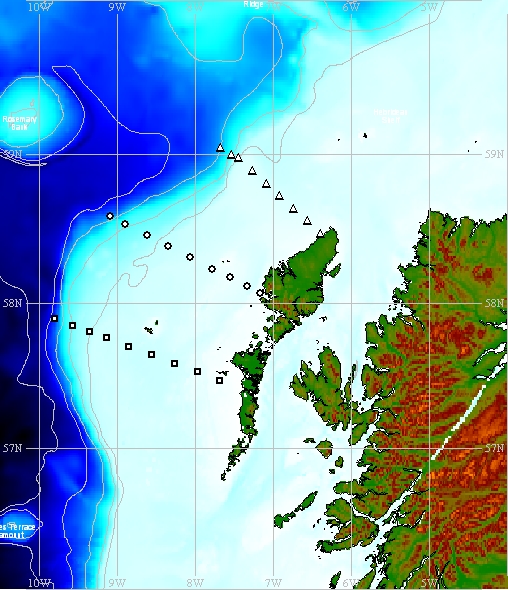
Map produced using the GEBCO Digital Atlas.
The triangles indicate the nominal positions of individual Line M stations; nominal positions of Line J and BN stations are shown by the circles and squares respectively. Measurements made at repeated Outer Hebrides STD/CTD stations lie within a box bounded by co-ordinates 57.467° N, 9.8° W at the south west corner and 59.042° N, 6.392° W at the north east corner.
Nominal station details:
DML Line M: North Lewis (Scotland) - Hebridean Shelf Edge (Scotland)
DML Line J: Loch Resort, Lewis (Scotland) - Hebridean Shelf Edge (Scotland)
DML Line BN: Monach Islands (Scotland) - St Kilda/Hebridean Shelf Edge (Scotland)
Related Fixed Station activities are detailed in Appendix 2
Fixed Station Information
| Station Name | DML Line J |
| Category | Offshore route/traverse |
DML Line J
Line J is a survey section heading north west across the Hebridean Shelf from Loch Resort on the Isle of Lewis (Scotland). The line comprises nine fixed CTD stations, which were established as part of routine monitoring work on the Scottish continental shelf by Dunstaffnage Marine Laboratory (DML). Line J was occupied during the late 1970s and in the 1980s.
Nominal station details
DML Line J: Lewis (Scotland) - Hebridean Shelf Edge (Scotland)
| Station | Nominal latitude | Nominal longitude | Approx. depth (m) | Comment |
|---|---|---|---|---|
| 1J | 58° 04.0' N | 07° 10.0' W | 35 | Loch Resort, Isle of Lewis |
| 2J | 58° 07.0' N | 07° 20.0' W | 105 | |
| 3J | 58° 10.5' N | 07° 33.0' W | 50 | South of Flannan Isles |
| 4J | 58° 14.0' N | 07° 46.5' W | 52 | South west of Flannan Isles |
| 5J | 58° 18.5' N | 08° 03.5' W | 120 | |
| 6J | 58° 23.0' N | 08° 20.5' W | 165 | |
| 7J | 58° 27.5' N | 08° 37.0' W | 350 | |
| 8J | 58° 32.0' N | 08° 54.0' W | 580 | |
| 9J | 58° 35.0' N | 09° 05.0' W | 1200 |
Related Fixed Station activities are detailed in Appendix 3
BODC Quality Control Flags
The following single character qualifying flags may be associated with one or more individual parameters with a data cycle:
| Flag | Description |
|---|---|
| Blank | Unqualified |
| < | Below detection limit |
| > | In excess of quoted value |
| A | Taxonomic flag for affinis (aff.) |
| B | Beginning of CTD Down/Up Cast |
| C | Taxonomic flag for confer (cf.) |
| D | Thermometric depth |
| E | End of CTD Down/Up Cast |
| G | Non-taxonomic biological characteristic uncertainty |
| H | Extrapolated value |
| I | Taxonomic flag for single species (sp.) |
| K | Improbable value - unknown quality control source |
| L | Improbable value - originator's quality control |
| M | Improbable value - BODC quality control |
| N | Null value |
| O | Improbable value - user quality control |
| P | Trace/calm |
| Q | Indeterminate |
| R | Replacement value |
| S | Estimated value |
| T | Interpolated value |
| U | Uncalibrated |
| W | Control value |
| X | Excessive difference |
SeaDataNet Quality Control Flags
The following single character qualifying flags may be associated with one or more individual parameters with a data cycle:
| Flag | Description |
|---|---|
| 0 | no quality control |
| 1 | good value |
| 2 | probably good value |
| 3 | probably bad value |
| 4 | bad value |
| 5 | changed value |
| 6 | value below detection |
| 7 | value in excess |
| 8 | interpolated value |
| 9 | missing value |
| A | value phenomenon uncertain |
| B | nominal value |
| Q | value below limit of quantification |
Appendix 1: DML Line J Station 4J
Related series for this Fixed Station are presented in the table below. Further information can be found by following the appropriate links.
If you are interested in these series, please be aware we offer a multiple file download service. Should your credentials be insufficient for automatic download, the service also offers a referral to our Enquiries Officer who may be able to negotiate access.
| Series Identifier | Data Category | Start date/time | Start position | Cruise |
|---|---|---|---|---|
| 191918 | CTD or STD cast | 1981-07-10 08:15:00 | 58.2483 N, 7.7916 W | RRS Challenger CH10/81 |
| 193753 | CTD or STD cast | 1983-05-28 00:15:00 | 58.2333 N, 7.7833 W | RRS Challenger CH7B/83 |
| 97175 | CTD or STD cast | 1983-08-20 17:08:00 | 58.2316 N, 7.7833 W | RRS Challenger CH11/83 |
| 313529 | CTD or STD cast | 1984-07-01 08:16:00 | 58.235 N, 7.7767 W | RRS Challenger CH2/84 |
| 254233 | CTD or STD cast | 1985-05-11 12:14:00 | 58.2333 N, 7.775 W | RRS Challenger CH4/85 |
| 261499 | CTD or STD cast | 1985-08-23 12:03:00 | 58.2333 N, 7.775 W | RRS Challenger CH8/85 |
| 251493 | CTD or STD cast | 1987-11-26 19:16:00 | 58.2333 N, 7.775 W | RRS Challenger CH22 |
| 266812 | CTD or STD cast | 1988-03-05 02:32:00 | 58.2316 N, 7.7783 W | RRS Challenger CH25 |
Appendix 2: DML Outer Hebrides STD/CTD Sections
Related series for this Fixed Station are presented in the table below. Further information can be found by following the appropriate links.
If you are interested in these series, please be aware we offer a multiple file download service. Should your credentials be insufficient for automatic download, the service also offers a referral to our Enquiries Officer who may be able to negotiate access.
| Series Identifier | Data Category | Start date/time | Start position | Cruise |
|---|---|---|---|---|
| 89716 | CTD or STD cast | 1975-09-01 06:41:00 | 57.8666 N, 9.5666 W | RRS Challenger CH12A/75 |
| 89728 | CTD or STD cast | 1975-09-01 07:49:00 | 57.8216 N, 9.345 W | RRS Challenger CH12A/75 |
| 89741 | CTD or STD cast | 1975-09-01 09:00:00 | 57.7666 N, 9.1333 W | RRS Challenger CH12A/75 |
| 90324 | CTD or STD cast | 1975-11-10 18:20:00 | 57.92 N, 9.7833 W | RRS Challenger CH14A/75 |
| 90336 | CTD or STD cast | 1975-11-10 20:25:00 | 57.8666 N, 9.5666 W | RRS Challenger CH14A/75 |
| 90348 | CTD or STD cast | 1975-11-10 22:38:00 | 57.815 N, 9.3466 W | RRS Challenger CH14A/75 |
| 93414 | CTD or STD cast | 1977-07-03 17:41:00 | 57.555 N, 8.2816 W | RRS Challenger CH10/77 |
| 93426 | CTD or STD cast | 1977-07-03 21:24:00 | 57.4666 N, 7.66 W | RRS Challenger CH10/77 |
| 92693 | CTD or STD cast | 1978-02-08 08:30:00 | 57.47 N, 7.6566 W | RRS Challenger CH2/78 |
| 92700 | CTD or STD cast | 1978-02-08 09:59:00 | 57.5333 N, 7.9666 W | RRS Challenger CH2/78 |
| 92712 | CTD or STD cast | 1978-02-08 11:20:00 | 57.5916 N, 8.2583 W | RRS Challenger CH2/78 |
| 92724 | CTD or STD cast | 1978-02-08 13:02:00 | 57.6433 N, 8.55 W | RRS Challenger CH2/78 |
| 92736 | CTD or STD cast | 1978-02-08 14:35:00 | 57.7016 N, 8.8416 W | RRS Challenger CH2/78 |
| 92748 | CTD or STD cast | 1978-02-08 15:40:00 | 57.77 N, 9.1333 W | RRS Challenger CH2/78 |
| 92761 | CTD or STD cast | 1978-02-08 17:04:00 | 57.7966 N, 9.345 W | RRS Challenger CH2/78 |
| 92773 | CTD or STD cast | 1978-02-08 18:10:00 | 57.855 N, 9.5533 W | RRS Challenger CH2/78 |
| 92785 | CTD or STD cast | 1978-02-08 19:30:00 | 57.91 N, 9.8016 W | RRS Challenger CH2/78 |
| 92828 | CTD or STD cast | 1978-02-09 06:40:00 | 58.5666 N, 9.0333 W | RRS Challenger CH2/78 |
| 94687 | CTD or STD cast | 1978-04-18 12:20:00 | 57.5316 N, 7.9716 W | RRS Challenger CH6/78 |
| 94699 | CTD or STD cast | 1978-04-18 13:48:00 | 57.585 N, 8.26 W | RRS Challenger CH6/78 |
| 94706 | CTD or STD cast | 1978-04-18 15:27:00 | 57.635 N, 8.5683 W | RRS Challenger CH6/78 |
| 94731 | CTD or STD cast | 1978-04-18 18:32:00 | 57.76 N, 9.11 W | RRS Challenger CH6/78 |
| 94767 | CTD or STD cast | 1978-04-18 22:25:00 | 57.9416 N, 9.785 W | RRS Challenger CH6/78 |
| 95470 | CTD or STD cast | 1978-06-07 12:01:00 | 57.5283 N, 7.97 W | RRS Challenger CH9/78 |
| 95482 | CTD or STD cast | 1978-06-07 13:40:00 | 57.58 N, 8.2666 W | RRS Challenger CH9/78 |
| 95494 | CTD or STD cast | 1978-06-07 15:22:00 | 57.6466 N, 8.5333 W | RRS Challenger CH9/78 |
| 95501 | CTD or STD cast | 1978-06-07 17:11:00 | 57.7083 N, 8.845 W | RRS Challenger CH9/78 |
| 95525 | CTD or STD cast | 1978-06-07 20:29:00 | 57.8166 N, 9.3483 W | RRS Challenger CH9/78 |
| 95537 | CTD or STD cast | 1978-06-07 22:05:00 | 57.865 N, 9.5566 W | RRS Challenger CH9/78 |
| 95549 | CTD or STD cast | 1978-06-07 23:40:00 | 57.9166 N, 9.7733 W | RRS Challenger CH9/78 |
| 99735 | CTD or STD cast | 1979-06-26 14:05:00 | 58.5866 N, 9.0416 W | RRS Shackleton S5/79 |
| 99920 | CTD or STD cast | 1979-06-28 14:25:00 | 57.4633 N, 7.6866 W | RRS Shackleton S5/79 |
| 99932 | CTD or STD cast | 1979-06-28 16:18:00 | 57.5333 N, 7.9616 W | RRS Shackleton S5/79 |
| 99944 | CTD or STD cast | 1979-06-28 17:58:00 | 57.5966 N, 8.2466 W | RRS Shackleton S5/79 |
| 189834 | CTD or STD cast | 1980-06-03 10:20:00 | 57.5316 N, 7.9733 W | RRS Challenger CH9B/80 |
| 189871 | CTD or STD cast | 1980-06-03 16:38:00 | 57.705 N, 8.8533 W | RRS Challenger CH9B/80 |
| 189883 | CTD or STD cast | 1980-06-03 18:47:00 | 57.7566 N, 9.13 W | RRS Challenger CH9B/80 |
| 189895 | CTD or STD cast | 1980-06-03 20:47:00 | 57.8083 N, 9.3516 W | RRS Challenger CH9B/80 |
| 186271 | CTD or STD cast | 1980-09-21 20:32:00 | 57.4666 N, 7.6666 W | RRS Challenger CH14B/80 |
| 186283 | CTD or STD cast | 1980-09-21 22:45:00 | 57.5333 N, 7.9666 W | RRS Challenger CH14B/80 |
| 186295 | CTD or STD cast | 1980-09-22 00:45:00 | 57.5833 N, 8.25 W | RRS Challenger CH14B/80 |
| 186302 | CTD or STD cast | 1980-09-22 03:15:00 | 57.65 N, 8.55 W | RRS Challenger CH14B/80 |
| 186314 | CTD or STD cast | 1980-09-22 05:36:00 | 57.7 N, 8.8333 W | RRS Challenger CH14B/80 |
| 186326 | CTD or STD cast | 1980-09-22 10:50:00 | 57.7666 N, 9.1333 W | RRS Challenger CH14B/80 |
| 186338 | CTD or STD cast | 1980-09-22 12:48:00 | 57.8166 N, 9.35 W | RRS Challenger CH14B/80 |
| 186363 | CTD or STD cast | 1980-09-22 15:45:00 | 57.9333 N, 9.7666 W | RRS Challenger CH14B/80 |
| 188591 | CTD or STD cast | 1981-04-22 12:53:00 | 57.5366 N, 7.9633 W | RRS Challenger CH6B/81 |
| 188609 | CTD or STD cast | 1981-04-22 14:21:00 | 57.5883 N, 8.2566 W | RRS Challenger CH6B/81 |
| 188610 | CTD or STD cast | 1981-04-22 15:45:00 | 57.65 N, 8.545 W | RRS Challenger CH6B/81 |
| 188622 | CTD or STD cast | 1981-04-22 17:15:00 | 57.71 N, 8.8483 W | RRS Challenger CH6B/81 |
| 188634 | CTD or STD cast | 1981-04-22 18:39:00 | 57.7683 N, 9.13 W | RRS Challenger CH6B/81 |
| 188646 | CTD or STD cast | 1981-04-22 20:13:00 | 57.8183 N, 9.35 W | RRS Challenger CH6B/81 |
| 188658 | CTD or STD cast | 1981-04-22 21:18:00 | 57.8683 N, 9.565 W | RRS Challenger CH6B/81 |
| 188671 | CTD or STD cast | 1981-04-22 23:01:00 | 57.9283 N, 9.8 W | RRS Challenger CH6B/81 |
| 191802 | CTD or STD cast | 1981-07-09 19:09:00 | 58.4783 N, 6.4116 W | RRS Challenger CH10/81 |
| 191826 | CTD or STD cast | 1981-07-09 20:56:00 | 58.6 N, 6.5983 W | RRS Challenger CH10/81 |
| 191838 | CTD or STD cast | 1981-07-09 21:51:00 | 58.6483 N, 6.7116 W | RRS Challenger CH10/81 |
| 191918 | CTD or STD cast | 1981-07-10 08:15:00 | 58.2483 N, 7.7916 W | RRS Challenger CH10/81 |
| 193636 | CTD or STD cast | 1983-05-26 19:22:00 | 57.865 N, 9.5633 W | RRS Challenger CH7B/83 |
| 193648 | CTD or STD cast | 1983-05-26 21:40:00 | 57.8166 N, 9.35 W | RRS Challenger CH7B/83 |
| 193661 | CTD or STD cast | 1983-05-27 01:23:00 | 57.705 N, 8.8366 W | RRS Challenger CH7B/83 |
| 193673 | CTD or STD cast | 1983-05-27 08:00:00 | 57.65 N, 8.5483 W | RRS Challenger CH7B/83 |
| 193685 | CTD or STD cast | 1983-05-27 09:57:00 | 57.5833 N, 8.2483 W | RRS Challenger CH7B/83 |
| 193697 | CTD or STD cast | 1983-05-27 12:15:00 | 57.5316 N, 7.98 W | RRS Challenger CH7B/83 |
| 193704 | CTD or STD cast | 1983-05-27 14:00:00 | 57.4683 N, 7.6883 W | RRS Challenger CH7B/83 |
| 193716 | CTD or STD cast | 1983-05-27 20:26:00 | 58.0733 N, 7.1416 W | RRS Challenger CH7B/83 |
| 193728 | CTD or STD cast | 1983-05-27 21:24:00 | 58.1166 N, 7.3333 W | RRS Challenger CH7B/83 |
| 193741 | CTD or STD cast | 1983-05-27 22:46:00 | 58.1766 N, 7.5483 W | RRS Challenger CH7B/83 |
| 193753 | CTD or STD cast | 1983-05-28 00:15:00 | 58.2333 N, 7.7833 W | RRS Challenger CH7B/83 |
| 193765 | CTD or STD cast | 1983-05-28 01:50:00 | 58.3083 N, 8.0583 W | RRS Challenger CH7B/83 |
| 193777 | CTD or STD cast | 1983-05-28 03:24:00 | 58.3866 N, 8.345 W | RRS Challenger CH7B/83 |
| 193789 | CTD or STD cast | 1983-05-28 04:55:00 | 58.4583 N, 8.6166 W | RRS Challenger CH7B/83 |
| 193790 | CTD or STD cast | 1983-05-28 06:31:00 | 58.535 N, 8.8966 W | RRS Challenger CH7B/83 |
| 97095 | CTD or STD cast | 1983-08-19 22:33:00 | 57.8683 N, 9.57 W | RRS Challenger CH11/83 |
| 97102 | CTD or STD cast | 1983-08-20 00:26:00 | 57.8183 N, 9.3416 W | RRS Challenger CH11/83 |
| 97114 | CTD or STD cast | 1983-08-20 01:41:00 | 57.7666 N, 9.1333 W | RRS Challenger CH11/83 |
| 193882 | CTD or STD cast | 1983-08-20 03:37:00 | 57.7083 N, 8.8333 W | RRS Challenger CH11/83 |
| 97126 | CTD or STD cast | 1983-08-20 05:17:00 | 57.6533 N, 8.5383 W | RRS Challenger CH11/83 |
| 97138 | CTD or STD cast | 1983-08-20 12:17:00 | 58.075 N, 7.1666 W | RRS Challenger CH11/83 |
| 97151 | CTD or STD cast | 1983-08-20 13:22:00 | 58.1166 N, 7.3333 W | RRS Challenger CH11/83 |
| 97163 | CTD or STD cast | 1983-08-20 15:47:00 | 58.1783 N, 7.5566 W | RRS Challenger CH11/83 |
| 97175 | CTD or STD cast | 1983-08-20 17:08:00 | 58.2316 N, 7.7833 W | RRS Challenger CH11/83 |
| 193894 | CTD or STD cast | 1983-08-20 18:41:00 | 58.3116 N, 8.06 W | RRS Challenger CH11/83 |
| 97187 | CTD or STD cast | 1983-08-20 20:31:00 | 58.385 N, 8.3416 W | RRS Challenger CH11/83 |
| 97199 | CTD or STD cast | 1983-08-20 22:02:00 | 58.4583 N, 8.6166 W | RRS Challenger CH11/83 |
| 97206 | CTD or STD cast | 1983-08-21 00:15:00 | 58.535 N, 8.895 W | RRS Challenger CH11/83 |
| 97231 | CTD or STD cast | 1983-08-21 13:32:00 | 59.0583 N, 7.67 W | RRS Challenger CH11/83 |
| 97267 | CTD or STD cast | 1983-08-21 19:13:00 | 58.8933 N, 7.2666 W | RRS Challenger CH11/83 |
| 97279 | CTD or STD cast | 1983-08-21 20:27:00 | 58.8083 N, 7.1233 W | RRS Challenger CH11/83 |
| 97280 | CTD or STD cast | 1983-08-21 21:51:00 | 58.7233 N, 6.9166 W | RRS Challenger CH11/83 |
| 97292 | CTD or STD cast | 1983-08-21 23:09:00 | 58.6416 N, 6.7416 W | RRS Challenger CH11/83 |
| 97311 | CTD or STD cast | 1983-08-22 00:25:00 | 58.5683 N, 6.5666 W | RRS Challenger CH11/83 |
| 97323 | CTD or STD cast | 1983-08-22 01:50:00 | 58.475 N, 6.3916 W | RRS Challenger CH11/83 |
| 313413 | CTD or STD cast | 1984-06-30 09:55:00 | 57.915 N, 9.8017 W | RRS Challenger CH2/84 |
| 313425 | CTD or STD cast | 1984-06-30 12:40:00 | 57.8667 N, 9.5683 W | RRS Challenger CH2/84 |
| 313437 | CTD or STD cast | 1984-06-30 13:59:00 | 57.815 N, 9.35 W | RRS Challenger CH2/84 |
| 313449 | CTD or STD cast | 1984-06-30 15:47:00 | 57.765 N, 9.1333 W | RRS Challenger CH2/84 |
| 313450 | CTD or STD cast | 1984-06-30 17:14:00 | 57.7083 N, 8.8383 W | RRS Challenger CH2/84 |
| 313462 | CTD or STD cast | 1984-06-30 19:09:00 | 57.6517 N, 8.5517 W | RRS Challenger CH2/84 |
| 313474 | CTD or STD cast | 1984-06-30 20:47:00 | 57.585 N, 8.2583 W | RRS Challenger CH2/84 |
| 313486 | CTD or STD cast | 1984-06-30 22:51:00 | 57.5383 N, 7.975 W | RRS Challenger CH2/84 |
| 313498 | CTD or STD cast | 1984-07-01 04:19:00 | 58.0717 N, 7.1883 W | RRS Challenger CH2/84 |
| 313505 | CTD or STD cast | 1984-07-01 05:16:00 | 58.1133 N, 7.335 W | RRS Challenger CH2/84 |
| 313517 | CTD or STD cast | 1984-07-01 07:01:00 | 58.175 N, 7.55 W | RRS Challenger CH2/84 |
| 313529 | CTD or STD cast | 1984-07-01 08:16:00 | 58.235 N, 7.7767 W | RRS Challenger CH2/84 |
| 313530 | CTD or STD cast | 1984-07-01 09:54:00 | 58.3083 N, 8.0583 W | RRS Challenger CH2/84 |
| 313542 | CTD or STD cast | 1984-07-01 11:26:00 | 58.3833 N, 8.3383 W | RRS Challenger CH2/84 |
| 313554 | CTD or STD cast | 1984-07-01 13:00:00 | 58.4617 N, 8.6133 W | RRS Challenger CH2/84 |
| 313566 | CTD or STD cast | 1984-07-01 14:34:00 | 58.535 N, 8.895 W | RRS Challenger CH2/84 |
| 313578 | CTD or STD cast | 1984-07-01 21:53:00 | 59.0517 N, 7.6733 W | RRS Challenger CH2/84 |
| 313591 | CTD or STD cast | 1984-07-01 23:14:00 | 59.0033 N, 7.5317 W | RRS Challenger CH2/84 |
| 313609 | CTD or STD cast | 1984-07-02 00:08:00 | 58.9783 N, 7.4483 W | RRS Challenger CH2/84 |
| 313610 | CTD or STD cast | 1984-07-02 04:32:00 | 58.8933 N, 7.265 W | RRS Challenger CH2/84 |
| 313622 | CTD or STD cast | 1984-07-02 05:45:00 | 58.8083 N, 7.0883 W | RRS Challenger CH2/84 |
| 313634 | CTD or STD cast | 1984-07-02 06:54:00 | 58.725 N, 6.9133 W | RRS Challenger CH2/84 |
| 313646 | CTD or STD cast | 1984-07-02 08:12:00 | 58.6433 N, 6.74 W | RRS Challenger CH2/84 |
| 313658 | CTD or STD cast | 1984-07-02 09:11:00 | 58.56 N, 6.565 W | RRS Challenger CH2/84 |
| 313671 | CTD or STD cast | 1984-07-02 10:20:00 | 58.4767 N, 6.3883 W | RRS Challenger CH2/84 |
| 254097 | CTD or STD cast | 1985-05-10 14:08:00 | 57.9216 N, 9.7966 W | RRS Challenger CH4/85 |
| 254104 | CTD or STD cast | 1985-05-10 15:58:00 | 57.8666 N, 9.5633 W | RRS Challenger CH4/85 |
| 254116 | CTD or STD cast | 1985-05-10 17:16:00 | 57.8183 N, 9.3483 W | RRS Challenger CH4/85 |
| 254128 | CTD or STD cast | 1985-05-10 18:44:00 | 57.7633 N, 9.1216 W | RRS Challenger CH4/85 |
| 254141 | CTD or STD cast | 1985-05-10 20:12:00 | 57.7066 N, 8.8433 W | RRS Challenger CH4/85 |
| 254153 | CTD or STD cast | 1985-05-10 21:45:00 | 57.65 N, 8.5516 W | RRS Challenger CH4/85 |
| 254165 | CTD or STD cast | 1985-05-10 23:20:00 | 57.5833 N, 8.2583 W | RRS Challenger CH4/85 |
| 254177 | CTD or STD cast | 1985-05-11 00:50:00 | 57.5333 N, 7.975 W | RRS Challenger CH4/85 |
| 254189 | CTD or STD cast | 1985-05-11 02:31:00 | 57.4666 N, 7.675 W | RRS Challenger CH4/85 |
| 254190 | CTD or STD cast | 1985-05-11 08:18:00 | 58.07 N, 7.17 W | RRS Challenger CH4/85 |
| 254208 | CTD or STD cast | 1985-05-11 09:19:00 | 58.1166 N, 7.3316 W | RRS Challenger CH4/85 |
| 254221 | CTD or STD cast | 1985-05-11 10:52:00 | 58.175 N, 7.5466 W | RRS Challenger CH4/85 |
| 254233 | CTD or STD cast | 1985-05-11 12:14:00 | 58.2333 N, 7.775 W | RRS Challenger CH4/85 |
| 254245 | CTD or STD cast | 1985-05-11 13:48:00 | 58.3083 N, 8.0583 W | RRS Challenger CH4/85 |
| 254257 | CTD or STD cast | 1985-05-11 15:30:00 | 58.3816 N, 8.3366 W | RRS Challenger CH4/85 |
| 254269 | CTD or STD cast | 1985-05-11 17:12:00 | 58.4583 N, 8.615 W | RRS Challenger CH4/85 |
| 254270 | CTD or STD cast | 1985-05-11 18:51:00 | 58.53 N, 8.8916 W | RRS Challenger CH4/85 |
| 254282 | CTD or STD cast | 1985-05-12 00:34:00 | 59.0416 N, 7.6666 W | RRS Challenger CH4/85 |
| 254294 | CTD or STD cast | 1985-05-12 01:52:00 | 59.0 N, 7.53 W | RRS Challenger CH4/85 |
| 254301 | CTD or STD cast | 1985-05-12 02:43:00 | 58.975 N, 7.45 W | RRS Challenger CH4/85 |
| 254313 | CTD or STD cast | 1985-05-12 03:56:00 | 58.8866 N, 7.2833 W | RRS Challenger CH4/85 |
| 254325 | CTD or STD cast | 1985-05-12 05:10:00 | 58.8033 N, 7.095 W | RRS Challenger CH4/85 |
| 254337 | CTD or STD cast | 1985-05-12 06:20:00 | 58.725 N, 6.9166 W | RRS Challenger CH4/85 |
| 254349 | CTD or STD cast | 1985-05-12 07:31:00 | 58.6416 N, 6.7416 W | RRS Challenger CH4/85 |
| 254350 | CTD or STD cast | 1985-05-12 08:38:00 | 58.5583 N, 6.5666 W | RRS Challenger CH4/85 |
| 254362 | CTD or STD cast | 1985-05-12 09:43:00 | 58.475 N, 6.3916 W | RRS Challenger CH4/85 |
| 261414 | CTD or STD cast | 1985-08-22 20:51:00 | 58.6 N, 9.1533 W | RRS Challenger CH8/85 |
| 261426 | CTD or STD cast | 1985-08-23 00:12:00 | 58.5666 N, 9.0283 W | RRS Challenger CH8/85 |
| 261451 | CTD or STD cast | 1985-08-23 03:48:00 | 58.525 N, 8.8833 W | RRS Challenger CH8/85 |
| 261463 | CTD or STD cast | 1985-08-23 05:28:00 | 58.4566 N, 8.6166 W | RRS Challenger CH8/85 |
| 261475 | CTD or STD cast | 1985-08-23 08:37:00 | 58.3833 N, 8.3433 W | RRS Challenger CH8/85 |
| 261499 | CTD or STD cast | 1985-08-23 12:03:00 | 58.2333 N, 7.775 W | RRS Challenger CH8/85 |
| 261506 | CTD or STD cast | 1985-08-23 13:24:00 | 58.175 N, 7.55 W | RRS Challenger CH8/85 |
| 261518 | CTD or STD cast | 1985-08-23 14:55:00 | 58.1166 N, 7.3333 W | RRS Challenger CH8/85 |
| 261531 | CTD or STD cast | 1985-08-23 16:09:00 | 58.0733 N, 7.175 W | RRS Challenger CH8/85 |
| 261543 | CTD or STD cast | 1985-08-23 20:58:00 | 58.4783 N, 6.3933 W | RRS Challenger CH8/85 |
| 261555 | CTD or STD cast | 1985-08-23 22:10:00 | 58.56 N, 6.56 W | RRS Challenger CH8/85 |
| 261567 | CTD or STD cast | 1985-08-23 23:27:00 | 58.6416 N, 6.7433 W | RRS Challenger CH8/85 |
| 261579 | CTD or STD cast | 1985-08-24 00:54:00 | 58.725 N, 6.9166 W | RRS Challenger CH8/85 |
| 261580 | CTD or STD cast | 1985-08-24 02:18:00 | 58.8066 N, 7.0916 W | RRS Challenger CH8/85 |
| 261592 | CTD or STD cast | 1985-08-24 03:41:00 | 58.88 N, 7.2916 W | RRS Challenger CH8/85 |
| 261611 | CTD or STD cast | 1985-08-24 04:54:00 | 58.975 N, 7.4566 W | RRS Challenger CH8/85 |
| 261623 | CTD or STD cast | 1985-08-24 05:43:00 | 59.0 N, 7.5366 W | RRS Challenger CH8/85 |
| 261635 | CTD or STD cast | 1985-08-24 07:04:00 | 59.0416 N, 7.685 W | RRS Challenger CH8/85 |
| 256043 | CTD or STD cast | 1987-09-02 07:02:00 | 58.475 N, 6.3833 W | RRS Frederick Russell FR18/87 |
| 256055 | CTD or STD cast | 1987-09-02 08:10:00 | 58.5583 N, 6.5666 W | RRS Frederick Russell FR18/87 |
| 256067 | CTD or STD cast | 1987-09-02 09:17:00 | 58.6416 N, 6.7333 W | RRS Frederick Russell FR18/87 |
| 256079 | CTD or STD cast | 1987-09-02 10:23:00 | 58.7316 N, 6.9333 W | RRS Frederick Russell FR18/87 |
| 256080 | CTD or STD cast | 1987-09-02 11:36:00 | 58.8083 N, 7.0916 W | RRS Frederick Russell FR18/87 |
| 256092 | CTD or STD cast | 1987-09-02 12:54:00 | 58.8916 N, 7.2666 W | RRS Frederick Russell FR18/87 |
| 251364 | CTD or STD cast | 1987-11-26 00:33:00 | 59.01 N, 7.5016 W | RRS Challenger CH22 |
| 251376 | CTD or STD cast | 1987-11-26 01:30:00 | 58.9783 N, 7.44 W | RRS Challenger CH22 |
| 251388 | CTD or STD cast | 1987-11-26 02:44:00 | 58.8966 N, 7.2916 W | RRS Challenger CH22 |
| 251407 | CTD or STD cast | 1987-11-26 03:57:00 | 58.8116 N, 7.0983 W | RRS Challenger CH22 |
| 251419 | CTD or STD cast | 1987-11-26 05:14:00 | 58.725 N, 6.9166 W | RRS Challenger CH22 |
| 251420 | CTD or STD cast | 1987-11-26 06:28:00 | 58.6433 N, 6.7433 W | RRS Challenger CH22 |
| 251432 | CTD or STD cast | 1987-11-26 07:41:00 | 58.56 N, 6.5666 W | RRS Challenger CH22 |
| 251444 | CTD or STD cast | 1987-11-26 08:54:00 | 58.475 N, 6.3883 W | RRS Challenger CH22 |
| 251456 | CTD or STD cast | 1987-11-26 15:13:00 | 58.0716 N, 7.18 W | RRS Challenger CH22 |
| 251468 | CTD or STD cast | 1987-11-26 16:06:00 | 58.1166 N, 7.3333 W | RRS Challenger CH22 |
| 251481 | CTD or STD cast | 1987-11-26 17:57:00 | 58.175 N, 7.55 W | RRS Challenger CH22 |
| 251493 | CTD or STD cast | 1987-11-26 19:16:00 | 58.2333 N, 7.775 W | RRS Challenger CH22 |
| 251500 | CTD or STD cast | 1987-11-26 20:46:00 | 58.3083 N, 8.06 W | RRS Challenger CH22 |
| 251512 | CTD or STD cast | 1987-11-26 22:10:00 | 58.3833 N, 8.3416 W | RRS Challenger CH22 |
| 251524 | CTD or STD cast | 1987-11-26 23:39:00 | 58.4583 N, 8.6166 W | RRS Challenger CH22 |
| 251536 | CTD or STD cast | 1987-11-27 01:11:00 | 58.5316 N, 8.8983 W | RRS Challenger CH22 |
| 251548 | CTD or STD cast | 1987-11-27 06:16:00 | 57.87 N, 9.595 W | RRS Challenger CH22 |
| 251561 | CTD or STD cast | 1987-11-27 07:51:00 | 57.7966 N, 9.345 W | RRS Challenger CH22 |
| 251573 | CTD or STD cast | 1987-11-27 09:02:00 | 57.7583 N, 9.1333 W | RRS Challenger CH22 |
| 251585 | CTD or STD cast | 1987-11-27 10:27:00 | 57.7 N, 8.8433 W | RRS Challenger CH22 |
| 251597 | CTD or STD cast | 1987-11-27 11:54:00 | 57.6416 N, 8.55 W | RRS Challenger CH22 |
| 252331 | CTD or STD cast | 1987-12-01 20:42:00 | 58.075 N, 7.1833 W | RRS Challenger CH22 |
| 252355 | CTD or STD cast | 1987-12-01 21:52:00 | 58.1166 N, 7.3333 W | RRS Challenger CH22 |
| 252379 | CTD or STD cast | 1987-12-01 23:24:00 | 58.175 N, 7.55 W | RRS Challenger CH22 |
| 252411 | CTD or STD cast | 1987-12-02 06:25:00 | 57.4616 N, 7.6766 W | RRS Challenger CH22 |
| 252423 | CTD or STD cast | 1987-12-02 07:47:00 | 57.5233 N, 7.9633 W | RRS Challenger CH22 |
| 252435 | CTD or STD cast | 1987-12-02 09:06:00 | 57.5833 N, 8.2583 W | RRS Challenger CH22 |
| 266800 | CTD or STD cast | 1988-03-05 01:07:00 | 58.3083 N, 8.0516 W | RRS Challenger CH25 |
| 266812 | CTD or STD cast | 1988-03-05 02:32:00 | 58.2316 N, 7.7783 W | RRS Challenger CH25 |
| 266824 | CTD or STD cast | 1988-03-05 03:40:00 | 58.1733 N, 7.55 W | RRS Challenger CH25 |
| 266836 | CTD or STD cast | 1988-03-05 05:12:00 | 58.115 N, 7.3633 W | RRS Challenger CH25 |
| 266848 | CTD or STD cast | 1988-03-05 07:27:00 | 58.0683 N, 7.165 W | RRS Challenger CH25 |
| 263513 | CTD or STD cast | 1988-06-14 19:47:00 | 59.0433 N, 7.6816 W | RRS Challenger CH30 |
| 263537 | CTD or STD cast | 1988-06-14 21:57:00 | 59.0016 N, 7.5383 W | RRS Challenger CH30 |
| 263549 | CTD or STD cast | 1988-06-14 22:54:00 | 58.975 N, 7.435 W | RRS Challenger CH30 |
| 263550 | CTD or STD cast | 1988-06-15 00:08:00 | 58.89 N, 7.2716 W | RRS Challenger CH30 |
| 263562 | CTD or STD cast | 1988-06-15 01:16:00 | 58.8066 N, 7.09 W | RRS Challenger CH30 |
| 263574 | CTD or STD cast | 1988-06-15 02:24:00 | 58.725 N, 6.92 W | RRS Challenger CH30 |
| 263586 | CTD or STD cast | 1988-06-15 03:32:00 | 58.6416 N, 6.74 W | RRS Challenger CH30 |
| 263598 | CTD or STD cast | 1988-06-15 04:36:00 | 58.5583 N, 6.5666 W | RRS Challenger CH30 |
| 263605 | CTD or STD cast | 1988-06-15 05:43:00 | 58.475 N, 6.3916 W | RRS Challenger CH30 |
Appendix 3: DML Line J
Related series for this Fixed Station are presented in the table below. Further information can be found by following the appropriate links.
If you are interested in these series, please be aware we offer a multiple file download service. Should your credentials be insufficient for automatic download, the service also offers a referral to our Enquiries Officer who may be able to negotiate access.
| Series Identifier | Data Category | Start date/time | Start position | Cruise |
|---|---|---|---|---|
| 92828 | CTD or STD cast | 1978-02-09 06:40:00 | 58.5666 N, 9.0333 W | RRS Challenger CH2/78 |
| 99735 | CTD or STD cast | 1979-06-26 14:05:00 | 58.5866 N, 9.0416 W | RRS Shackleton S5/79 |
| 191918 | CTD or STD cast | 1981-07-10 08:15:00 | 58.2483 N, 7.7916 W | RRS Challenger CH10/81 |
| 193716 | CTD or STD cast | 1983-05-27 20:26:00 | 58.0733 N, 7.1416 W | RRS Challenger CH7B/83 |
| 193728 | CTD or STD cast | 1983-05-27 21:24:00 | 58.1166 N, 7.3333 W | RRS Challenger CH7B/83 |
| 193741 | CTD or STD cast | 1983-05-27 22:46:00 | 58.1766 N, 7.5483 W | RRS Challenger CH7B/83 |
| 193753 | CTD or STD cast | 1983-05-28 00:15:00 | 58.2333 N, 7.7833 W | RRS Challenger CH7B/83 |
| 193765 | CTD or STD cast | 1983-05-28 01:50:00 | 58.3083 N, 8.0583 W | RRS Challenger CH7B/83 |
| 193777 | CTD or STD cast | 1983-05-28 03:24:00 | 58.3866 N, 8.345 W | RRS Challenger CH7B/83 |
| 193789 | CTD or STD cast | 1983-05-28 04:55:00 | 58.4583 N, 8.6166 W | RRS Challenger CH7B/83 |
| 193790 | CTD or STD cast | 1983-05-28 06:31:00 | 58.535 N, 8.8966 W | RRS Challenger CH7B/83 |
| 97138 | CTD or STD cast | 1983-08-20 12:17:00 | 58.075 N, 7.1666 W | RRS Challenger CH11/83 |
| 97151 | CTD or STD cast | 1983-08-20 13:22:00 | 58.1166 N, 7.3333 W | RRS Challenger CH11/83 |
| 97163 | CTD or STD cast | 1983-08-20 15:47:00 | 58.1783 N, 7.5566 W | RRS Challenger CH11/83 |
| 97175 | CTD or STD cast | 1983-08-20 17:08:00 | 58.2316 N, 7.7833 W | RRS Challenger CH11/83 |
| 193894 | CTD or STD cast | 1983-08-20 18:41:00 | 58.3116 N, 8.06 W | RRS Challenger CH11/83 |
| 97187 | CTD or STD cast | 1983-08-20 20:31:00 | 58.385 N, 8.3416 W | RRS Challenger CH11/83 |
| 97199 | CTD or STD cast | 1983-08-20 22:02:00 | 58.4583 N, 8.6166 W | RRS Challenger CH11/83 |
| 97206 | CTD or STD cast | 1983-08-21 00:15:00 | 58.535 N, 8.895 W | RRS Challenger CH11/83 |
| 313498 | CTD or STD cast | 1984-07-01 04:19:00 | 58.0717 N, 7.1883 W | RRS Challenger CH2/84 |
| 313505 | CTD or STD cast | 1984-07-01 05:16:00 | 58.1133 N, 7.335 W | RRS Challenger CH2/84 |
| 313517 | CTD or STD cast | 1984-07-01 07:01:00 | 58.175 N, 7.55 W | RRS Challenger CH2/84 |
| 313529 | CTD or STD cast | 1984-07-01 08:16:00 | 58.235 N, 7.7767 W | RRS Challenger CH2/84 |
| 313530 | CTD or STD cast | 1984-07-01 09:54:00 | 58.3083 N, 8.0583 W | RRS Challenger CH2/84 |
| 313542 | CTD or STD cast | 1984-07-01 11:26:00 | 58.3833 N, 8.3383 W | RRS Challenger CH2/84 |
| 313554 | CTD or STD cast | 1984-07-01 13:00:00 | 58.4617 N, 8.6133 W | RRS Challenger CH2/84 |
| 313566 | CTD or STD cast | 1984-07-01 14:34:00 | 58.535 N, 8.895 W | RRS Challenger CH2/84 |
| 254190 | CTD or STD cast | 1985-05-11 08:18:00 | 58.07 N, 7.17 W | RRS Challenger CH4/85 |
| 254208 | CTD or STD cast | 1985-05-11 09:19:00 | 58.1166 N, 7.3316 W | RRS Challenger CH4/85 |
| 254221 | CTD or STD cast | 1985-05-11 10:52:00 | 58.175 N, 7.5466 W | RRS Challenger CH4/85 |
| 254233 | CTD or STD cast | 1985-05-11 12:14:00 | 58.2333 N, 7.775 W | RRS Challenger CH4/85 |
| 254245 | CTD or STD cast | 1985-05-11 13:48:00 | 58.3083 N, 8.0583 W | RRS Challenger CH4/85 |
| 254257 | CTD or STD cast | 1985-05-11 15:30:00 | 58.3816 N, 8.3366 W | RRS Challenger CH4/85 |
| 254269 | CTD or STD cast | 1985-05-11 17:12:00 | 58.4583 N, 8.615 W | RRS Challenger CH4/85 |
| 254270 | CTD or STD cast | 1985-05-11 18:51:00 | 58.53 N, 8.8916 W | RRS Challenger CH4/85 |
| 261414 | CTD or STD cast | 1985-08-22 20:51:00 | 58.6 N, 9.1533 W | RRS Challenger CH8/85 |
| 261426 | CTD or STD cast | 1985-08-23 00:12:00 | 58.5666 N, 9.0283 W | RRS Challenger CH8/85 |
| 261451 | CTD or STD cast | 1985-08-23 03:48:00 | 58.525 N, 8.8833 W | RRS Challenger CH8/85 |
| 261463 | CTD or STD cast | 1985-08-23 05:28:00 | 58.4566 N, 8.6166 W | RRS Challenger CH8/85 |
| 261475 | CTD or STD cast | 1985-08-23 08:37:00 | 58.3833 N, 8.3433 W | RRS Challenger CH8/85 |
| 261499 | CTD or STD cast | 1985-08-23 12:03:00 | 58.2333 N, 7.775 W | RRS Challenger CH8/85 |
| 261506 | CTD or STD cast | 1985-08-23 13:24:00 | 58.175 N, 7.55 W | RRS Challenger CH8/85 |
| 261518 | CTD or STD cast | 1985-08-23 14:55:00 | 58.1166 N, 7.3333 W | RRS Challenger CH8/85 |
| 261531 | CTD or STD cast | 1985-08-23 16:09:00 | 58.0733 N, 7.175 W | RRS Challenger CH8/85 |
| 251456 | CTD or STD cast | 1987-11-26 15:13:00 | 58.0716 N, 7.18 W | RRS Challenger CH22 |
| 251468 | CTD or STD cast | 1987-11-26 16:06:00 | 58.1166 N, 7.3333 W | RRS Challenger CH22 |
| 251481 | CTD or STD cast | 1987-11-26 17:57:00 | 58.175 N, 7.55 W | RRS Challenger CH22 |
| 251493 | CTD or STD cast | 1987-11-26 19:16:00 | 58.2333 N, 7.775 W | RRS Challenger CH22 |
| 251500 | CTD or STD cast | 1987-11-26 20:46:00 | 58.3083 N, 8.06 W | RRS Challenger CH22 |
| 251512 | CTD or STD cast | 1987-11-26 22:10:00 | 58.3833 N, 8.3416 W | RRS Challenger CH22 |
| 251524 | CTD or STD cast | 1987-11-26 23:39:00 | 58.4583 N, 8.6166 W | RRS Challenger CH22 |
| 251536 | CTD or STD cast | 1987-11-27 01:11:00 | 58.5316 N, 8.8983 W | RRS Challenger CH22 |
| 252331 | CTD or STD cast | 1987-12-01 20:42:00 | 58.075 N, 7.1833 W | RRS Challenger CH22 |
| 252355 | CTD or STD cast | 1987-12-01 21:52:00 | 58.1166 N, 7.3333 W | RRS Challenger CH22 |
| 252379 | CTD or STD cast | 1987-12-01 23:24:00 | 58.175 N, 7.55 W | RRS Challenger CH22 |
| 266800 | CTD or STD cast | 1988-03-05 01:07:00 | 58.3083 N, 8.0516 W | RRS Challenger CH25 |
| 266812 | CTD or STD cast | 1988-03-05 02:32:00 | 58.2316 N, 7.7783 W | RRS Challenger CH25 |
| 266824 | CTD or STD cast | 1988-03-05 03:40:00 | 58.1733 N, 7.55 W | RRS Challenger CH25 |
| 266836 | CTD or STD cast | 1988-03-05 05:12:00 | 58.115 N, 7.3633 W | RRS Challenger CH25 |
| 266848 | CTD or STD cast | 1988-03-05 07:27:00 | 58.0683 N, 7.165 W | RRS Challenger CH25 |
