Metadata Report for BODC Series Reference Number 1172814
Metadata Summary
Problem Reports
Data Access Policy
Narrative Documents
Project Information
Data Activity or Cruise Information
Fixed Station Information
BODC Quality Flags
SeaDataNet Quality Flags
Metadata Summary
Data Description |
|||||||||||||||||||||||||||||||||||||||||||||||||||||
|
|||||||||||||||||||||||||||||||||||||||||||||||||||||
Data Identifiers |
|||||||||||||||||||||||||||||||||||||||||||||||||||||
|
|||||||||||||||||||||||||||||||||||||||||||||||||||||
Time Co-ordinates(UT) |
|||||||||||||||||||||||||||||||||||||||||||||||||||||
|
|||||||||||||||||||||||||||||||||||||||||||||||||||||
Spatial Co-ordinates | |||||||||||||||||||||||||||||||||||||||||||||||||||||
|
|||||||||||||||||||||||||||||||||||||||||||||||||||||
Parameters |
|||||||||||||||||||||||||||||||||||||||||||||||||||||
|
|||||||||||||||||||||||||||||||||||||||||||||||||||||
|
|||||||||||||||||||||||||||||||||||||||||||||||||||||
Problem Reports
No Problem Report Found in the Database
Data Access Policy
Open Data
These data have no specific confidentiality restrictions for users. However, users must acknowledge data sources as it is not ethical to publish data without proper attribution. Any publication or other output resulting from usage of the data should include an acknowledgment.
If the Information Provider does not provide a specific attribution statement, or if you are using Information from several Information Providers and multiple attributions are not practical in your product or application, you may consider using the following:
"Contains public sector information licensed under the Open Government Licence v1.0."
Narrative Documents
Chelsea Technologies Minipack CTD-F
The Minipack CTD is a titanium/acetyl conductivity-temperature-depth system that can be used for discrete profiles, installed on a data buoy or on a towed undulator. The instrument includes conductivity, temperature, depth and fluorometer sensors, incorporating a high-performance 24-channel data logging and transmission system which allows for the acquisition of up to 16 external channels (e.g., dissolved oxygen, pH, PAR, fluorescence, turbidity, transmissance etc.).
Specifications
| Sensor | Type | Range | Accuracy | Resolution |
| Temperature | Pt resistance | -2 to 35 °C | 0.003 °C | 0.0005 °C |
| Conductivity | Induction cell | 0 to 70 mmho cm-1 | 0.005 mmho cm-1 | 0.001 mmho cm-1 |
| Pressure | Strain gauge with | 0 to 600 dbar | 0.2 dbar | 0.01 dbar |
Optical sensor specifications
| Chlorophyll a | Rhodamine | Amido Rhodamine | Fluorescein | Nephelometer | Phycoerythrin | Phycocyanin | |
| Excitation wavelengths | 430/30 nm or 470/30 nm | 470/30 nm | 425/30 nm | 480/80 nm | *470/30 nm | 530/30 nm | 590/35 nm |
| Emission wavelengths | 685/30 nm | 590/45 nm | 550/30 nm | 530/30 nm | *470/30 nm | 580/30 nm | 645/35 nm |
| Concentration range | 0.03 - 100 µg L-1 | 0.03 - 100 µg L-1 | 0.04 - 200 µg L-1 | 0.03 - 100 µg L-1 | *0.04 - 100 FTU | 0.03 - 100 µg L-1 | 0.03 - 100 µg L-1 |
| Resolution | 0.01 µg L-1 | 0.01 µg L-1 | 0.025 µg L-1 | 0.01 µg L-1 | *0.01 FTU | 0.01 µg L-1 | 0.01 µg L-1 |
*the wavelengths for the turbidity filters are a customer option but must be in the range 400 to 700 nm. The same wavelength is used in both the excitation path and the emission path.
Further details can be found in the manufacturer's specification sheet.
Global Positioning Satellite System
A location system of unspecified make or model that determines location on the Earth's surface using the Global Positioning Satellite Network. Angular co-ordinates are given relative to WGS84 CRS. Other parameters such as platform velocity may be derived from this.
JR98 SeaSoar Originators processing document
Sampling strategy
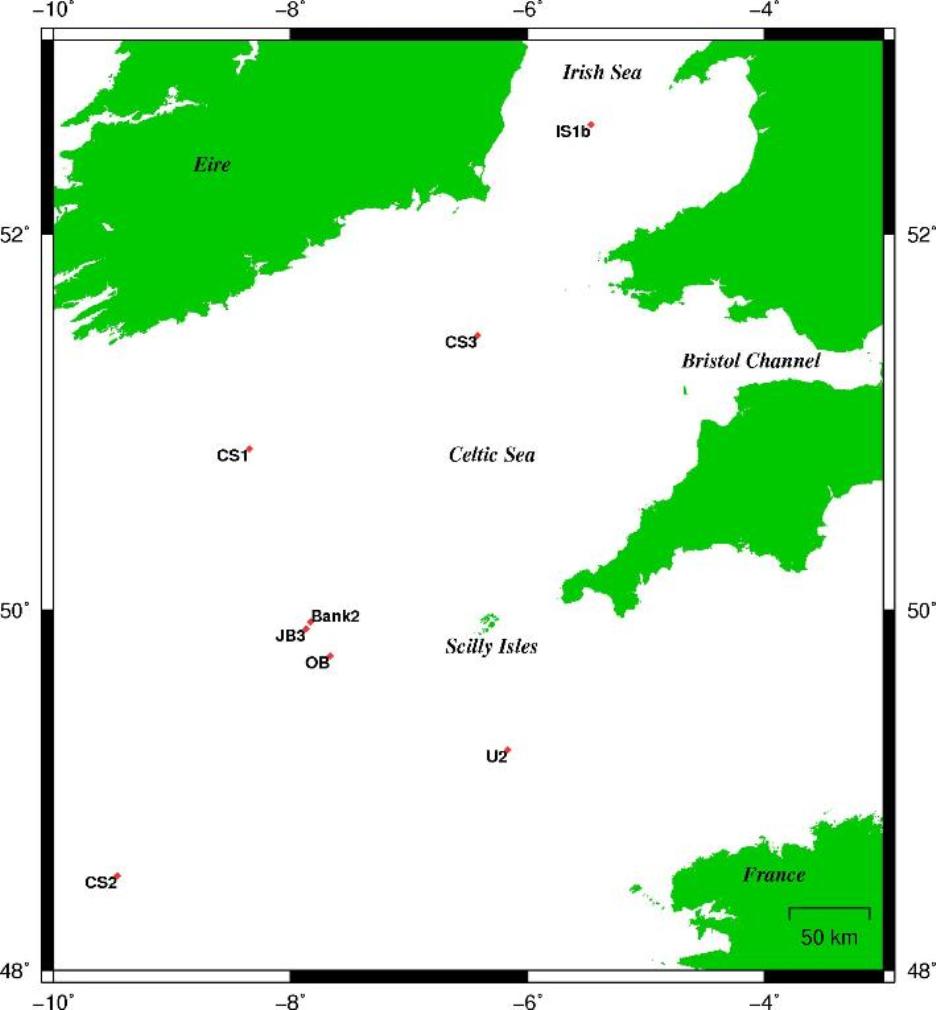
The Penguin SeaSoar was successfully deployed three times from RRS James Clark Ross cruise JR98 (25 July to 14 August 2003) in the Celtic Sea. There had been considerable problems with the SeaSoar winches early on in the cruise as well as a faulty hard drive but these were resolved which allowed the SeaSoar to be deployed. Run 1 was designed to measure conditions travelling from almost completely mixed water in the Irish Sea, across the Celtic Sea front, and through to the CS3 mooring site. Run 2 transected from mooring site U2 (a well stratified site North West of France) and mooring site N1 (close to the shelf edge). Run 3 ran from the mooring site N9 (the site furthest seaward of the shelf edge) through the CS2 (shelf edge) and CS1 mooring sites and on to station CS3.
| Run | Start time (UTC) | Start position | End time (UTC) | End position |
|---|---|---|---|---|
| 1 | 04/08/2003 17:36 | 52°9.52628' N 5°49.53384' W | 05/08/2003 01:15 | 51°23.74974' N 6°29.01762' W |
| 2 | 06/08/2003 19:29 | 49°10.98318' N 6°25.39284' W | 07/08/2003 12:14 | 48°38.27184' N 9°6.87288' W |
| 3 | 08/08/2003 14:30 | 48°16.88100' N 10°13.40436' W | 10/08/2003 01:36 | 51°27.19278' N 6°29.14622' W |
Please note that the positions, start and end times are those for which data is available. The SeaSoar may have been in the water for a longer period than those reported here.
Correction of time data
The time stamp in the raw Minipack files has two origins: hours, minutes, and seconds are from the Minipack internal clock, while the decimal days are from the DAS system associated with Penguin. After some work it was found that the DAS time was correct (UTC) for the SeaSoar run 2 (06 - 07 August 2003) and run 3 (08 - 10 August 2003), but was UTC - 1 hour for run 1 (04 - 05 August 2003). The Minipack time was consistently 11 minutes 49 seconds behind UTC. The time stamp in the processed files used the Minipack time, with 11 minutes 49 seconds added to it, and so is consistently UTC.
Addition of navigation data
The Minipack data have been merged with corrected navigation data from the surface underway data files sourced from the JR98 central logging system. The surface underway data were used to generate an interpolated series of positions with a 1 second resolution. The Minipack data were then stamped with the latitudes and longitudes corresponding to the sample times.
Calibrations
Calibration and processing of the SeaSoar data (salinity, temperature, depth, chlorophyll fluorescence) has been carried out by the originator. Calibration was done by comparing the vertical profile made by SeaSoar at 19:30 UTC on 10 August 2003 with data from adjacent CTD casts (cast 150 at 19:00 UTC and cast 151 at 20:00 UTC from this cruise).
Salinity
Comparisons of salinity were made away from strong vertical gradients (i.e. data within the pycnocline were not used) because of the difficulty associated with pycnocline movements between the CTD and SeaSoar vertical casts. Using only data within the bottom layer a calibration equation was generated as:
Calibrated salinity (dimensionless) = (0.95 x SeaSoar Minipack salinity) + 1.80
The resulting error about this calibration was less than the 0.01 resolution of the Minipack salinity measurements, so the error should be taken to be ±0.01.
Temperature
Comparisons of temperatures, as with salinities, was made using the bottom layer (non-pycnocline) data only. A calibration equation was generated as:
Calibrated temperature (°C) = (0.997 x SeaSoar Minipack temperature) - 0.034
The error about this calibration is ±0.03 °C
Depth
Due to the difficulties with the winch sliprings there is very little SeaSoar data available prior to a deployment to assess any pressure offsets. The data on 10 August 2013 showed the Minipack pressure sensor to be reading 0.19 m too high. All Minipack data have subsequently been calibrated by subtracting this 0.19 m, and then applying a further offset based on the difference between the CTD pressure offsets on 10 August 2013 and on the days of the SeaSoar runs. This further offset was calculated as the average between the CTD casts immediately before and after the SeaSoar run.
An estimate of the pressure error post-calibration can be made by assessing the range of two CTD pressure offsets used to calculate the average SeaSoar offset. The worst error is for run 2 (approximately 0.7 m).
The Minipack pressure offset on August 10th = 0.19 m. The CTD pressure offset on August 10th = -0.69 m. Thus the Minipack pressure reads 0.88 m higher than the CTD.
Run 1 CTD pressure offset (ctd cast 96 = -0.54 m, and ctd cast 97 = -0.68 m) = -0.61 m. Therefore SeaSoar pressure offset = 0.27 m.
Run 2 CTD pressure offset (ctd cast 124 = -1.00 m, and ctd cast 125 = +0.45 m) = -0.28 m. Therefore SeaSoar pressure offset = 0.61 m.
Run 3 CTD pressure offset (ctd cast 133 = +0.52 m, and ctd cast 134 = -0.62 m) = -0.05 m. Therefore SeaSoar pressure offset = 0.83 m.
These SeaSoar pressure offsets were subtracted from the raw SeaSoar Minipack pressures. The calibrated pressures were then multiplied by -1 to make depth below the sea surface negative.
Chlorophyll.
Comparisons between SeaSoar and CTD chlorophyll measurements used data from the entire water column, as extending the range of available chlorophyll concentrations to include the subsurface chlorophyll maximum was needed to achieve a reliable calibration. A calibration equation was generated as:
Calibrated chlorophyll (mg m-3)= (0.067 x SeaSoar Minipack chlorophyll) + 0.08
The error about this calibration was ±0.1 mg m-3. This is of the same order as the error associated with the calibration of the CTD chlorophyll data (±0.1 mg m-3), so a combination of these errors leads to a total chlorophyll (SeaSoar Minipack) error of ±0.22 mg m-3.
Originators quality notes
The cruise report states that there were some problems with the SeaSoar system during this cruise. Most of these problems arose from damaged slip rings on both of the SeaSoar winches, this was resolved during the cruise. Problems were also experienced with the Penguin system; it is thought most of these arose from a faulty hard drive aboard the Penguin PC on SeaSoar. Despite these problems the SeaSoar system was able to record data for three transects.
JR98 SeaSoar Processing undertaken by BODC
Data were received by BODC in three .dat files. The series were reformatted to the internal data format using established procedures. In some instances there were two consecutive rows with the exact same timestamp. In this situation the time stamp for the two rows (with the same timestamp) were recalculated and placed equidistant from the row immediately before them and immediately after them. The following table details mapping of variables to BODC parameter codes.
| Originator' Variable | Units | BODC Parameter Code | Description | Units | Comments |
|---|---|---|---|---|---|
| lat | Degrees North | ALATAS01 | Latitude north (WGS84) by Ashtech GPS | Degrees | |
| long | Degrees West | ALONAS01 | Longitude east (WGS84) by Ashtech GPS | Degrees | Data converted by *-1 so that the data are Degrees East (not West as supplied by originator). |
| depth | Decibars | PRESPR01 | Pressure (spatial co-ordinate) exerted by the water body by profiling pressure sensor and corrected to read zero at sea level | Decibars | Originator has confirmed that this parameter is pressure (and not depth as labelled in the data files) |
| temp | Degrees Celsius | TEMPST01 | Temperature of the water body by CTD or STD | Degrees Celsius | |
| salt | Dimensionless | PSALST01 | Practical salinity of the water body by CTD and computation using UNESCO 1983 algorithm | Dimensionless | |
| chl | mg m-3 | CPHLPS01 | Concentration of chlorophyll-a {chl-a} per unit volume of the water body [particulate phase] by in-situ chlorophyll fluorometer and calibration against sample data | mg m-3 | |
| - | - | SIGTPR01 | Sigma-theta of the water body by CTD and computation from salinity and potential temperature using UNESCO algorithm | kg m-3 | Parameter derived by BODC |
| - | - | POTMCV01 | Potential temperature of the water body by computation using UNESCO 1983 algorithm. | Degrees Celsius | Parameter derived by BODC |
| - | - | DSRNCV01 | Distance travelled | km | Parameter derived by BODC |
The reformatted data were visualised using BODC in-house software. Suspect data were marked by adding an appropriate quality control flag, and missing data marked by both setting the data to an appropriate absent data value and setting the quality control flag. It was noted during this process that there are gaps in the data where logging was disrupted (probably due to the problems reported by the originator) but this does not seem to have affected the quality of the data recorded.
Project Information
Physical-Biological Control of New Production within the Seasonal Thermocline
This project was a NERC responsive-mode project which was co-funded by the Defence Science and Technology Laboratory and ran from 2003 to 2006. The key institutes and scientists involved were:
| Institute | Scientific personnel |
|---|---|
| Proudman Oceanographic Laboratory (POL) | Jonathan Sharples |
| National Oceanography Centre, Southampton (NOCS) | Patrick Holligan Mark Moore |
| University of Wales, Bangor (UWB) | John Simpson Tom Rippeth |
Research Aim
The main aim of this research was to investigate the generation and dissipation of turbulence in the thermocline, and to quantify how the resulting mixing (supplying nutrients and controlling the light experienced by the algae) affected the growth of phytoplankton within the sub-surface chlorophyll maximum (SCM).
Research Objectives
The objective of the research was to test the general hypothesis that, in seasonally-stratified shelf waters, temporal and spatial variability of the rate of 'new' production is determined by the degree of coupling between physical and biological processes within the seasonal thermocline. In particular it has been suggested that physiological adaptation by phytoplankton making up the subsurface chlorophyll maximum drives a biological pump for extracting nitrate from the bottom mixed layer that is sensitive to internal mixing and to external climatological factors.
Research Approach
The sampling and experimental strategy was based on established methods for obtaining compatible, high-resolution vertical profiles (alternate CTD and FLY) and sections (SeaSoar) of physical, chemical, and biological parameters, allowing quantification of vertical fluxes and primary production on tidal and internal wave time scales. The cruise schedule (with associated mooring deployments) for the project is below.
Cruise Schedule
| Cruise ID | Ship | Sampling Region | Cruise Dates | Main measurements |
|---|---|---|---|---|
| JR98 | RRS James Clark Ross | St Georges Channel, Celtic Sea and shelf edge | 25/07/03 - 14/08/03 | CTD casts, SeaSoar transects (CTD, chlorophyll, fluorescence), FRRF, ship ADCP, primary productivity, nutrients, trace metals, phytoplankton uptake rates, algal photophysiology, oxygen concentration, particle size, optics, mooring deployments |
| PD32_03 | RV Prince Madog | Celtic Sea and shelf edge | 27/07/03 - 13/08/03 | 5 x FLY 25 hour tidal cycle stations, particle size analysis, particle settling velocity, CTD casts, mooring deployments |
| CD173 | RRS Charles Darwin | Celtic Sea and shelf edge | 15/07/05 - 06/08/05 | CTD casts, chlorophyll, oxygen concentration, FLY profiles, SeaSoar tows (CTD, chlorophyll, FRRF), phytoplankton pigments, nutrients, primary productivity, phytoplankton uptake rates, FRRF profiles, optics, particle size analysis, mooring deployments |
| PD27_05 | RV Prince Madog | Celtic Sea and shelf edge | 22/07/05 - 06/08/05 | FLY profiles, mooring deployments |
Moorings
| Station ID | Latitude | Longitude | Depth (m) | Mooring | Deployment date | Recovery date | Deployment vessel |
|---|---|---|---|---|---|---|---|
| CS3 | 51.471 | -6.428 | 95 | Seabed frame 300 kHz ADCP | 01/08/03 | 11/08/03 | RV Prince Madog |
| CS3 | 51.471 | -6.428 | 95 | Seabed frame 1200 kHz ADCP | 01/08/03 | 11/08/03 | RV Prince Madog |
| CS3 | 51.474 | -6.437 | 95 | Mid-water subsurface 300 kHz ADCP | 01/08/03 | 11/08/03 | RV Prince Madog |
| CS3 | 51.469 | -6.437 | 95 | Thermistor chain from 5 - 45 m depth | 01/08/03 | 11/08/03 | RV Prince Madog |
| ACW | 51.266 | -5.741 | 85 | Seabed frame 300 kHz ADCP | 06/08/03 | 08/08/03 | RV Prince Madog |
| CS2 | 48.532 | -9.463 | 200 | Surface temperature toroid | 28/07/03 | 12/08/03 | RRS James Clark Ross |
| CS2 | 48.532 | -9.463 | 200 | Thermistor chain throughout water column | 28/07/03 | 12/08/03 | RRS James Clark Ross |
| CS2 | 48.532 | -9.463 | 200 | Sub-suface 600 kHz ADCP (90 m) | 28/07/03 | 12/08/03 | RRS James Clark Ross |
| CS2 | 48.532 | -9.463 | 200 | Aanderaa RCM7 current meter/CTD (12 mab)* | 28/07/03 | 12/08/03 | RRS James Clark Ross |
| CS2 | 48.532 | -9.463 | 200 | Seabed frame 150 kHz ADCP | 28/07/03 | 12/08/03 | RRS James Clark Ross |
| CS2 | 48.532 | -9.463 | 200 | Seabed frame 300 kHz ADCP | 28/07/03 | 12/08/03 | RRS James Clark Ross |
| U2 | 49.236 | -6.166 | 121 | Sub-suface 300 kHz ADCP (5 mab)* | 15/07/05 | 03/08/05 | RRS Charles Darwin |
| U2 | 49.233 | -6.167 | 120 | Thermistor chain throughout water column | 19/07/05 | Mooring lost | RRS Charles Darwin |
| CS2 | 48.571 | -9.509 | 200 | Thermistor chain throughout water column | 17/07/05 | 24/07/05 | RRS Charles Darwin |
| CS2 | 48.573 | -9.51 | 194 | Sub-suface 300 kHz ADCP (100 m) | 17/07/05 | 24/07/05 | RRS Charles Darwin |
| CS2 | 48.572 | -9.508 | 196 | Seabed frame 300 kHz ADCP | 17/07/05 | 24/07/05 | RRS Charles Darwin |
| CS2 | 48.571 | -9.507 | 202 | Seabed frame 150 kHz ADCP | 17/07/05 | 24/07/05 | RRS Charles Darwin |
| Bank 1 | 49.938 | -7.792 | 118 | Thermistor chain throughout water column | 26/07/05 | Mooring lost | RRS Charles Darwin |
| Bank 1 | 49.936 | -7.792 | 118 | Seabed frame 300 kHz ADCP | 27/07/05 | Recovered by trawler 29/07/05 | RRS Charles Darwin |
| Bank 2 | 49.895 | -7.872 | 114 | Thermistor chain throughout water column | 20/07/05 | 04/08/05 | RRS Charles Darwin |
| Bank 2 | 49.876 | -7.897 | 112 | Sub-surface 600 kHz ADCP (56 m) | 26/07/05 | 04/08/05 | RRS Charles Darwin |
| Bank 2 | 49.894 | -7.873 | 110 | Seabed frame 300 kHz ADCP | 26/07/05 | 04/08/05 | RRS Charles Darwin |
| Bank 3 | 49.851 | -7.952 | 78 | Thermistor chain throughout water column | 26/07/05 | 03/08/05 | RV Prince Madog |
| Bank 3 | 49.854 | -7.948 | 78 | Seabed frame 300 kHz ADCP | 26/07/05 | Mooring lost | RV Prince Madog |
* = metres above seabed
Project Outcomes
The main products of the research were:
- The first large scale interdisciplinary study of the dynamic processes that determine the properties of the SCM in NW European shelf waters.
- Substantive advances in quantifying internal mixing in NW European shelf seas, and in understanding how primary production is controlled by this small-scale turbulence.
- New parameterisations for internal vertical mixing, and the response of primary production, for use in coupled numerical models.
- Improved capability for estimating primary productivity in stratified waters by satellite remote sensing (ocean colour, sea surface temperature, wind mixing etc.)
- An overall development of our understanding of the dynamics of ecosystems that support important fisheries, and of our abilities in predicting ecological and biogeochemical responses to variations and changes in the climate of the marine environment.
Data Activity or Cruise Information
Cruise
| Cruise Name | JR20030725 (JR98) |
| Departure Date | 2003-07-25 |
| Arrival Date | 2003-08-13 |
| Principal Scientist(s) | Jonathan Sharples (Proudman Oceanographic Laboratory) |
| Ship | RRS James Clark Ross |
Complete Cruise Metadata Report is available here
Fixed Station Information
No Fixed Station Information held for the Series
BODC Quality Control Flags
The following single character qualifying flags may be associated with one or more individual parameters with a data cycle:
| Flag | Description |
|---|---|
| Blank | Unqualified |
| < | Below detection limit |
| > | In excess of quoted value |
| A | Taxonomic flag for affinis (aff.) |
| B | Beginning of CTD Down/Up Cast |
| C | Taxonomic flag for confer (cf.) |
| D | Thermometric depth |
| E | End of CTD Down/Up Cast |
| G | Non-taxonomic biological characteristic uncertainty |
| H | Extrapolated value |
| I | Taxonomic flag for single species (sp.) |
| K | Improbable value - unknown quality control source |
| L | Improbable value - originator's quality control |
| M | Improbable value - BODC quality control |
| N | Null value |
| O | Improbable value - user quality control |
| P | Trace/calm |
| Q | Indeterminate |
| R | Replacement value |
| S | Estimated value |
| T | Interpolated value |
| U | Uncalibrated |
| W | Control value |
| X | Excessive difference |
SeaDataNet Quality Control Flags
The following single character qualifying flags may be associated with one or more individual parameters with a data cycle:
| Flag | Description |
|---|---|
| 0 | no quality control |
| 1 | good value |
| 2 | probably good value |
| 3 | probably bad value |
| 4 | bad value |
| 5 | changed value |
| 6 | value below detection |
| 7 | value in excess |
| 8 | interpolated value |
| 9 | missing value |
| A | value phenomenon uncertain |
| B | nominal value |
| Q | value below limit of quantification |
