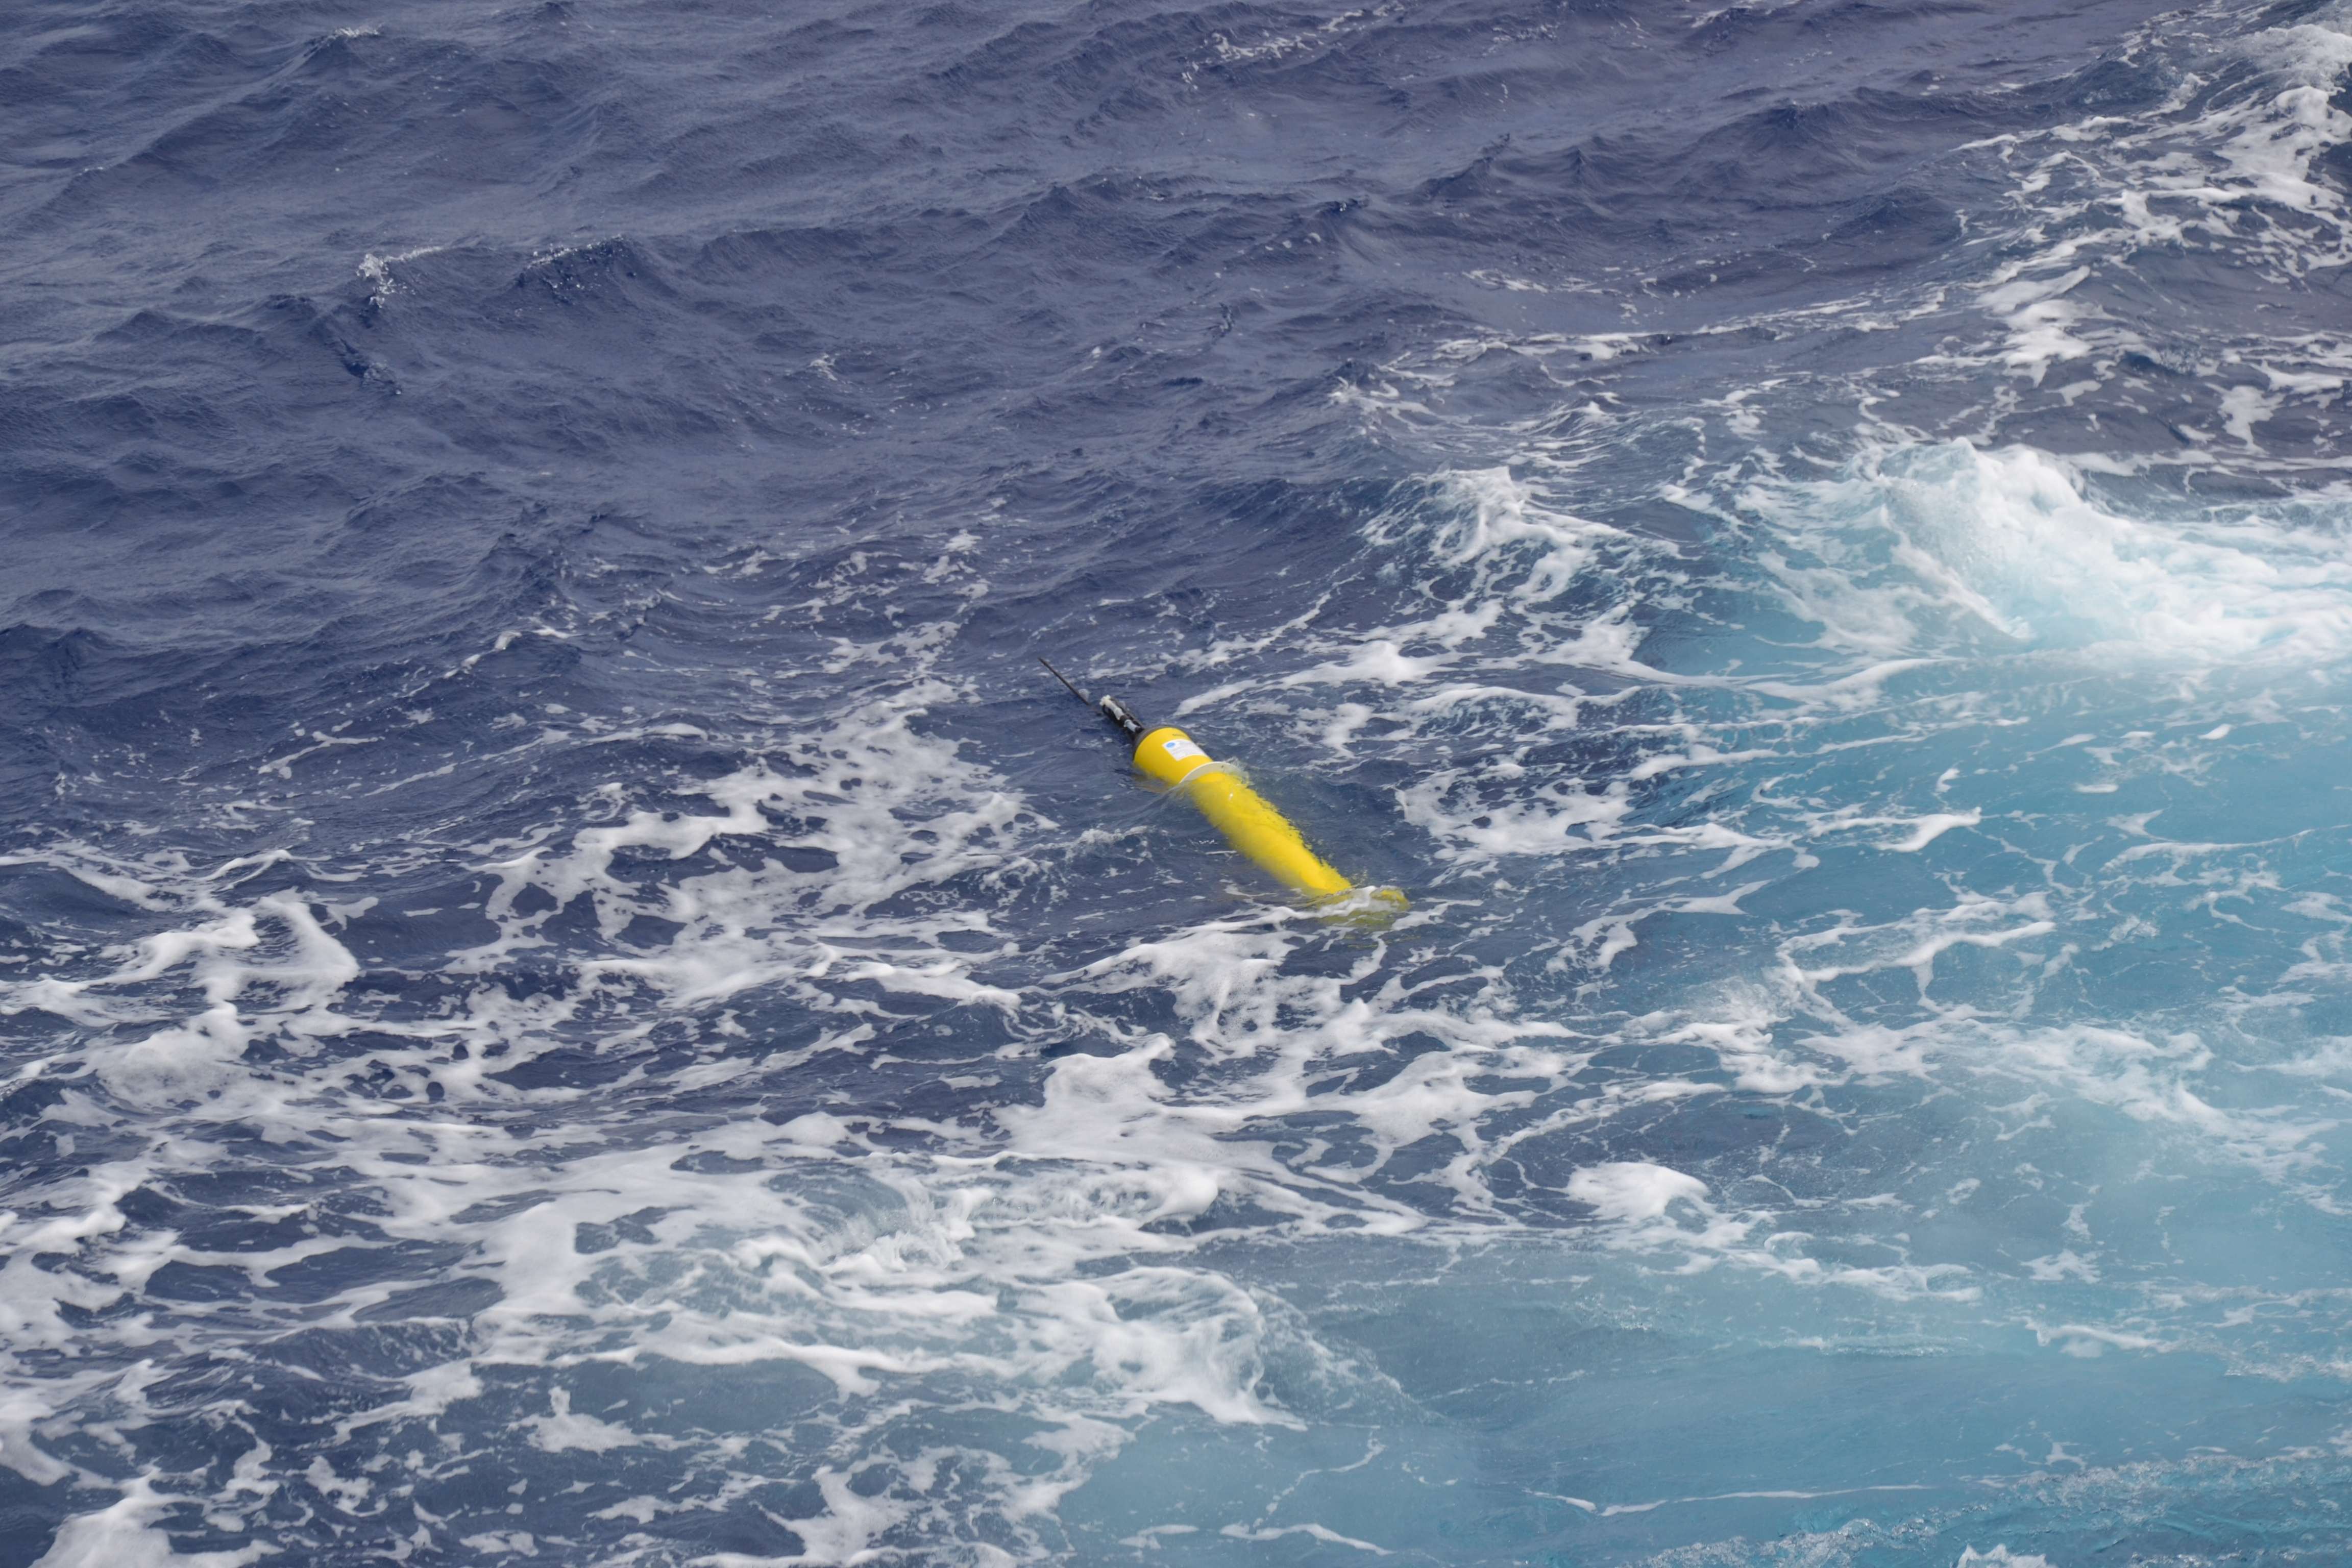
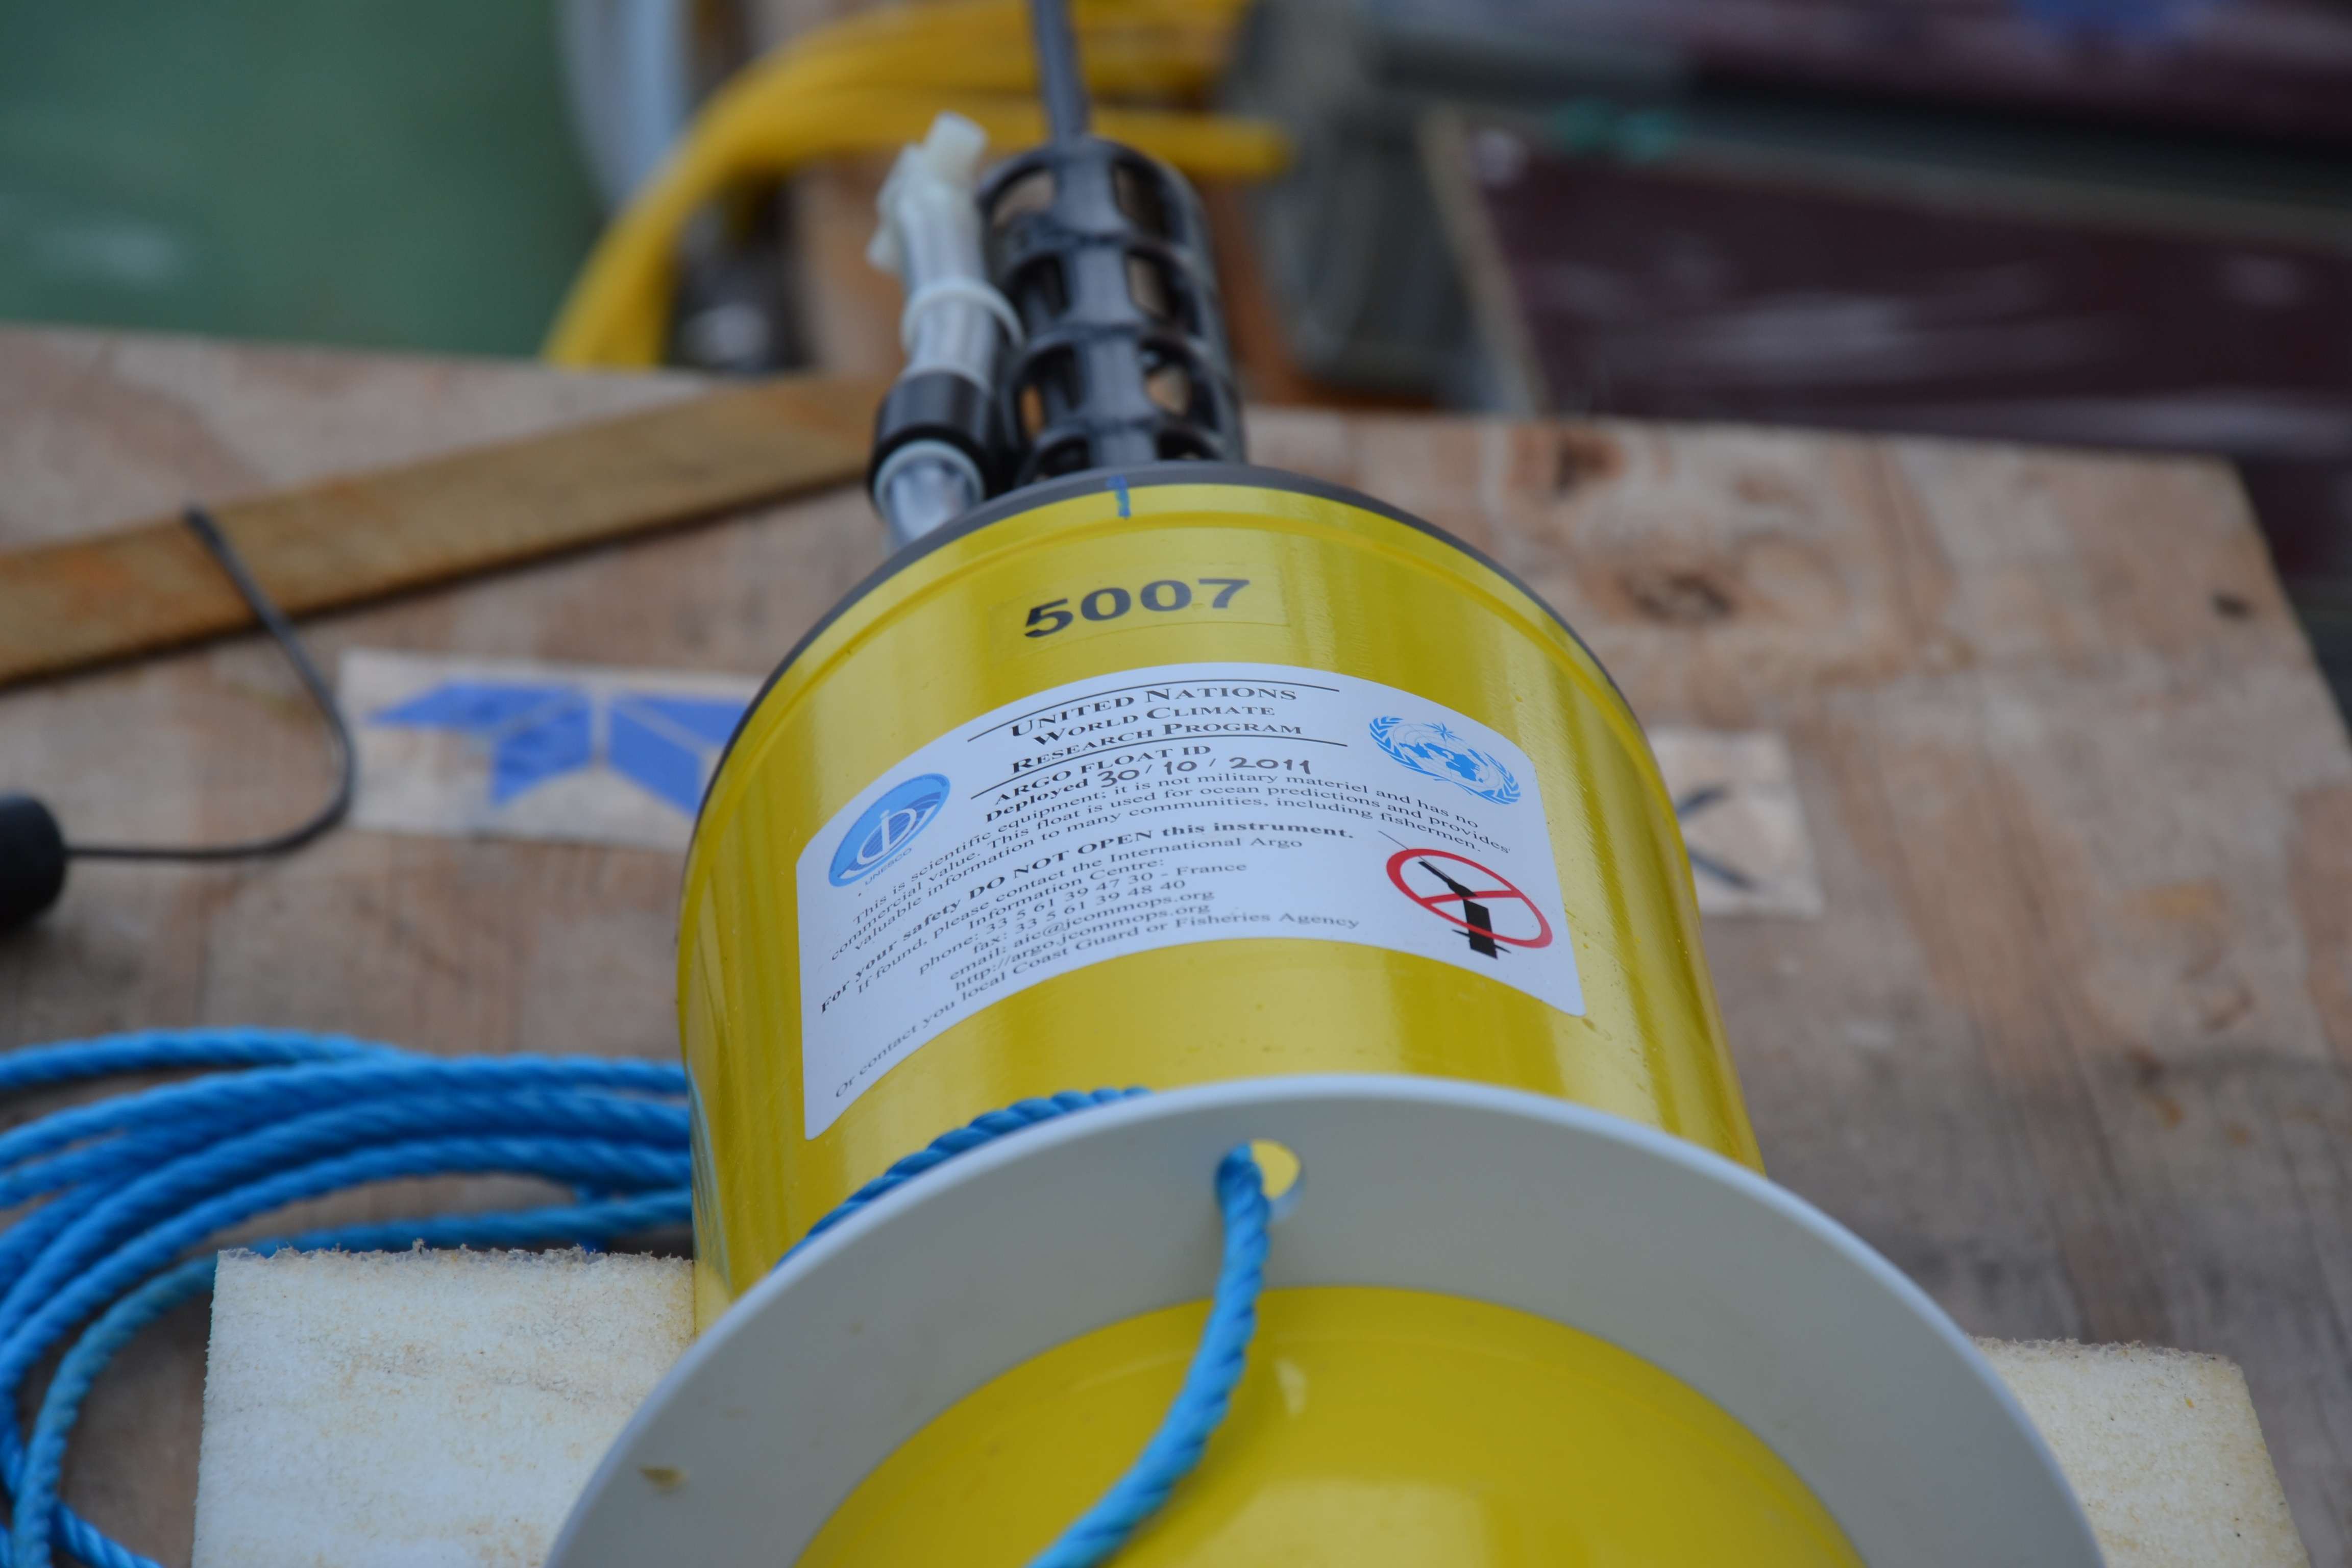
- Data
- Hosted data systems
- Argo floats
Argo floats

Temperature and salinity profiles, metadata or trajectories from the Argo floats deployed by the UK or in the Southern Ocean may be obtained.
UK floats
UK float data may be accessed via a form or from the interactive map. In both cases you will be able to select data of your choice and submit a request to BODC.
- Connect to the UK floats data request form
- Connect to the UK floats interactive map
- View further information about the data request form and the interactive map
- Access to data descriptions and tools for Argo users
On submission, your request will be handled automatically. You will be notified via email and asked to collect your data from our ftp site. Clear instructions will be provided.
Southern Ocean floats
Southern Ocean float data may be accessed from the Argo Global Data Centres via a link provided in the interactive map.
- Connect to the Southern Ocean interactive map
- View further information about the interactive map
- Access to data descriptions and tools for Argo users
Further information for UK floats
Data request form
The form may by used to select data by Argos satellite number; World Meteorological Office (WMO) number; time or geographic location. Combinations of all techniques are allowed.
Multiple selections by Argos satellite number or WMO number may be achieved by holding the Shift Key when clicking, causing a range to be selected. Alternatively, the Control Key may be held down when clicking on second and subsequent selections, this also acts as a toggle to unselect.
Having made your float selection, you are able to opt for metadata, profile and trajectory events prior to asking for a summary. The summary form allows you to further modify your request prior to submission.
Interactive map
An interactive map created using ESRI software displays all UK Argo floats. You can opt to display various layers, such as, active, overdue or failed floats; their deployment location and their trajectories. There is also the option of superimposing a 2000 m bathymetric contour, sub-sampled from the General Bathymetric Chart of the Oceans (GEBCO) data set.
Tools allow you to zoom, pan, query and select floats of interest. Float identification, last profile date and position and a plot of the temperature and salinity profile are displayed below the map area.
Data (netCDF format) may be selected by ticking a box, for individual floats, or limited by time. Having submitted your selection the information will be transferred to the UK float data summary form. This allows you to further modify your request prior to submission.
If you encounter problems with your request please email Argo Data Support for assistance.
UK floats interactive map layers
- Active Apex — Webb Apex floats that last transmitted less than 10 days ago.
- Active Provor — Martec Provor floats that last transmitted less than 10 days ago.
- Overdue Apex — Webb Apex floats that last transmitted over 10 days ago but less than 90 days ago.
- Overdue Provor — Martec Provor floats that last transmitted over 10 days ago but less than 90 days ago.
- Failed Apex — Webb Apex floats that last transmitted over 90 days ago.
- Failed Provor — Martec Provor floats that last transmitted over 90 days ago.
- Deployment (Apex) — Webb Apex float deployments (regardless of status).
- Deployment (Provor) — Martec Provor float deployments (regardless of status).
- Surface Trajectories (Apex) — Webb Apex surface trajectories (last known 90 days).
- Surface Trajectories (Provor) — Martec Provor surface trajectories (last known 90 days).
- 2000 m bathymetry — 2000 m bathymetric contour (sub-sampled from GEBCO).
- Land — Land outline
Further information for Southern Ocean floats
Interactive map
An interactive map created using ESRI software displays all Southern OceanArgo floats. You can opt to display various layers such as status, age, country of origin, deployment location or the float trajectories. There is also the option of superimposing a 2000m bathymetric contour, sub-sampled from the General Bathymetric Chart of the Oceans (GEBCO) data set and sea ice extent from the University of Bremen.
Tools allow you to zoom, pan, query and select floats of interest. Information about the selected floats and links to data (netCDF format) are displayed below the map area.
Southern Ocean floats interactive map layers
- Last position (status) — Last position colour coded with status (active or failed).
- Last position (country) — Last position colour coded with country of origin.
- Last position (age) — Last position colour coded with age.
- Deployment — Float deployment positions (regardless of status).
- Trajectories (3 months) — Surface trajectories in the last 3 months.
- Trajectories — Surface trajectories.
- 150 km buffer — 150 km buffer around last position.
- Profile density (3 months) — Profile density in 3° by 3° area, in the last 3 months.
- Profile density — Profile density in 3° by 3° area.
- 3 x 3 grid — Grid with 3° increments.
- 2000 m Bathymetry — 2000 m bathymetric contour line (Sub-sampled from GEBCO).
- Sea ice extent — monthly average.
Argo data descriptions and tools
Further information about Argo data formats and quality control procedures is available from the Coriolis web site. Useful links and tools to assist Argo users may also be accessed from the DATA>Toolbox area of the Argo Information Centre web site.
Online survey
An Argo data users survey has been developed, by the Argo community, to help understand user needs. Please take a few moments to complete the online survey.
