- Resources
- Delivery formats
- Sea level
- NTSLF format
In this section
National Tidal & Sea Level Facility (NTSLF) format
This is a series of ASCII output formats for data from the UK Tide Gauge Network. Data files are made available for
- Observation (and residual) data
- Monthly extremes ('extremes')
- Monthly extreme surges ('surges')
- Monthly means ('means')
Observation (and residual) data
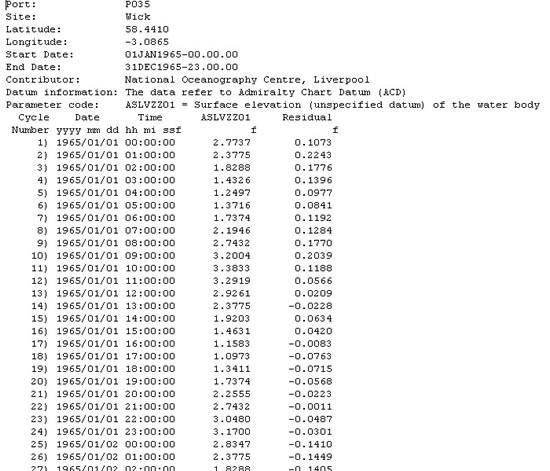
The following is an illustration of a NTSLF format file. Further information regarding the file header, the data values and quality control flags is provided below.

Header information
The file header information comprises 9 lines of metadata (information about the data) and 2 lines to define the data listed in the file as described below
Line 1 (Port) — the port identifier number assigned to the tide gauge.
Line 2 (Site) — the site name of the tide gauge installation.
Lines 3 and 4 (Latitude and Longitude) — the position of the tide gauge. The Coordinate Reference System for position is WGS84.
Lines 5 and 6 (Start date and End date) — the start and end date/time (format DD/MON/YYYY-hh.mi.ss) of the data in the file. Times are UTC and presented as 24 hour clock.
Line 7 (Contributor) — the supplier of the data.
Line 8 (Datum information) — the definition of a data value of zero.
Line 9 (Parameter code) — the parameter code that BODC uses to describe the data, it may also say a little about the instrumentation used.
Line 10 — data column headers.
Line 11 — data column formats. The 'f' (or 'flag') columns are used to indicate whether problems have been identified with the time channel, the observed sea level value and the residual (if present) respectively. The residual is calculated as the observed sea level value minus the predicted tide.
Data values
Data values are listed one per line. The first seven characters are always a data cycle count. The times are UTC. The observed sea level (and residuals when present) are in metres. Various quality control flags as listed below may appear against individual columns. A blank 'f' column indicates that the value is good.
Quality control flag descriptions
The flags are defined as
M — Improbable values - BODC quality control
N — Null value
T — Interpolated value
Monthly extremes ('extremes')
Extremes are the maximum and minimum values calculated over all sampled data during the month. The calculations exclude any interpolated data. All data are relative to Admiralty Chart Datum (ACD).
File format
Extreme values are listed one per line per month.The format is
Site, day (dd/mm/yyyy) time (24 hours UTC), minimum observed value (metres), day (dd/mm/yyyy) time (24 hours), maximum observed value (metres).
For example:
STORNOWAY,22/01/2011 15:00,.033,05/01/2011 07:15,5.102
STORNOWAY,06/02/2011 15:00,1.025,06/02/2011 08:15,4.84
Monthly extreme surges ('surges')
Extreme surges (residuals) are calculated from tidal residuals (observed sea level minus predicted tide). The predictions are derived from a database of tidal constants maintained by the National Oceanography Centre's Application Group for ports of the UK and elsewhere. All data are relative to Admiralty Chart Datum (ACD).
File format
Surge values are listed one per line per month.The format is
Site, day (dd/mm/yyyy) time (24 hours UTC), minimum surge value (metres), day (dd/mm/yyyy) time (24 hours), maximum surge value (metres).
For example:
STORNOWAY,23/01/2011 17:00,-.493,15/01/2011 20:15,.47
STORNOWAY,10/02/2011 12:30,-.152,02/02/2011 14:45,.321
Monthly means ('means')
Monthly means are calculated from a filter working on quarter-hourly values derived from one or more cubic splines applied to the raw data. The filter is a convolution of Vassie's 03B filter which converts 15-minute data to hourly values and Doodson's X0 filter. All data are relative to Admiralty Chart Datum (ACD).
File format
Mean values are listed one per line per month.The format is
Site, month (mm/yyyy), monthly mean value (metres), Number of days used to calculate the mean.
For example:
STORNOWAY,01/2011,2.886,31
STORNOWAY,02/2011,2.994,8


