Metadata Report for BODC Series Reference Number 1271222
Metadata Summary
Problem Reports
Data Access Policy
Narrative Documents
Project Information
Data Activity or Cruise Information
Fixed Station Information
BODC Quality Flags
SeaDataNet Quality Flags
Metadata Summary
Data Description |
|||||||||||||||||||||||||||||||||||||
|
|||||||||||||||||||||||||||||||||||||
Data Identifiers |
|||||||||||||||||||||||||||||||||||||
|
|||||||||||||||||||||||||||||||||||||
Time Co-ordinates(UT) |
|||||||||||||||||||||||||||||||||||||
|
|||||||||||||||||||||||||||||||||||||
Spatial Co-ordinates | |||||||||||||||||||||||||||||||||||||
|
|||||||||||||||||||||||||||||||||||||
Parameters |
|||||||||||||||||||||||||||||||||||||
|
|||||||||||||||||||||||||||||||||||||
Definition of BOTTFLAG | |||||||||||||||||||||||||||||||||||||
| BOTTFLAG | Definition |
|---|---|
| 0 | The sampling event occurred without any incident being reported to BODC. |
| 1 | The filter in an in-situ sampling pump physically ruptured during sample resulting in an unquantifiable loss of sampled material. |
| 2 | Analytical evidence (e.g. surface water salinity measured on a sample collected at depth) indicates that the water sample has been contaminated by water from depths other than the depths of sampling. |
| 3 | The feedback indicator on the deck unit reported that the bottle closure command had failed. General Oceanics deck units used on NERC vessels in the 80s and 90s were renowned for reporting misfires when the bottle had been closed. This flag is also suitable for when a trigger command is mistakenly sent to a bottle that has previously been fired. |
| 4 | During the sampling deployment the bottle was fired in an order other than incrementing rosette position. Indicative of the potential for errors in the assignment of bottle firing depth, especially with General Oceanics rosettes. |
| 5 | Water was reported to be escaping from the bottle as the rosette was being recovered. |
| 6 | The bottle seals were observed to be incorrectly seated and the bottle was only part full of water on recovery. |
| 7 | Either the bottle was found to contain no sample on recovery or there was no bottle fitted to the rosette position fired (but SBE35 record may exist). |
| 8 | There is reason to doubt the accuracy of the sampling depth associated with the sample. |
| 9 | The bottle air vent had not been closed prior to deployment giving rise to a risk of sample contamination through leakage. |
Definition of Rank |
|
|
Problem Reports
No Problem Report Found in the Database
Data Access Policy
Public domain data
These data have no specific confidentiality restrictions for users. However, users must acknowledge data sources as it is not ethical to publish data without proper attribution. Any publication or other output resulting from usage of the data should include an acknowledgment.
The recommended acknowledgment is
"This study uses data from the data source/organisation/programme, provided by the British Oceanographic Data Centre and funded by the funding body."
Narrative Documents
Niskin Bottle
The Niskin bottle is a device used by oceanographers to collect subsurface seawater samples. It is a plastic bottle with caps and rubber seals at each end and is deployed with the caps held open, allowing free-flushing of the bottle as it moves through the water column.
Standard Niskin
The standard version of the bottle includes a plastic-coated metal spring or elastic cord running through the interior of the bottle that joins the two caps, and the caps are held open against the spring by plastic lanyards. When the bottle reaches the desired depth the lanyards are released by a pressure-actuated switch, command signal or messenger weight and the caps are forced shut and sealed, trapping the seawater sample.
Lever Action Niskin
The Lever Action Niskin Bottle differs from the standard version, in that the caps are held open during deployment by externally mounted stainless steel springs rather than an internal spring or cord. Lever Action Niskins are recommended for applications where a completely clear sample chamber is critical or for use in deep cold water.
Clean Sampling
A modified version of the standard Niskin bottle has been developed for clean sampling. This is teflon-coated and uses a latex cord to close the caps rather than a metal spring. The clean version of the Levered Action Niskin bottle is also teflon-coated and uses epoxy covered springs in place of the stainless steel springs. These bottles are specifically designed to minimise metal contamination when sampling trace metals.
Deployment
Bottles may be deployed singly clamped to a wire or in groups of up to 48 on a rosette. Standard bottles and Lever Action bottles have a capacity between 1.7 and 30 L. Reversing thermometers may be attached to a spring-loaded disk that rotates through 180° on bottle closure.
Sediment core data series for cruise Mitra MT0499
Document History
Converted from CDROM documentation.
Data Originators
Christian Grenz, Centre d'Océanologie de Marseille (COM), France.
Elizabeth Alliot, Centre d'Océanologie de Marseille (COM), France.
Lionel Denis, Centre d'Océanologie de Marseille (COM), France.
Pierre Harris, Centre d'Océanologie de Marseille (COM), France.
Marie-Reine Plante Cunny, Centre d'Océanologie de Marseille (COM), France.
Raphael Plante, Centre d'Océanologie de Marseille (COM), France.
Bertrand Millet, Centre d'Océanologie de Marseille (COM), France.
Content of data series
| Parameter | Unit | Parameter code | Number of samples | Comments |
|---|---|---|---|---|
| Sediment property profiles | ||||
| Porosity | percent | POROWMXX | 5 average profiles | none |
| Water content | percent | WCWTDRXX | as above | none |
| Total organic matter and SD | percent of dry sediment | STOMLIBS SDTMLIBS | as above | none |
| Dissolved phosphate and SD | µmol l-1 | PHOSAAD1 SDPHAAD1 | as above | none |
| Dissolved silicate and SD | µmol l-1 | SLCAAAD1 SDSLAAD1 | as above | none |
| Dissolved ammonium and SD | µmol l-1 | AMONAAD1 SDAMAAD1 | as above | none |
| Dissolved nitrite and SD | µmol l-1 | NTRIAAD1 SDNIAAD1 | as above | none |
| Dissolved. nitrite+nitrate and SD | µmol l-1 | NTRZAAD1 SDNZAAD1 | as above | none |
| Total organic carbon content | percent of dry sediment | OCCNCAXT | 14 profiles | none |
| Total nitrogen content | percent of dry sediment | TNCNCNXT | as above | always below detection |
| Allo Chlorophyll-a | µg/g of dry sediment | ACACHPXT | 8 profiles | none |
| Chlorophyll-a | µg/g of dry sediment | CHACHPXT | as above | none |
| Fucoxanthine | µg/g of dry sediment | FUCCHPXT | as above | none |
| Beta-carotene | µg/g of dry sediment | BCACHPXT | as above | none |
| Phaeophytin-a | µg/g of dry sediment | PHACHPXT | as above | none |
| Chlorophyll-b | µg/g of dry sediment | CHBCHPXT | as above | none |
| Chlorophyll-c | µg/g of dry sediment | CHCCHPXT | as above | none |
| Sediment flux measurements | ||||
| Oxygen consumption and SD | mmol/m-2/d | SODMODXX DSODODXX | 5 whole cores | none |
| Ammonium fluxes and SD | µmol/m-2/d | SAMOODSS DAMOODSS | 5 whole cores | none |
| Nitrate+nitrite fluxes and SD | µmol/m-2/d | SNZOODSS DNZOODSS | 5 whole cores | none |
| Nitrite fluxes and SD | µmol/m-2/d | SNTOODSS DNTOODSS | 5 whole cores | none |
| Silicate fluxes and SD | µmol/m-2/d | SSIOODSS DSIOODSS | 5 whole cores | none |
| Phosphate fluxes and SD | µmol/m-2/d | SPHOODSS DPHOODSS | 5 whole cores | none |
Sampling strategy and methodology
Cores were collected between 19 and 28 April 1999 using a prototype of a multicorer type Mark IV built by Bowers and Connelly (Fig.1a). This corer was equipped with 4 Perspex tubes, 50 cm high,15 cm diameter. The corer allowed the sampling of 30 cm of sediments and 20 cm of overlying water, separated by an undisturbed sediment water interface (Fig. 1b).

Sampling was carried out at the main central position close to site A in the southern North Sea over the neap spring tidal cycle. A total of 27 multicorer deployments were performed, distributed into 6 sampling periods corresponding to contrasting tidal slacks. Samples collected during the first five deployment series were used to initiate 5 incubation cycles. Cores collected on 28/4/99 were used for macrobenthos analysis. Details of sampling and incubation cycles are listed below:
| Core ID | Date | Sampling Period | Cores retrieved | Flux ID | Incubation length (hours) |
|---|---|---|---|---|---|
| MC1-5 | 19/4/99 | 14:00-15:06 | 5 | E1 | 47 |
| MC6-9 | 21/4/99 | 11:50-12:25 | 5 | E2 | 55 |
| MC10-14 | 23/4/99 | 16:58-17:39 | 7 | E3 | 58 |
| MC15-17 | 26/4/99 | 08:30-09:00 | 5 | E4 | 39 |
| MC18-23 | 27/4/99 | 09:21-10:16 | 4 | E5 | 24 |
| MC24-27 | 28/4/99 | 17:04-17:35 | 4 | - | - |
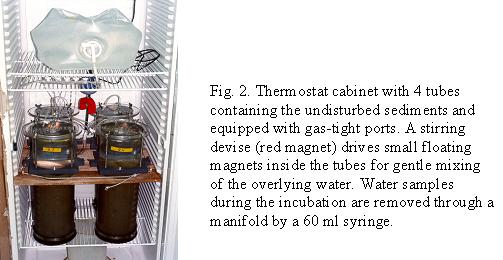
For sediment flux measurements, the tubes containing the undisturbed sediment were covered with special caps equipped with gas-tight sampling ports and incubated in the dark in a thermostat cabinet (Fig. 2). A stirring device drove small floating magnets inside the tubes for gentle mixing of the overlying water. Four replicate cores were used for each flux experiment. Incubation periods varied between 24 and 58 hours. Samples were withdrawn at regular intervals every 3 to 4 hours for oxygen and nutrient analyses. The incubation period of the last two flux experiments, E4 and E5, was reduced due to an increase in oxygen consumption associated with the presence of a high fluff layer in the cores.
Oxygen samples (10 ml) were analysed by micro-Winkler titration. Nutrient analyses (NO3, NO2, NH4, PO4 and Si(OH)4) were performed on a Technicon II autoanalyzer after filtration of 20-ml samples through GFF filters. Sediment-water flux for each nutrient and for oxygen was estimated from the slope of a linear regression of concentration against time. Standard deviations were calculated on four replicate flux measurements.
After each flux experiment, 3 sediment samples of 2.4 cm diameter and 15 cm height were taken from each of the incubated cores. These samples were then sliced into 1 cm thick sub-samples for the determination of profiles of porosity, particulate carbon and nitrogen content, pigment concentrations and nutrient concentrations.
Porosity was calculated from sample weight loss following freeze drying. A bulk density of 2.65 g/cm3 was used for all porosity calculations.
Particulate carbon and nitrogen content was measured with a Leco800 CHN Elemental Analyser. Sediment pigment content and composition was determined in the upper three centimetres only and analysed by HPLC.
Nutrient concentrations in the sediment interstitial water were measured as above. Nutrient concentrations were also measured in deep bottom water samples collected with the CTD-rosette sampler (see below).
Further description of device and analytical procedure can be found in Grenz et al (1991a,b, and 1996) and in Denis et al. 1996.
During the sediment core sampling period, bottom water was collected for the flux experiments using the rosette sampler. The sampling took place just prior to or shortly after each series of multicorer deployments. Subsamples were taken immediately after sampling to measure inorganic nutrient concentrations. Nutrient analyses were performed as described above. The data have been loaded in the relational database along with data from other water column samples collected during the cruise. Details of the parameters measured are as follows:
| Parameter | Unit | Parameter code | Number of samples | Comments |
|---|---|---|---|---|
| Ammonium | µmol l-1 | AMONAAD1 | 5 stations | none |
| Nitrate+nitrite | µmol l-1 | NTRZAAD1 | 5 stations | none |
| Nitrite | µmol l-1 | NTRIAAD1 | 5 stations | none |
| Silicate | µmol l-1 | SLCAAAD1 | 5 stations | none |
| Phosphate | µmol l-1 | PHOSAAD1 | 5 stations | none |
Oxygen and nutrient flux measurements were also performed on bottom water samples incubated in the incubation chamber alongside the sediment cores. Subsamples for oxygen and nutrient analyses were drawn as for the incubated sediment cores. Oxygen and nutrient fluxes were then derived from the slope of a linear regression of concentration against time. The results of those incubations were not loaded in the relational database and have been reproduced in the table below where negative values indicate consumption of the element measured.
| Bottom water flux measurements (all in nmol l-1 h-1) | ||||||
|---|---|---|---|---|---|---|
| Flux ID | FO2 | FNH4 | FSi(OH)4 | FNO3 | FNO2 | FPO4 |
| E1 | -1274.4 | +22.1 | +131.2 | 0.0 | -15.7 | 0.0 |
| E2 | -542.6 | +22.6 | -124.5 | 0.0 | 0.0 | -1.5 |
| E3 | -606.2 | +23.5 | 0.0 | -16.1 | -7.0 | -0.7 |
| E4 | -647.6 | +29.8 | -104.0 | 0.0 | +2.3 | 0.0 |
| E5 | -451.4 | +22.1 | 0.0 | -11.8 | 0.0 | 0.0 |
A benthic chamber was also deployed by the COM group during the cruise in order to obtain in situ measurements of sediment-water fluxes. The chamber was deployed twice. However, bad weather conditions delaying the recovery of the chamber for the first deployment, and the discovery of a leakage in the container enclosing the data logger during the second deployment, limited the amount of good data being recovered. These data are not included in the PROVESS Data Set.
BODC data processing
In order to standardise parameter units with those held in BODC's Parameter Dictionary, the following transformations were applied to the data:
- sediment oxygen flux data from the sediment to the overlying water were expressed as fluxes from water to the sediment by multiplying the originator's value by -1 (sediment oxygen consumption thus becoming positive). The units were also converted from µmol/m-2/h to mmol/m-2/d by multiplying the values by 24/1000.
- nutrient fluxes were converted from µmol/m-2/h to µmol/m-2/d by multiplying the values by 24. Nitrate sediment output flux was added to the nitrite sediment output flux and expressed as nitrate+nitrite sediment output flux.
Comments on data quality
none to report.
References
Denis L, Grenz C, Plante MR, 1996. Experimental study of microphytobenthos resuspension. C. R. Acad. Sci., Paris. Life Sciences 319: 529-535.
Grenz C, Cloern J, Cole B, Hager S, Edmunds J, Thompson J, Caffrey J, 1996. Nutrient and oxygen fluxes at the sediment-water interface around the 1996 phytoplankton bloom in South San Francisco Bay, USA. ERF-ECSA Symposium 07/96, Middelburg, The Netherlands.
Project Information
PROcesses of Vertical Exchange in Shelf Seas (PROVESS)
Introduction
PROVESS was an interdisciplinary study of the vertical fluxes of properties through the water column and the surface and bottom boundary layers. The project was funded by the European Community MAST-III programme (MAS3-CT97- 0159) and ran from March 1998 to May 2001.
Scientific Rationale
PROVESS was based on the integration of experimental, theoretical and modelling studies with the aim of improving understanding and quantification of vertical exchange processes in the water column, in particular in the surface and benthic boundary layers and across the> pycnocline. PROVESS also explored mechanisms of physical-biological coupling in which vertical exchanges and turbulence significantly affect the environmental conditions experienced by the biota with particular reference to aggregation, flocculation, sedimentation and trophic interactions.
Fieldwork
The experimental phase of the project was carried out at two contrasting sites in the North Sea: the northern North Sea site (NNS) and the southern North Sea site (SNS).
The two sites had the following characteristics:
| SNS | NNS | |
|---|---|---|
| Position | 52° 15.0' N, 4° 17.0' E | 59° 20.0' E, 1° 00.0' E |
| Time of year | April-May | September-November |
| Water depth (m) | 16 | 100 |
| M2 max amplitude (m s-1) | 0.75 | 0.15 |
| Max current (m s-1) | 1.0 | 0.6 |
| Delta T (deg C) | mixed | 7-1 |
| Thermocline depth (m) | mixed | 35-100 |
| Delta S | 1 | small |
| Halocline depth (m) | 5-10 | cf. thermocline depth |
| Max wind speed (m s-1) | 20 | 25 |
| Max wave height (m) | 5 | 10 |
| Max wave period (s) | 8 | 10 |
| Internal motion | No | Yes |
| Sediment | muddy-sand | muddy-sand |
| Biology | eutrophic | oligotrophic |
At both locations measurements were concentrated at a central position with additional measurements being made to estimate horizontal gradients. Moored instruments (including current meters, temperature and pressure sensors, fluorometers, transmissometers, nutrient analysers and meteorological sensors) were deployed between 7 September and 5 November 1998 at the NNS and between 29 March and 25 May 1999 at the SNS. Each experiment was supported by intensive measurement series made from oceanographic ships and involving turbulence dissipation profiler CTD, particle size profilers, optical profilers, benthic sampling and water bottle sampling.
Details of the cruises were as follows:
| Site | Ship (nationality) | Cruise Mnemonic | Date |
|---|---|---|---|
| NNS | Valdivia (GER) | VA174 | 5 - 17 Sep 1998 |
| Dana (DK) | D1198 | 14 - 26 Oct 1998 | |
| Pelagia (NL) | PE125 | 19 - 30 Oct 1998 | |
| Challenger (UK) | CH140 | 22 Oct - 9 Nov 1998 | |
| SNS | Pelagia (NL) | PE135 | 29 Mar - 9 Apr 1999 |
| Mitra (NL) | MT0499 | 19 - 30 Apr 1999 | |
| Belgica (BE) | BG9912 | 17 - 21 May 1999 |
Data Activity or Cruise Information
Cruise
| Cruise Name | MT0499 |
| Departure Date | 1999-04-19 |
| Arrival Date | 1999-04-30 |
| Principal Scientist(s) | S Martyn Harvey (Scottish Association for Marine Science) |
| Ship | RV Mitra |
Complete Cruise Metadata Report is available here
Fixed Station Information
No Fixed Station Information held for the Series
BODC Quality Control Flags
The following single character qualifying flags may be associated with one or more individual parameters with a data cycle:
| Flag | Description |
|---|---|
| Blank | Unqualified |
| < | Below detection limit |
| > | In excess of quoted value |
| A | Taxonomic flag for affinis (aff.) |
| B | Beginning of CTD Down/Up Cast |
| C | Taxonomic flag for confer (cf.) |
| D | Thermometric depth |
| E | End of CTD Down/Up Cast |
| G | Non-taxonomic biological characteristic uncertainty |
| H | Extrapolated value |
| I | Taxonomic flag for single species (sp.) |
| K | Improbable value - unknown quality control source |
| L | Improbable value - originator's quality control |
| M | Improbable value - BODC quality control |
| N | Null value |
| O | Improbable value - user quality control |
| P | Trace/calm |
| Q | Indeterminate |
| R | Replacement value |
| S | Estimated value |
| T | Interpolated value |
| U | Uncalibrated |
| W | Control value |
| X | Excessive difference |
SeaDataNet Quality Control Flags
The following single character qualifying flags may be associated with one or more individual parameters with a data cycle:
| Flag | Description |
|---|---|
| 0 | no quality control |
| 1 | good value |
| 2 | probably good value |
| 3 | probably bad value |
| 4 | bad value |
| 5 | changed value |
| 6 | value below detection |
| 7 | value in excess |
| 8 | interpolated value |
| 9 | missing value |
| A | value phenomenon uncertain |
| B | nominal value |
| Q | value below limit of quantification |
