Metadata Report for BODC Series Reference Number 1361879
Metadata Summary
Problem Reports
Data Access Policy
Narrative Documents
Project Information
Data Activity or Cruise Information
Fixed Station Information
BODC Quality Flags
SeaDataNet Quality Flags
Metadata Summary
Data Description |
|||||||||||||||||||||||||||||||||||||||||||||||||||||
|
|||||||||||||||||||||||||||||||||||||||||||||||||||||
Data Identifiers |
|||||||||||||||||||||||||||||||||||||||||||||||||||||
|
|||||||||||||||||||||||||||||||||||||||||||||||||||||
Time Co-ordinates(UT) |
|||||||||||||||||||||||||||||||||||||||||||||||||||||
|
|||||||||||||||||||||||||||||||||||||||||||||||||||||
Spatial Co-ordinates | |||||||||||||||||||||||||||||||||||||||||||||||||||||
|
|||||||||||||||||||||||||||||||||||||||||||||||||||||
Parameters |
|||||||||||||||||||||||||||||||||||||||||||||||||||||
|
|||||||||||||||||||||||||||||||||||||||||||||||||||||
|
|||||||||||||||||||||||||||||||||||||||||||||||||||||
Problem Reports
No Problem Report Found in the Database
Data Access Policy
Public domain data
These data have no specific confidentiality restrictions for users. However, users must acknowledge data sources as it is not ethical to publish data without proper attribution. Any publication or other output resulting from usage of the data should include an acknowledgment.
The recommended acknowledgment is
"This study uses data from the data source/organisation/programme, provided by the British Oceanographic Data Centre and funded by the funding body."
Narrative Documents
Non-toxic (underway) sea water supply
A source of uncontaminated near-surface (commonly 3 to 7 m) seawater pumped continuously to shipboard laboratories on research vessels. There is typically a temperature sensor near the intake (known as the hull temperature) to provide measurements that are as close as possible to the ambient water temperature. The flow from the supply is typically directed through continuously logged sensors such as a thermosalinograph and a fluorometer. Water samples are often collected from the non-toxic supply. The system is also referred to as the underway supply.
PD02_10 dissolved nutrient data series measured by DEOS
Originator's Data Processing
Sampling Strategy
Samples for nutrient analyses were collected by the Department of Earth and Ocean Sciences, Liverpool University (DEOS) on a National Oceanography Centre, Liverpool (NOCL) Oceans 2025 SO11 Coastal Observatory cruise (number 66) in Liverpool Bay and the Eastern Irish Sea. The cruise ran from 26 - 27 January 2010.
Near-surface and near-bed samples were taken from water bottle rosette sampling systems mounted on the lowered CTD during 21 CTD casts carried out at stations throughout Liverpool Bay and the eastern Irish Sea. Additionally, 5 individual samples were collected from the ship's flow-through environmental monitoring system at stations visited throughout 27 January 2010. The flow-through system sources all samples at a depth of 3 m.
The nutrient samples were collected directly from the rosette bottles into acid-washed, deionised water rinsed 125 ml high density polyethylene (HDPE) screw cap bottles. The HDPE bottles were rinsed 3 times with sample water and then filled with approximately 100 ml of sample. The bottles were then capped and labelled.
Data Processing
The samples were placed in a -20 °C freezer and frozen upright. The samples were transported frozen to Liverpool University for analysis. Prior to analysis, samples were defrosted in the dark and all analyses were performed within 1 week of sample collection. Analysis was carried out by splitting each single sample into triplicate sub-samples and analysing these using a Quaatro AQ2 Autoanalyzer 3 (Seal Analytical, 2006).
References
Seal Analytical, 2006. AutoAnalyzer 3 Quaatro AQ2 AACE, Seal Analytical GmbH, Werkstrasse 4, D-22844, Norderstadt, Germany
Processing Undertaken by BODC
The data were supplied to BODC as an Excel spreadsheet. This was converted to an ASCII format file for loading into the BODC archive. The variables supplied by the Data Originator were mapped to BODC parameter vocabularies as follows:
| Originator's Parameter | Units | Description | BODC Parameter Code | Units |
|---|---|---|---|---|
| mean N + N | µmol l-1 | Concentration of nitrate+nitrite {NO3+NO2} per unit volume of the water body [dissolved plus reactive particulate phase] by colorimetric autoanalysis | NTRZAATX | µmol l-1 |
| stdev | µmol l-1 | Concentration standard deviation of nitrate+nitrite {NO3+NO2} per unit volume of the water body [dissolved plus reactive particulate phase] by colorimetric autoanalysis | SDNZAATX | µmol l-1 |
| mean silicate | µmol l-1 | Concentration of silicate {SiO4} per unit volume of the water body [dissolved plus reactive particulate phase] by colorimetric autoanalysis | SLCAAATX | µmol l-1 |
| stdev | µmol l-1 | Concentration standard deviation of silicate {SiO4} per unit volume of the water body [dissolved plus reactive particulate phase] by colorimetric autoanalysis | SLSDAATX | µmol l-1 |
| mean phosphate | µmol l-1 | Concentration of phosphate {PO4} per unit volume of the water body [dissolved plus reactive particulate phase] by colorimetric autoanalysis | PHOSAATX | µmol l-1 |
| stdev | µmol l-1 | Concentration standard deviation of phosphate {PO4} per unit volume of the water body [dissolved plus reactive particulate phase] by colorimetric autoanalysis | SDPHAATX | µmol l-1 |
| mean nitrite | µmol l-1 | Concentration of nitrite {NO2} per unit volume of the water body [dissolved plus reactive particulate phase] by colorimetric autoanalysis | NTRIAATX | µmol l-1 |
| stdev | µmol l-1 | Concentration standard deviation of nitrite {NO2} per unit volume of the water body [dissolved plus reactive particulate phase] by colorimetric autoanalysis | NTSDAATX | µmol l-1 |
The data were loaded into the database by matching the sample's station identifier and depth with the information already held in the database for this cruise. Records for this cruise indicated that, with the exception of cast CTD013, all near-bed samples from the CTD were taken from rosette bottle 3. For CTD013, the near-bed sample was taken from rosette bottle 11. All surface data, with the exceptions of CTD013 and CTD022, were taken from rosette bottle 10. For CTD013, rosette bottle 3 was used for the near-surface sample and for CTD022, the near-surface sample was sourced from rosette bottle 6.
Nutrient data were collected from Site 8 and Site 15 during this cruise. The data from these samples have not been loaded into the database due to a labelling problem, meaning it was not possible to link each sample with the correct cast. The sample values are however available on request.
Project Information
Oceans 2025 Theme 10, Sustained Observation Activity 11: Liverpool Bay and Irish Sea Coastal Observatory
Sustained, systematic observations of the ocean and continental shelf seas at appropriate time and space scales allied to numerical models are key to understanding and prediction. In shelf seas these observations address issues as fundamental as 'what is the capacity of shelf seas to absorb change?' encompassing the impacts of climate change, biological productivity and diversity, sustainable management, pollution and public health, safety at sea and extreme events. Advancing understanding of coastal processes to use and manage these resources better is challenging; important controlling processes occur over a broad range of spatial and temporal scales which cannot be simultaneously studied solely with satellite or ship-based platforms.
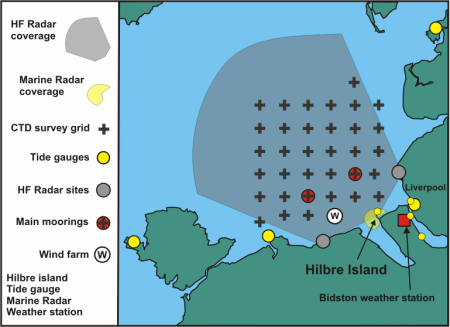
Considerable effort has been spent by the Proudman Oceangraphic Laboratory (POL) in the years 2001 - 2006 in setting up an integrated observational and now-cast modelling system in Liverpool Bay (see Figure), with the recent POL review stating the observatory was seen as a leader in its field and a unique 'selling' point of the laboratory. Cost benefit analysis (IACMST, 2004) shows that benefits really start to accrue after 10 years. In 2007 - 2012 exploitation of (i) the time series being acquired, (ii) the model-data synthesis and (iii) the increasingly available quantities of real-time data (e.g. river flows) can be carried out through Sustained Observation Activity (SO) 11, to provide an integrated assessment and short term forecasts of the coastal ocean state.
Overall Aims and Purpose of SO 11
- To continue and enlarge the scope of the existing coastal observatory in Liverpool Bay to routinely monitor the northern Irish Sea
- To develop the synthesis of measurements and models in the coastal ocean to optimize measurement arrays and forecast products. Driving forward shelf seas' operational oceanography with the direct objective of improving the national forecasting capability, expressed through links to the National Centre for Ocean Forecasting (NCOF)
- To exploit the long time-series of observations and model outputs to: a) identify the roles of climate and anthropogenic inputs on the coastal ocean's physical and biological functioning (including impacts of nutrient discharges, offshore renewable energy installations and fishing activity) taking into consideration the importance of events versus mean storms / waves, river discharge / variable salinity stratification / horizontal gradients; b) predict the impacts of climate change scenarios; and c) provide new insights to Irish Sea dynamics for variables either with seasonal cycles and interannual variability, or which show weak or no seasonal cycles
- To provide and maintain a 'laboratory' within which a variety of observational and model experiments can be undertaken (Oceans 2025 Themes 3, 6, 8, 9), including capture of extreme events
- Demonstrate the value of an integrated approach in assessment and forecasting
- Demonstrate the coastal observatory as a tool for marine management strategies through collaboration with the Environment Agency (EA), Department for Environment, Food and Rural Affairs (DEFRA), Joint Nature Conservation Commmittee (JNCC), English Nature (EN), Department of Agriculture and Rural Development (DARD), and Local Authorities, providing management information pertinent to policy (e.g. Water Framework Directive)
Measurement and Modelling Activities
- East Mooring Site: Bottom frame with full suite of physical measurements (high frequency Acoustic Doppler Current Profiler (ADCP), conductivity, temperature, turbidity and fluorescence), a Centre for Environment, Fisheries and Aquaculture Science (CEFAS) directional wavebuoy, and a CEFAS Smartbuoy collecting surface properties including salinity, temperature, turbidity, nutrients, irradiance and chlorophyll. All transmit data in real-time via Orbcomm. The Smartbuoy also collects daily water samples.
- West Mooring Site: Bottom frame with full suite of physical measurements (high frequency ADCP, conductivity, temperature, turbidity and fluorescence), CEFAS Smartbuoy.
- Spatial Survey: Four - six week intervals (determined by biofouling of optical sensors). Spatial surveys comprise of vertical profiles of CTD, suspended particulate material (SPM), some bed sediment sampling and surface and bed nutrients, phytoplankton, zooplankton.
- Ferry: The Birkenhead - Belfast ferry samples near surface (5 m depth) temperature, salinity, turbidity, chlorophyll, with data transmitted by Orbcomm. The route is scientifically varied passing through six completely different hydrodynamic regions, which significantly impact on their ecological function.
- Tide gauges: Real-time data are obtained from tide gauges operated by Mersey Docks and Harbour Company (MDHC) and the UK tide gauge network.
- Satellite imagery: Weekly composite satellite data, Advanced Very High Resolution Radiometer (AVHRR) sea surface temperature (SST) and ocean colour (chlorophyll and suspended sediment), are provided by the Remote Sensing Data Analysis Service (RSDAS) based at Plymouth Marine Laboratory (PML).
- HF radar: A phased array HF radar system (a 12-16MHz WERA HF radar) measuring surface currents and waves with maximum range 75km at a resolution of 4km for sea surface currents and for 2-D wave spectra.
- Meteorology station: With web camera, located on Hilbre Island at the mouth of the Dee Estuary
- Operational models: The Coastal Observatory uses Proudman Oceanographic Laboratory Coastal Ocean Modelling System (POLCOMS), which is part of Oceans 2025 Theme 9.
More detailed information on this Work Package is available at pages 32 - 35 of the official Oceans 2025 Theme 10 document: Oceans 2025 Theme 10
Weblink: http://www.oceans2025.org/
References:
IACMST., 2004. The Economics of Sustained Marine Measurements. IACMST Information Document, N0.11, Southampton: IACMST, 96 pp
Data Activity or Cruise Information
Cruise
| Cruise Name | PD02/10 |
| Departure Date | 2010-01-26 |
| Arrival Date | 2010-01-27 |
| Principal Scientist(s) | Matthew R Palmer (Proudman Oceanographic Laboratory) |
| Ship | RV Prince Madog |
Complete Cruise Metadata Report is available here
Fixed Station Information
No Fixed Station Information held for the Series
BODC Quality Control Flags
The following single character qualifying flags may be associated with one or more individual parameters with a data cycle:
| Flag | Description |
|---|---|
| Blank | Unqualified |
| < | Below detection limit |
| > | In excess of quoted value |
| A | Taxonomic flag for affinis (aff.) |
| B | Beginning of CTD Down/Up Cast |
| C | Taxonomic flag for confer (cf.) |
| D | Thermometric depth |
| E | End of CTD Down/Up Cast |
| G | Non-taxonomic biological characteristic uncertainty |
| H | Extrapolated value |
| I | Taxonomic flag for single species (sp.) |
| K | Improbable value - unknown quality control source |
| L | Improbable value - originator's quality control |
| M | Improbable value - BODC quality control |
| N | Null value |
| O | Improbable value - user quality control |
| P | Trace/calm |
| Q | Indeterminate |
| R | Replacement value |
| S | Estimated value |
| T | Interpolated value |
| U | Uncalibrated |
| W | Control value |
| X | Excessive difference |
SeaDataNet Quality Control Flags
The following single character qualifying flags may be associated with one or more individual parameters with a data cycle:
| Flag | Description |
|---|---|
| 0 | no quality control |
| 1 | good value |
| 2 | probably good value |
| 3 | probably bad value |
| 4 | bad value |
| 5 | changed value |
| 6 | value below detection |
| 7 | value in excess |
| 8 | interpolated value |
| 9 | missing value |
| A | value phenomenon uncertain |
| B | nominal value |
| Q | value below limit of quantification |
