Metadata Report for BODC Series Reference Number 1687093
Metadata Summary
Problem Reports
Data Access Policy
Narrative Documents
Project Information
Data Activity or Cruise Information
Fixed Station Information
BODC Quality Flags
SeaDataNet Quality Flags
Metadata Summary
Data Description |
|||||||||||||||||||||||||||||||||||||||||
|
|||||||||||||||||||||||||||||||||||||||||
Data Identifiers |
|||||||||||||||||||||||||||||||||||||||||
|
|||||||||||||||||||||||||||||||||||||||||
Time Co-ordinates(UT) |
|||||||||||||||||||||||||||||||||||||||||
|
|||||||||||||||||||||||||||||||||||||||||
Spatial Co-ordinates | |||||||||||||||||||||||||||||||||||||||||
|
|||||||||||||||||||||||||||||||||||||||||
Parameters |
|||||||||||||||||||||||||||||||||||||||||
|
|||||||||||||||||||||||||||||||||||||||||
Definition of BOTTFLAG | |||||||||||||||||||||||||||||||||||||||||
| BOTTFLAG | Definition |
|---|---|
| 0 | The sampling event occurred without any incident being reported to BODC. |
| 1 | The filter in an in-situ sampling pump physically ruptured during sample resulting in an unquantifiable loss of sampled material. |
| 2 | Analytical evidence (e.g. surface water salinity measured on a sample collected at depth) indicates that the water sample has been contaminated by water from depths other than the depths of sampling. |
| 3 | The feedback indicator on the deck unit reported that the bottle closure command had failed. General Oceanics deck units used on NERC vessels in the 80s and 90s were renowned for reporting misfires when the bottle had been closed. This flag is also suitable for when a trigger command is mistakenly sent to a bottle that has previously been fired. |
| 4 | During the sampling deployment the bottle was fired in an order other than incrementing rosette position. Indicative of the potential for errors in the assignment of bottle firing depth, especially with General Oceanics rosettes. |
| 5 | Water was reported to be escaping from the bottle as the rosette was being recovered. |
| 6 | The bottle seals were observed to be incorrectly seated and the bottle was only part full of water on recovery. |
| 7 | Either the bottle was found to contain no sample on recovery or there was no bottle fitted to the rosette position fired (but SBE35 record may exist). |
| 8 | There is reason to doubt the accuracy of the sampling depth associated with the sample. |
| 9 | The bottle air vent had not been closed prior to deployment giving rise to a risk of sample contamination through leakage. |
Definition of Rank |
|
|
Problem Reports
No Problem Report Found in the Database
Data Access Policy
Public domain data
These data have no specific confidentiality restrictions for users. However, users must acknowledge data sources as it is not ethical to publish data without proper attribution. Any publication or other output resulting from usage of the data should include an acknowledgment.
The recommended acknowledgment is
"This study uses data from the data source/organisation/programme, provided by the British Oceanographic Data Centre and funded by the funding body."
Narrative Documents
Technicap NOEX bottle
The Technicap NOEX water bottle was designed for oceanographic sampling. The bottle comprises a plastic tube with caps at each end and is deployed with the caps held open, then closed at the target depth. Multiple bottles can be deployed on a CTD frame rosette. Bottle capacity is variable, but normally several litres. The bottle was developed by Technicap in the 1990s but has been superseded by more recent models. There is no known source of support available for this sampler.
Phytoplankton pigment concentration data series for cruise Pelagia PE136
Document History
Converted from CDROM documentation
Data Originators
Paul Tett, Napier University, Edinburgh, UK.
Karen Wild-Allen, Napier University, Edinburgh, UK.
Content of data series
| Parameter | Unit | Parameter code | Number of samples | Number of stations | Comments |
|---|---|---|---|---|---|
| Chl.a (Lorenzen) | µg l-1 | CPHLSPP1 | 100 | 35 CTD + 14 NT + 1 BUCKET | none |
| Phaeop.a (Lorenzen) | µg l-1 | PHAESPP1 | 100 | as above | none |
| Chl.a (SCOR) | µg l-1 | CPHLSSP1 | 100 | as above | none |
| Chl.b (SCOR) | ng l-1 | CHLBSSP1 | 100 | as above | none |
| Chl.c (SCOR) | ng l-1 | CHLCSSP1 | 100 | as above | none |
| Carotenoids (SCOR) | µg l-1 | CAROSSP1 | 100 | as above | none |
| Chl.a >5 µm (Lorenzen) | µg l-1 | SCHLSPPA | 23 | 7 CTD + 1 BUCKET | none |
| Phaeop.a >5 µm (Lorenzen) | µg l-1 | SPHASPPA | 23 | as above | none |
| Chl.a >5 µm (SCOR) | µg l-1 | SCHLSSPA | 23 | as above | none |
| Chl.b >5 µm (SCOR) | ng l-1 | SCHBSSPA | 23 | as above | none |
| Chl.c >5 µm (SCOR) | ng l-1 | SCHCSSPA | 23 | as above | none |
| Carotenoids >5 µm (SCOR) | µg l-1 | SCARSSPA | 23 | as above | none |
| Chl.a <5 µm (Lorenzen) | µg l-1 | SCHLSPPM | 23 | 7 CTD + 1 BUCKET | none |
| Phaeop.a <5 µm (Lorenzen) | µg l-1 | SPHASPPM | 23 | as above | none |
| Chl.a <5 µm (SCOR) | µg l-1 | SCHLSSPM | 23 | as above | none |
| Chl.b <5 µm (SCOR) | ng l-1 | SCHBSSPM | 23 | as above | none |
| Chl.c <5 µm (SCOR) | ng l-1 | SCHCSSPM | 23 | as above | none |
| Carotenoids <5 µm (SCOR) | µg l-1 | SCARSSPM | 23 | as above | none |
CTD= CTD-Rosette water column sampling station.
NT= surface underway sampling from ship's non-toxic supply.
Sampling strategy and methodology
Water samples were mainly collected using the CTD-rosette water sampler. Samples were typically taken from the near-surface for comparison with optical measurements and from 1 to 2 additional depths in the water column. Additional samples were occasionally taken at the surface with a bucket and from the ship's non-toxic sea water supply.
Samples were filtered under vacuum through Micropore membrane (5 µm) and/or Whatman glass fibre filters (GF/F 0.7 µm). Filters were then placed in labelled test-tubes and stored in a dark container with dessicant in the freezer. Following the cruise the samples were transferred to the laboratory freezer to await extraction and analysis (at the University of Wales, Bangor).
Pigments on the filters were extracted in 10 ml 90% analar acetone (10% miliQ water, buffered with sodium bicarbonate), stored in a dark container and refrigerated for 24 hours. Extracted samples were centrifuged at 10,000 rpm for 10 minutes and decanted into 1 cm pathlength micro-cuvettes. The Shumidzu spectrophotometer holds 2 cuvettes and is initialised by measuring the optical density of 2 blanks (cuvettes filled with 90% acetone) in 0.5 nm bandwidths from 345 - 755 nm. This generates a 'baseline' against which samples are compared. Sample optical densities were measured (in 0.5 nm bandwidths from 345 - 755 nm) by replacing 1 blank with a sample-filled cuvette. To evaluate pheopigment concentration the samples were acidified with 3 drops of 2 molar hydrochloric acid and measured again.
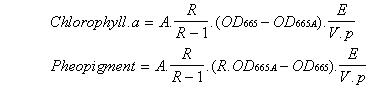
Pigment concentrations can be calculated from spectra by comparing the ratios of absorption at various wavelengths. Equations for each pigment are given in µg l-1.
Lorenzen method:
Trichromatic method with Jeffrey and Humphrey (1975) coefficients:

Carotenoids:

| where: | A is the pigment coefficient (11 µg cm ml-1) |
| R is the ratio of chlorophyll.a to pheopigment absorbance at 665 nm (1.7) | |
| OD665 is the optical density at 665 nm relative to 750 nm | |
| OD665A is the optical density of the acidified sample at 665 nm relative to 750 nm | |
| E is the extract volume (ml) | |
| V is the sample volume filtered (l) | |
| p is the cuvette pathlength (cm). |
BODC processing
In order to standardise parameter units with that held in BODC's parameter dictionary, chlorophyll b and c concentrations were converted from µg l-1 to ng l-1 by multiplying their original values by 1000. The rest of the data were loaded into a database under the ORACLE Relational Database Management System without modification.
Comments on data quality
None to report.
Reference
Jeffrey SW, Humphrey SF (1975) New spectrophotometric equations for determining chlorophylls a, b, c1 and c2 in higher plants, algae and phytoplankton. Biochem. Biophysiol. Planzen, 167, 191-194.
Project Information
PROcesses of Vertical Exchange in Shelf Seas (PROVESS)
Introduction
PROVESS was an interdisciplinary study of the vertical fluxes of properties through the water column and the surface and bottom boundary layers. The project was funded by the European Community MAST-III programme (MAS3-CT97- 0159) and ran from March 1998 to May 2001.
Scientific Rationale
PROVESS was based on the integration of experimental, theoretical and modelling studies with the aim of improving understanding and quantification of vertical exchange processes in the water column, in particular in the surface and benthic boundary layers and across the> pycnocline. PROVESS also explored mechanisms of physical-biological coupling in which vertical exchanges and turbulence significantly affect the environmental conditions experienced by the biota with particular reference to aggregation, flocculation, sedimentation and trophic interactions.
Fieldwork
The experimental phase of the project was carried out at two contrasting sites in the North Sea: the northern North Sea site (NNS) and the southern North Sea site (SNS).
The two sites had the following characteristics:
| SNS | NNS | |
|---|---|---|
| Position | 52° 15.0' N, 4° 17.0' E | 59° 20.0' E, 1° 00.0' E |
| Time of year | April-May | September-November |
| Water depth (m) | 16 | 100 |
| M2 max amplitude (m s-1) | 0.75 | 0.15 |
| Max current (m s-1) | 1.0 | 0.6 |
| Delta T (deg C) | mixed | 7-1 |
| Thermocline depth (m) | mixed | 35-100 |
| Delta S | 1 | small |
| Halocline depth (m) | 5-10 | cf. thermocline depth |
| Max wind speed (m s-1) | 20 | 25 |
| Max wave height (m) | 5 | 10 |
| Max wave period (s) | 8 | 10 |
| Internal motion | No | Yes |
| Sediment | muddy-sand | muddy-sand |
| Biology | eutrophic | oligotrophic |
At both locations measurements were concentrated at a central position with additional measurements being made to estimate horizontal gradients. Moored instruments (including current meters, temperature and pressure sensors, fluorometers, transmissometers, nutrient analysers and meteorological sensors) were deployed between 7 September and 5 November 1998 at the NNS and between 29 March and 25 May 1999 at the SNS. Each experiment was supported by intensive measurement series made from oceanographic ships and involving turbulence dissipation profiler CTD, particle size profilers, optical profilers, benthic sampling and water bottle sampling.
Details of the cruises were as follows:
| Site | Ship (nationality) | Cruise Mnemonic | Date |
|---|---|---|---|
| NNS | Valdivia (GER) | VA174 | 5 - 17 Sep 1998 |
| Dana (DK) | D1198 | 14 - 26 Oct 1998 | |
| Pelagia (NL) | PE125 | 19 - 30 Oct 1998 | |
| Challenger (UK) | CH140 | 22 Oct - 9 Nov 1998 | |
| SNS | Pelagia (NL) | PE135 | 29 Mar - 9 Apr 1999 |
| Mitra (NL) | MT0499 | 19 - 30 Apr 1999 | |
| Belgica (BE) | BG9912 | 17 - 21 May 1999 |
Data Activity or Cruise Information
Data Activity
| Start Date (yyyy-mm-dd) | 1999-04-07 |
| End Date (yyyy-mm-dd) | 1999-04-07 |
| Organization Undertaking Activity | Royal Netherlands Institute for Sea Research |
| Country of Organization | Netherlands |
| Originator's Data Activity Identifier | PE136_CTD_CTD118 |
| Platform Category | lowered unmanned submersible |
BODC Sample Metadata Report for PE136_CTD_CTD118
| Sample reference number | Nominal collection volume(l) | Bottle rosette position | Bottle firing sequence number | Minimum pressure sampled (dbar) | Maximum pressure sampled (dbar) | Depth of sampling point (m) | Bottle type | Sample quality flag | Bottle reference | Comments |
|---|---|---|---|---|---|---|---|---|---|---|
| 382764 | 12.00 | 14.40 | 15.90 | 14.50 | Technicap NOEX bottle | No problem reported | ||||
| 382765 | 12.00 | 5.30 | 6.80 | 5.50 | Technicap NOEX bottle | No problem reported | ||||
| 382766 | 12.00 | 1.40 | 2.90 | 1.60 | Technicap NOEX bottle | No problem reported |
Please note:the supplied parameters may not have been sampled from all the bottle firings described in the table above. Cross-match the Sample Reference Number above against the SAMPRFNM value in the data file to identify the relevant metadata.
Cruise
| Cruise Name | PE136 |
| Departure Date | 1999-03-29 |
| Arrival Date | 1999-04-09 |
| Principal Scientist(s) | Hans van Haren (Royal Netherlands Institute for Sea Research) |
| Ship | RV Pelagia |
Complete Cruise Metadata Report is available here
Fixed Station Information
No Fixed Station Information held for the Series
BODC Quality Control Flags
The following single character qualifying flags may be associated with one or more individual parameters with a data cycle:
| Flag | Description |
|---|---|
| Blank | Unqualified |
| < | Below detection limit |
| > | In excess of quoted value |
| A | Taxonomic flag for affinis (aff.) |
| B | Beginning of CTD Down/Up Cast |
| C | Taxonomic flag for confer (cf.) |
| D | Thermometric depth |
| E | End of CTD Down/Up Cast |
| G | Non-taxonomic biological characteristic uncertainty |
| H | Extrapolated value |
| I | Taxonomic flag for single species (sp.) |
| K | Improbable value - unknown quality control source |
| L | Improbable value - originator's quality control |
| M | Improbable value - BODC quality control |
| N | Null value |
| O | Improbable value - user quality control |
| P | Trace/calm |
| Q | Indeterminate |
| R | Replacement value |
| S | Estimated value |
| T | Interpolated value |
| U | Uncalibrated |
| W | Control value |
| X | Excessive difference |
SeaDataNet Quality Control Flags
The following single character qualifying flags may be associated with one or more individual parameters with a data cycle:
| Flag | Description |
|---|---|
| 0 | no quality control |
| 1 | good value |
| 2 | probably good value |
| 3 | probably bad value |
| 4 | bad value |
| 5 | changed value |
| 6 | value below detection |
| 7 | value in excess |
| 8 | interpolated value |
| 9 | missing value |
| A | value phenomenon uncertain |
| B | nominal value |
| Q | value below limit of quantification |
