Metadata Report for BODC Series Reference Number 1764009
Metadata Summary
Problem Reports
Data Access Policy
Narrative Documents
Project Information
Data Activity or Cruise Information
Fixed Station Information
BODC Quality Flags
SeaDataNet Quality Flags
Metadata Summary
Data Description |
|||||||||||||||||||||||||||||||||||||||||
|
|||||||||||||||||||||||||||||||||||||||||
Data Identifiers |
|||||||||||||||||||||||||||||||||||||||||
|
|||||||||||||||||||||||||||||||||||||||||
Time Co-ordinates(UT) |
|||||||||||||||||||||||||||||||||||||||||
|
|||||||||||||||||||||||||||||||||||||||||
Spatial Co-ordinates | |||||||||||||||||||||||||||||||||||||||||
|
|||||||||||||||||||||||||||||||||||||||||
Parameters |
|||||||||||||||||||||||||||||||||||||||||
|
|||||||||||||||||||||||||||||||||||||||||
|
|||||||||||||||||||||||||||||||||||||||||
Problem Reports
No Problem Report Found in the Database
Loch Sunart Short-term Mooring Quality Report
Screening and Quality Control
Data have had quality control applied by the Scottish Environment Protection Agency (SEPA) with suspect data being removed. Data then went through BODC quality control procedure where suspect data are flagged but not removed.
During screening, noisy periods were observed in CPHLZZXX and TURBXXXX and obvious spikes were looked at in closer detail and flagged if necessary. Any extended periods of suspect data were discussed with SEPA before flagging.
Oxygen saturation was high in places with some points of supersaturation but data were not considered to require flagging.
Within the data there are periods where the sampling period is longer than the expected 15 or 30 minutes which the originator believes to be due to a power issue with the sonde.
CPHLZZXX
For a period of five days at the end of series 4, CPHLZZXX is constantly zero μ L-1 and every few hours increases to 285.3 μ L-1 for two cycles after which CPHLZZXX returns to zero. This has been discussed with the originator and SEPA have confirmed that they have marked this data as suspect. SEPA would not recommend using these data and so the values have been flagged suspect by BODC.
TURBXXXX
While discussing CPHLZZXX with the originator, it was also highlighted that SEPA had identified a potential biofouling event causing a spike in the TURBXXXX data covering the later half of series 6. SEPA would recommend removing these data from the series, however the affected data have been flagged suspect by BODC.
Data Access Policy
Open Data
These data have no specific confidentiality restrictions for users. However, users must acknowledge data sources as it is not ethical to publish data without proper attribution. Any publication or other output resulting from usage of the data should include an acknowledgment.
If the Information Provider does not provide a specific attribution statement, or if you are using Information from several Information Providers and multiple attributions are not practical in your product or application, you may consider using the following:
"Contains public sector information licensed under the Open Government Licence v1.0."
Narrative Documents
YSI 6-Series multiparameter water quality sondes
Basic information
Comprehensive multi-parameter, water quality monitoring sondes. Designed for long-term monitoring, profiling and spot sampling. The 6-series may be split into several categories: V2 Sondes, 600 Sondes, Drinking Water Sondes and System. Each category has a slightly different design purpose with V2 Sondes ideal for long-term monitoring with a greater number of parameters, whereas 600 sondes are ideal for specific applications with fewer parameters available.
Model features/parameters
| Features/Parameters | V2 Sondes | 600 Sondes | Drinking Water | System | ||||||||
|---|---|---|---|---|---|---|---|---|---|---|---|---|
| 6600 | 6600EDS | 6920 | 6820 | 600OMS | 600R | 600XL | 600XLM | 600LS | 6920DW | 600DW-B | 600QS | |
| Field-replaceable probes | S | S | S | S | S | S | S | S | S | |||
| RS-232 and SDI-12 standard | S | S | S | S | S | S | S | S | S | S | S | S |
| Fits 2" wells | S | S | S | S | S | S | S | |||||
| Internal memory | S | S | S | S | S | S | S | S | S | S | S | S |
| Internal power (batteries) | S | S | S | CS | S | CS | S | S | ||||
| Flow cell | CS | SO | CS | CS | CS | CS | CS | CS | CS | CS | ||
| Ammonium/ammonia* | I | CS | CS | SO | SO | |||||||
| Blue green algae | CS | CS | CS | CS | CS | R1 | R1 | |||||
| Chloride* | I | CS | CS | SO | SO | |||||||
| Chlorophyll | CS | CS | CS | CS | CS | R1 | R1 | |||||
| Conductivity | S | S | S | S | S | S | S | S | CS | S | S | S |
| Depth | CS | CS | CS | CS | CS | CS | CS | CS | ||||
| Dissolved oxygen | I | CS | R2 | R2 | CS | CS | CS | CS | ||||
| Dissolved oxygen, optical | CS | CS | CS | CS | CS | R1 | R1 | |||||
| Free chlorine | CS | CS | ||||||||||
| Nitrate* | I | CS | CS | SO | SO | |||||||
| Open channel flow** | CS | CS | CS | CS | CS | CS | CS | S | ||||
| ORP | CS | CS | CS | CS | CS | CS | CS | CS | CS | |||
| PAR (Photosynthetically Active Radiation) | I | I | ||||||||||
| pH | CS | CS | CS | CS | CS | CS | CS | CS | CS | CS | ||
| Resistivity** | S | S | S | S | S | S | S | S | CS | S | S | S |
| Rhodamine | CS | CS | CS | CS | CS | R1 | R1 | |||||
| Salinity | S | S | S | S | S | S | S | S | CS | S | S | S |
| Specific conductance** | S | S | S | S | S | S | S | S | CS | S | S | S |
| Temperature | S | S | S | S | S | S | S | S | S | S | S | S |
| Total dissolved solids** | S | S | S | S | S | S | S | S | CS | S | S | S |
| Turbidity | CS | CS | CS | CS | CS | R1 | R1 | CS | ||||
| Vented level | CS | CS | CS | CS | CS | CS | CS | S | ||||
*Freshwater only**Calculated parameters
| Where | ||
| S | = | Standard |
| CS | = | Customer Selectable |
| SO | = | Special Order |
| R1 | = | Available only on 600XL V2 or 600XLM V2 |
| R2 | = | Available on 6920 V2-1 or 6820 V2-1 |
| I | = | Available only on 6600 V2-2 |
Sensor Specifications
| Range | Resolution | Accuracy | |
|---|---|---|---|
| Rapid Pulse dissolved oxygen % air saturation | 0 to 500% | 0.1% | 0 to 200%: ±2% of reading or 2% air saturation saturation, whichever is greater; 200 to 500%: ±6% of reading |
| Rapid Pulse dissolved oxygen mg/L | 0 to 50 mg/L | 0.01 mg/L | 0 to 20 mg/L: ±2% of reading or 0.2 mg/L, mg/L whichever is greater; 20 to 50 mg/L: ±6% of reading |
| ROX optical dissolved oxygena % air saturation | 0 to 500% | 0.1% | 0 to 200%: ±1% of reading or 1% air % air saturation saturation, whichever is greater; 200 to 500%: ±15% of reading; relative to calibration gases |
| ROX optical dissolved oxygena mg/L | 0 to 50 mg/L | 0.01 mg/L | 0 to 20 mg/L: ±1% of reading or 0.1 mg/L, mg/L whichever is greater; 20 to 50 mg/L: ±15% of reading; relative to calibration gases |
| Conductivityc | 0 to 100 mS/cm | 0.001 to 0.1 mS/cm | ±0.5% of reading + 0.001 mS/cm (range-dependent) |
| Temperature | -5 to 50°C | 0.01°C | ±0.15°C |
| pH | 0 to 14 units | 0.01 unit | ±0.2 unit |
| Shallow depth | 0 to 9.1 m (0 to 30 ft) | 0.001 m (0.001 ft) | ±0.018 m (±0.06 ft) |
| Medium depth | 0 to 61 m (0 to 200 ft) | 0.001 m (0.001 ft) | ±0.12 m (±0.4 ft) |
| Deep depth | 0 to 200 m (0 to 656 ft) | 0.001 m (0.001 ft) | ±0.3 m (±1 ft) |
| Vented level | 0 to 9.1 m (0 to 30 ft) | 0.001 m (0.001 ft) | ±0.003 m (?0.01 ft) |
| Open-channel flow | Calculated measurement, requires vented level | ||
| Free chlorine | 0 to 3 mg/L | 0.01 mg/L | ±15% of reading or 0.05 mg/L, whichever is greater |
| ORP | -999 to +999 mV | 0.1 mV | ±20 mV in Redox standard solutions |
| Salinity | 0 to 70 ppt | 0.01 ppt | ±1% of reading or 0.1 ppt, whichever is greater |
| Nitrate/nitrogenb | 0 to 200 mg/L-N | 0.001 to 1 mg/L-N | ±10% of reading or 2 mg/L, (range dependent) whichever is greater |
| Ammonium/ammoniab | 0 to 200 mg/L-N | 0.001 to 1 mg/L-N | ±10% of reading or 2 mg/L, nitrogen (range dependent) whichever is greater |
| Chlorideb | 0 to 1000 mg/L | 0.001 to 1 mg/L | ±15% of reading or 5 mg/L, (range dependent) whichever is greater |
| Turbiditya | 0 to 1,000 NTU | 0.1 NTU | ±2% of reading or 0.3 NTU, whichever is greater in YSI AMCO-AEPA Polymer Standards |
| Rhodamine WTa | 0-200 µg/L | 0.1 µg/L | ±5% of reading or ±1 µg/L, whichever is greater |
| Chlorophylla | |||
| Range | Resolution | Linearity | |
| 0 to 400 µg/L chl a | 0.1 µg/L chl a | R2 > 0.9999 for serial dilution of Rhodamine | |
| 0 to 100 RFU | 0.1% FS; 0.1 RFU | WT solution from 0 to 500 µg/L | |
| Blue-green algaea,e phycocyanin | Range | Resolution | Linearity |
| 0-280,000 cells/mL | 220 cells/mL | R2 = 0.9999 for serial dilution of Rhodamine WT from 0 to 400 µg/L | |
| Blue-green algaea,e phycoerythrin | |||
| 0-200,000 cells/mL | 450 cells/mL | R2 = 0.9999 for serial dilution of Rhodamine WT from 0 to 8 µg/L | |
| PAR | Range | Calibration | Stability |
| 400-700 nm waveband | ±5% | < ±2% change over 1 year | |
| Linearity | Sensitivity | ||
| Max. deviation of 1% | Typically 3µA per 1000 mmol s-1 m-2 in water | ||
| a Depth rating for optical probes is 61 m (200 ft); depth rating for anti-fouling optical probes with copper-alloy probe housing is 200 m (656 ft). |
| b Freshwater only. Maximum depth rating of 15.2 m (50 ft). |
| c Report outputs of specific conductance (conductivity correct to 25° C), resistivity, and total dissolved solids are also provided. These values are automatically calculated from conductivity according to algorithms found in Standard Methods for the Examination of Water and Wastewater (ed 1989). |
| d To maintain accuracy specification, flow must be at least 500 mL/min and pH should not change by more than ±0.3 units if mean pH is between 8.5 and 9.3. |
| e Specification determined using monocultures of Isochrysis sp. and fluorometric extraction of chlorophyll a. Actual detection limits will vary depending on natural algae assemblage. |
| f Estimated from cultures of Microcystis aeruginosa. |
| g Estimated from cultures of Synechococcus sp. |
For further information, please see the manufacturer's manual and data sheet.
SEPA Short-term Mooring Instrumentation
The SEPA monitoring project has obtained hydrographic data across various long and short term moorings through the deployment of a YSI 6600 multi-parameter-sonde.
SEPA's first short-term mooring occured at Campbeltown between 2010 and 2011 to assess water quality impacts on Campbeltown Loch from an industrial discharge. However, only a small dataset was recovered as the buoy broke loose during a storm. The sonde was attached to a fixed mooring buoy at the surface of the water column.
A second short-term mooring was located in Loch Sunart as part of a water quality investigation in 2012. Again, the sonde was attached to a fixed mooring buoy at the surface.
An additional short-term project took place in the Carron Estuary in 2014 with a site both upstream and downstream as part of an investigation into dissolved oxygen. At the upstream site the sonde was attached to a fixed mooring buoy at the surface of the water column and at the downstream site the sonde was attached to a floating fender.
BODC processing of SEPA's short-term monitoring buoys
Data Acquisition and Transfer
The data were sent by SEPA as a .csv file and following BODC's procedures the files were checked for consistency and subsequently archived.
The data were reformatted to QXF format using BODC's established procedures. During the transfer process the file was split into cruise-to-cruise series events. The table below shows how the originator's parameters were mapped to BODC parameters and their units:
| Originator's Parameter | Originator's Units | Description | BODC Parameter Code | BODC Units | Description | Comments |
|---|---|---|---|---|---|---|
| Temp | deg C | - | TEMPPR01 | °C | The degree of hotness of the water column expressed against a standard scale. Includes both IPTS-68 and ITS-90 scales. | |
| pH | pH Units | - | PHXXZZXX | pH Units | Minus the log of the hydrogen ion concentration (moles per litre) in the water column. | |
| Salin | ppt | - | ODSDM021 | ppt | Salinity of the water body | |
| DO% | % Sat | - | OXYSZZ01 | % | Saturation of oxygen in the water body, computed (algorithm/data source unspecified) | For legacy data Oxygen saturation is not derived by BODC but taken from the data supplied. |
| DO | mg/l | - | DOXYZZ01 | µmol/l | Unspecified type of oxygen sensor with no information on whether it has been calibrated against sample data | Conversion of * 31.252 was applied during transfer |
| Turb | NTU | - | TURBXXXX | NTU | Estimate of suspended sediment concentration based on the proportion of a light transmission in the water column that is reflected back to a co-located receiver. | |
| Chl | µg/l | - | CPHLZZXX | mg/m3 | The mass of all variants of chlorophyll-a per unit volume of the water column held in particles of any size. Includes measurements made by instruments unable to resolve chlorophyll-a types and the sum of HPLC chlorophyll-a types. |
The standard unit conversion factor of * 31.252 was applied to oxygen concentration during transfer to obtain the BODC units of µmol/l.
The pH channel has not been transferred in the data from the Loch Sunart mooring as the channel is null.
All channels from the Carron Estuary and Campbeltown monitoring buoy sites were transferred.
Data Quality and Screening
Post transfer analysis and crosschecks were applied according to BODC procedures. This involved the screening of data to check flags were appropriately applied whilst also applying further quality control flags where appropriate.
During the originator's data quality checks, suspect data were replaced with one of the following flags: 'No sensor', 'Quality Control failure', 'Quality Control Spike Removed', 'Quality Control Spike removed, wiper incorrectly parking over sensor', 'Quality control data removed due to heavy biofouling of instrument' and 'Power Failure'. These values were all flagged as 'Null' by BODC as no data were available when these flags were applied.
SEPA originator's processing document for Loch Sunart short-term monitoring buoy
Data Acquisition and Analysis
Data were obtained from a YSI probe attached to a mooring deployed in Loch Sunart. The mooring was serviced and deployed by the Scottish Environment Protection Agency (SEPA) as part of a study into the water quality of the area. Data were submitted in GMT format.
Quality and Screening
Once downloaded the data went through SEPA data quality checks with suspect data removed and replaced with the relevant flags to inform future users of the reason for any missing data.
Submission
The data were then submitted to BODC through ftp as a .csv file.
Project Information
No Project Information held for the Series
Data Activity or Cruise Information
Cruise
| Cruise Name | LochSunart20120214 |
| Departure Date | 2012-02-14 |
| Arrival Date | 2012-02-14 |
| Principal Scientist(s) | Matthew V Blackburn (Scottish Environment Protection Agency, Edinburgh) |
| Ship | Sir John Murray |
Complete Cruise Metadata Report is available here
Fixed Station Information
Fixed Station Information
| Station Name | SEPA_LochSunart |
| Category | Coastal location |
| Latitude | 56° 42.23' N |
| Longitude | 5° 46.32' W |
| Water depth below MSL | 35.0 m |
SEPA Loch Sunart Fixed Station Mooring
| Location Name | Loch Sunart |
|---|---|
| Nominal Latitude (+ve N) | 56.703752 |
| Nominal Longitude (+ve E) | -5.771942 |
| Water depth | 35 m |
| Period of data collection | 14 Feb 2012 - 23 Oct 2012 |
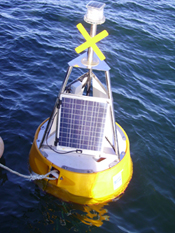
The buoy is located in Loch Sunart and provides measurements of dissolved oxygen, salinity, temperature, chlorophyll and turbidity. Maintenance takes place initially after three months and then on an approximately monthly basis using one of SEPA's support vessels.
For the first ten weeks of the data, samples are collected every 30 minutes after which the sampling period changes to every 15 minutes.
The water depth has been estimated at 35 metres by the originator.
Related Fixed Station activities are detailed in Appendix 1
BODC Quality Control Flags
The following single character qualifying flags may be associated with one or more individual parameters with a data cycle:
| Flag | Description |
|---|---|
| Blank | Unqualified |
| < | Below detection limit |
| > | In excess of quoted value |
| A | Taxonomic flag for affinis (aff.) |
| B | Beginning of CTD Down/Up Cast |
| C | Taxonomic flag for confer (cf.) |
| D | Thermometric depth |
| E | End of CTD Down/Up Cast |
| G | Non-taxonomic biological characteristic uncertainty |
| H | Extrapolated value |
| I | Taxonomic flag for single species (sp.) |
| K | Improbable value - unknown quality control source |
| L | Improbable value - originator's quality control |
| M | Improbable value - BODC quality control |
| N | Null value |
| O | Improbable value - user quality control |
| P | Trace/calm |
| Q | Indeterminate |
| R | Replacement value |
| S | Estimated value |
| T | Interpolated value |
| U | Uncalibrated |
| W | Control value |
| X | Excessive difference |
SeaDataNet Quality Control Flags
The following single character qualifying flags may be associated with one or more individual parameters with a data cycle:
| Flag | Description |
|---|---|
| 0 | no quality control |
| 1 | good value |
| 2 | probably good value |
| 3 | probably bad value |
| 4 | bad value |
| 5 | changed value |
| 6 | value below detection |
| 7 | value in excess |
| 8 | interpolated value |
| 9 | missing value |
| A | value phenomenon uncertain |
| B | nominal value |
| Q | value below limit of quantification |
Appendix 1: SEPA_LochSunart
Related series for this Fixed Station are presented in the table below. Further information can be found by following the appropriate links.
If you are interested in these series, please be aware we offer a multiple file download service. Should your credentials be insufficient for automatic download, the service also offers a referral to our Enquiries Officer who may be able to negotiate access.
| Series Identifier | Data Category | Start date/time | Start position | Cruise |
|---|---|---|---|---|
| 1764010 | Hydrography time series at depth | 2012-04-27 13:30:00 | 56.70375 N, 5.77194 W | Unknown self-propelled small boat LochSunart20120427 |
| 1764022 | Hydrography time series at depth | 2012-05-17 13:15:00 | 56.70375 N, 5.77194 W | Unknown self-propelled small boat LochSunart20120517 |
| 1764034 | Hydrography time series at depth | 2012-06-10 13:15:00 | 56.70375 N, 5.77194 W | Unknown self-propelled small boat LochSunart20120610 |
| 1764046 | Hydrography time series at depth | 2012-07-10 13:00:00 | 56.70375 N, 5.77194 W | Unknown self-propelled small boat LochSunart20120710 |
| 1764058 | Hydrography time series at depth | 2012-08-14 13:15:00 | 56.70375 N, 5.77194 W | Unknown self-propelled small boat LochSunart20120814 |
| 1764071 | Hydrography time series at depth | 2012-09-19 13:16:00 | 56.70375 N, 5.77194 W | Unknown self-propelled small boat LochSunart20120919 |
