Metadata Report for BODC Series Reference Number 1766723
Metadata Summary
Problem Reports
Data Access Policy
Narrative Documents
Project Information
Data Activity or Cruise Information
Fixed Station Information
BODC Quality Flags
SeaDataNet Quality Flags
Metadata Summary
Data Description |
|||||||||||||||||||||||||||||||||
|
|||||||||||||||||||||||||||||||||
Data Identifiers |
|||||||||||||||||||||||||||||||||
|
|||||||||||||||||||||||||||||||||
Time Co-ordinates(UT) |
|||||||||||||||||||||||||||||||||
|
|||||||||||||||||||||||||||||||||
Spatial Co-ordinates | |||||||||||||||||||||||||||||||||
|
|||||||||||||||||||||||||||||||||
Parameters |
|||||||||||||||||||||||||||||||||
|
|||||||||||||||||||||||||||||||||
|
|||||||||||||||||||||||||||||||||
Problem Reports
No Problem Report Found in the Database
OSMOSIS Cruise D381A and D381B moored MicroCAT CTDs: Quality Report
During BODC quality control procedures, BODC have applied additional 'M' flags where the data values for temperature, conductivity and salinity were significantly noisy at the beginning and end of the data collection period.
It should be noted that BODC has taken a high level approach and therefore further quality control has been left to the discretion of the end user.
OSMOSIS Cruise D381A and D381B moored MicroCAT CTDs: Quality Report - Knockdown
From examination of the periods when the recorded pressure is significantly greater than the nominal depth of the moored instrument, BODC consider that for the following approximate time periods, data quality is significantly affected by knockdown of moorings:
- Beginning of the mooring deployment to September 2012.
- 14 November 2013 to 3 December 2013 (only for NE outer mooring).
- 11 January 2013 to 21 January 2013
- 27 January 2013 to 31 January 2013.
- 8 February 2013 to 20 February 2013.
- 5 March 2013 to 7 March 2013.
- 22 March 2013 to 23 March 2013.
- 19 April 2013 to 25 April 2013.
- 3 May 2013 to 8 May 2013.
- 20 May 2013 to 9 June 2013.
- August 2013 to the end of mooring deployment.
All parameters have been flagged as suspect during these periods. Additional flagging has been applied to all parameter where there are significant and obvious spikes in the pressure channel. The above time periods should be used as a guide, there are slight variations between mooring sites.
Data Access Policy
Open Data
These data have no specific confidentiality restrictions for users. However, users must acknowledge data sources as it is not ethical to publish data without proper attribution. Any publication or other output resulting from usage of the data should include an acknowledgment.
If the Information Provider does not provide a specific attribution statement, or if you are using Information from several Information Providers and multiple attributions are not practical in your product or application, you may consider using the following:
"Contains public sector information licensed under the Open Government Licence v1.0."
Narrative Documents
Sea-Bird SBE 37-SM MicroCAT
The SBE 37-SM MicroCAT is a high accuracy conductivity and temperature recorder (pressure optional). Designed for moorings and other long-duration, fixed-site deployments, MicroCATs have non-corroding titanium housings rated for operation to 7000 metres or pressure sensor full scale-range. Communication with the MicroCAT is over an internal, 3-wire, RS-232C link. The MicroCAT's aged and pressure-protected thermistor has a long history of exceptional accuracy and stability (typical drift is less than 0.002° per year). Electrical isolation of the conductivity electronics eliminates any possibility of ground-loop noise.
Specifications
| Temperature (°C) | Conductivity (S m-1) | Optional Pressure | |
|---|---|---|---|
| Measurement Range | -5 to +35 | 0 to 7 (0 to 70 mS cm-1) | 0 to full scale range: 20 / 100 / 350 / 1000 / 2000 / 3500 / 7000 metres |
| Initial accuracy | 0.002 | 0.0003 | 0.1% of full scale range |
| Typical Stability | 0.0002 per month | 0.0003 per month | 0.05% of full scale range per year |
| Resolution | 0.0001 | 0.00001 | 0.002% of full scale range |
| Sensor Calibration | +1 to +32 | 0 to 6; physical calibration over range 2.6 to 6 S m-1, plus zero conductivity (air) | Ambient pressure to full scale range in 5 steps |
| Memory | 8 Mbyte non-volatile FLASH memory | ||
| Data Storage | Converted temperature and conductivity: 6 bytes per sample (3 bytes each) Time: 4 bytes per sample Pressure (optional): 5 bytes per sample | ||
| Real-Time Clock | 32,768 Hz TCXO accurate to ±1 minutes year-1 | ||
| Standard Internal Batteries | Nominal 10.6 Ampere-hour pack consisting of 12 AA lithium batteries. Provides sufficient capacity for more than 630,000 samples for a typical sampling scheme | ||
| Housing | Titanium pressure case rated at 7000 metres | ||
| Weight (without pressure) | In water: 2.3 kg In air: 3.8 kg | ||
Further information can be found via the following link: SBE 37-SM MicroCAT Datasheet
OSMOSIS Cruise D381A and D381B Moored MicroCAT CTDs: Originator's Data Processing
The originator has supplied short-term MicroCAT CTD data for outer mooring sites (NW, NE, SW, SE), inner mooring sites (NW, NE, SW, SE) and a central mooring site as part of the Ocean Surface Mixing, Ocean Sub mesoscale Interaction Study (OSMOSIS) consortium project.
The short-term moorings were deployed on the RRS Discovery Cruise D381A and D381B in 2012 and were recovered a year later on the RRS James Cook Cruise JC090.
Originator's Data Processing
The originator has applied the following processing steps to each MicroCAT CTD file.
- Converted original .xml binary files to .cnv files
- Read into Matlab and formatted into Matlab structures
- Data sorted by depth and plots created to assess data quality
- Quality control flags were applied to parameters where applicable and the overall file
- Data collected during deployment and recovery activities, as ascertained from the pressure readings, were removed
Data quality issues were observed by the originator, which have been outlined below for future user awareness.
- NE inner mooring, serial no. 9381 - data unavailable.
- Centre mooring, serial no. 9398 - offset observed and possible drift in pressure sensor readings. Pressure readings poor after 2013-07-25 21:33:07. The data has been retained and flagged accordingly.
- Centre mooring, serial no. 9399 - observed poor salinity readings and poor temperature readings as shown by lagged temperature responses during post-experiment recovery.
- NE outer mooring, serial no. 7298 - poor salinity readings, the data have been retained and flagged accordingly.
- NE outer mooring, serial no. 7299 - poor salinity readings, the data have been retained and flagged accordingly.
- NE outer mooring, serial no. 7302 - poor salinity readings, the data have been retained and flagged accordingly.
- NW outer mooring, serial no. 7293 - poor salinity readings, the data have been retained and flagged accordingly.
- NW outer mooring, serial no. 7294 - poor salinity readings, the data have been retained and flagged accordingly.
- NW outer mooring, serial no. 7296 - data unavailable.
- NW outer mooring, serial no. 7297 - poor salinity readings, the data have been retained and flagged accordingly.
- SE inner mooring, serial no. 7315 - bias observed in salinity readings, adjustments made by subtracting off a constant (-0.0068 psu) value.
- SE inner mooring, serial no. 9389 - poor salinity readings, the data have been retained and flagged accordingly.
- SE outer mooring, serial no. 7305 - poor salinity readings, the data have been retained and flagged accordingly.
- SE outer mooring, serial no. 7306 - poor salinity readings, the data have been retained and flagged accordingly.
- SE outer mooring, serial no. 7309 - poor salinity readings, the data have been retained and flagged accordingly.
- SW inner mooring, serial no. 9372 - observed poor pressure readings, therefore data was interpolated from pressure readings from SW inner mooring serial no. 8080 Aquadopp. Exact distances between sensors are unknown, it is recommended for the user to take caution using data.
- SW inner mooring, serial no. 9374 - bias observed in salinity readings, adjustments made by subtracting off a constant (0.0408 psu) value. Pressure readings altered using post-experiment recovery calibration curve.
- SW inner mooring, serial no. 9375 - poor salinity readings, the data have been retained and flagged accordingly.
- SW inner mooring, serial no. 7310 - poor salinity readings, the data have been retained and flagged accordingly.
- SW outer mooring, serial no. 7288 - poor salinity readings, the data have been retained and flagged accordingly.
- SW outer mooring, serial no. 7289 - poor salinity readings, the data have been retained and flagged accordingly.
Field Calibrations
CTD casts were deployed on the mooring deployments to provide reference points for calibration of moored time series measurements. Calibration curves do not exist for the mooring recoveries, as no CTD casts were deployed.
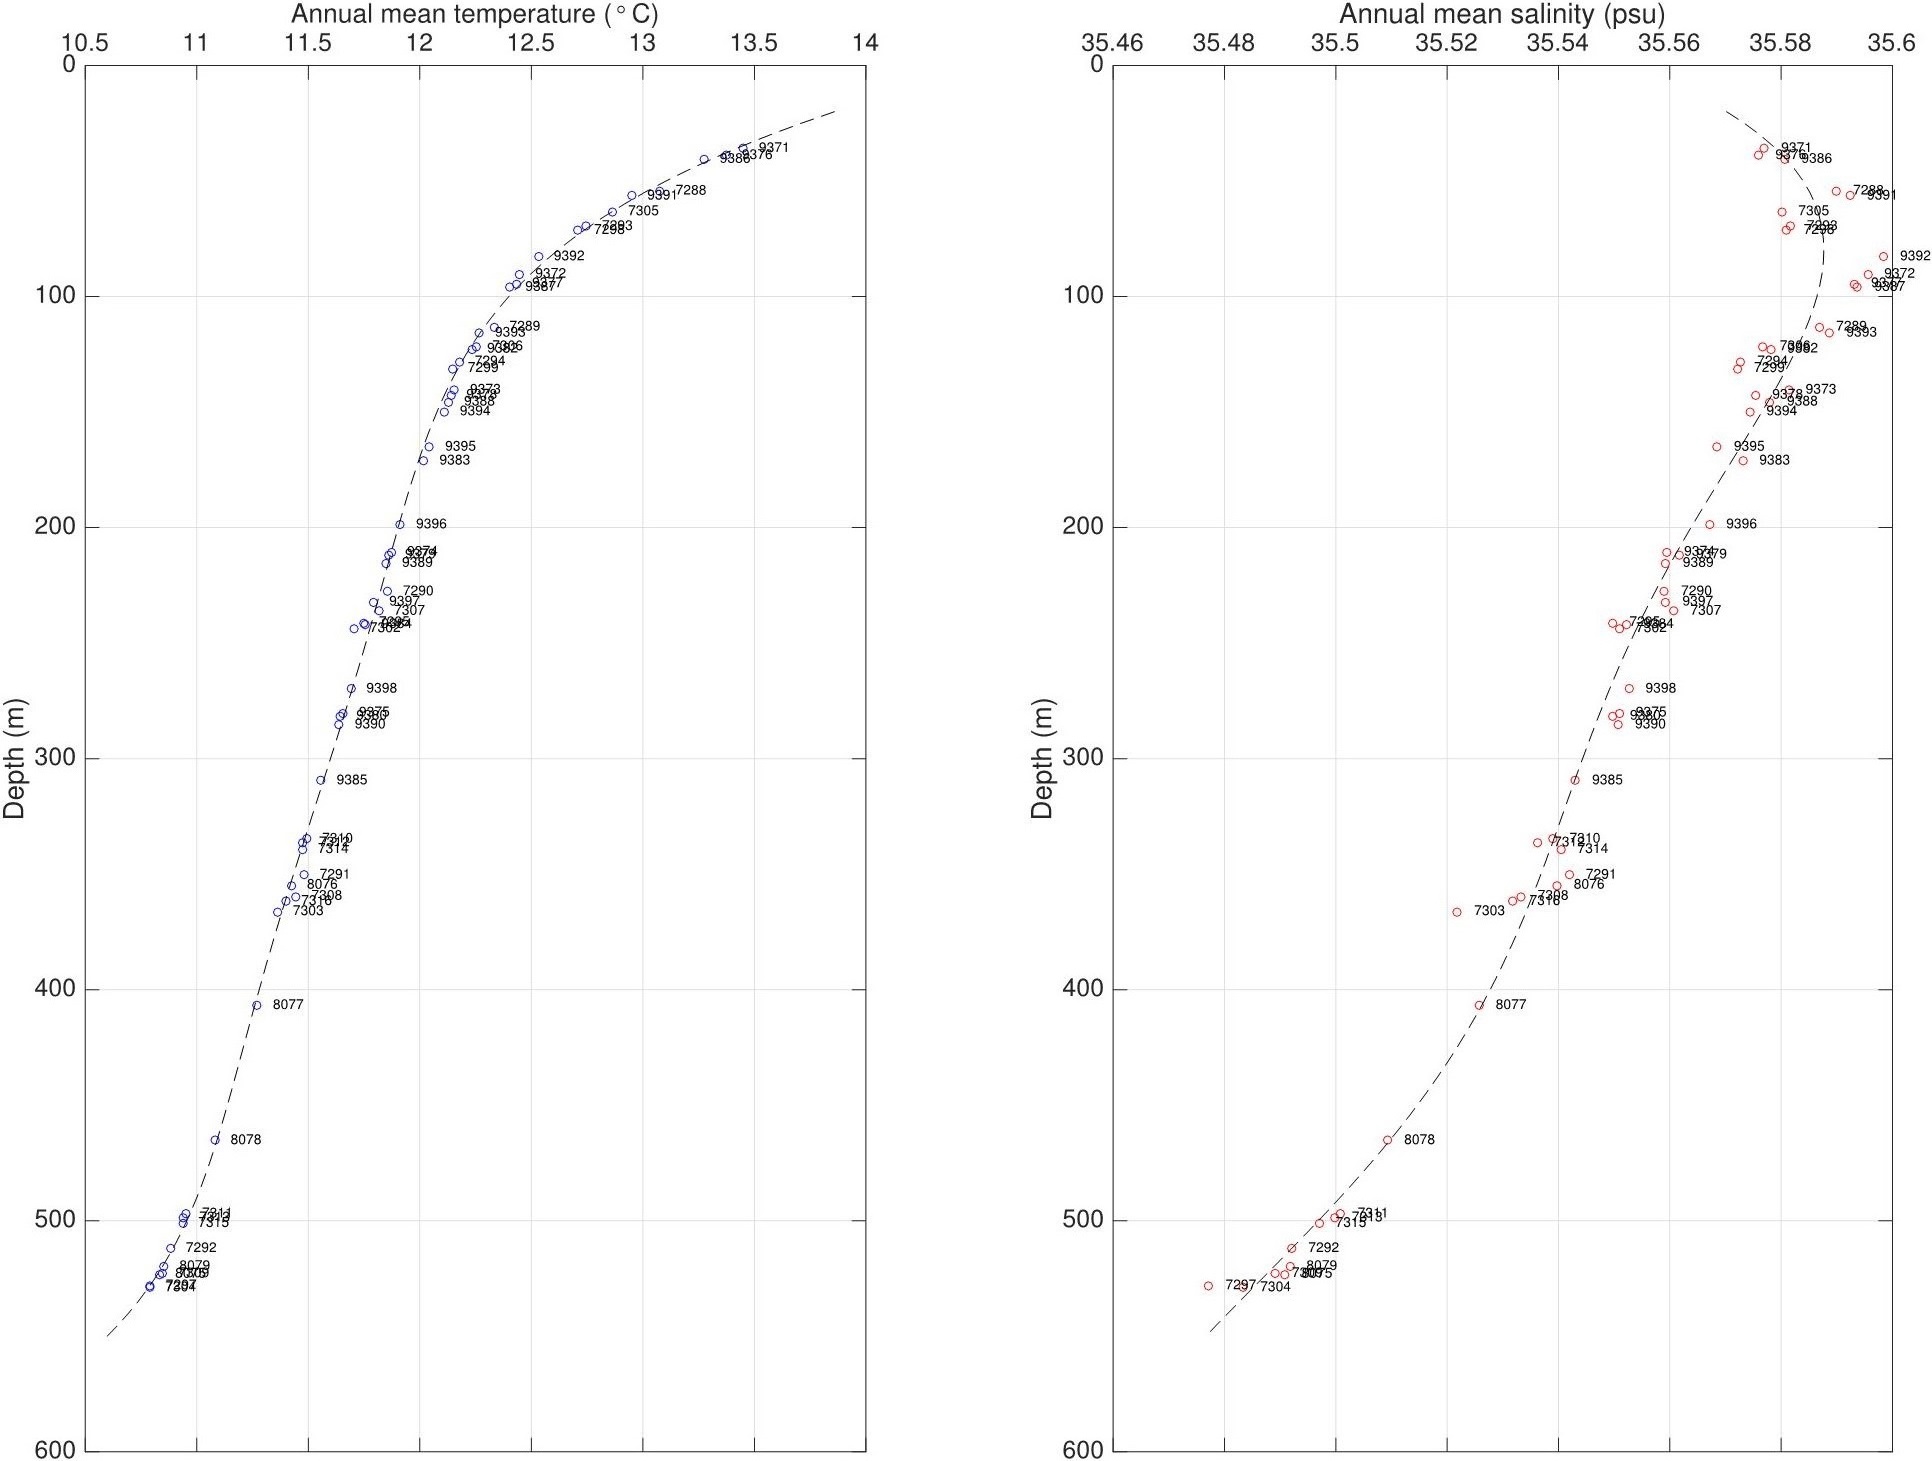
Figure 1. Annual mean temperature and salinity for each MicroCAT sensor; depths correspond to the annual mean depths of each sensor. Salinity sensors are biased (or drift) relative to their true value owing to a lack of a calibration curve at the end of deployment.
OSMOSIS Cruise D381A and D381B moored MicroCAT CTDs: Processing by BODC
Data from 59 MicroCAT sensors were submitted to BODC as Matlab files, one file for each sensor. The table below describes the originators variables and how they were mapped to appropriate BODC parameter codes for standardisation purposes.
| Originator's variables | Originator's units | Description | BODC code | BODC units | Comments |
| Temperature | °C | Temperature of the water body | TEMPPR01 | °C | Applies to all MicroCAT files supplied. Originator modified raw data to correct for temperature biases. |
| Pressure | db | Pressure (measured variable) exerted by the water body by semi-fixed moored SBE MicroCAT | PREXMCAT | db | Applies to all MicroCAT files supplied. Originator modified raw data for SW inner mooring serial no. 9372 pressure data which was interpolated from SW inner mooring serial no. 8080 ADCP data. |
| Conductivity | uS/cm | Electrical conductivity of the water body by in-situ conductivity cell | CNDCPR01 | s/m | Applied unit conversion */0.0001 to all MicroCAT files supplied. Originator modified raw data to correct for salinity biases. |
| Salinity | dimensionless | Practical salinity of the water body by conductivity cell and computation using UNESCO 1983 algorithm | PSALPR01 | dimensionless | Applies to all MicroCAT files supplied. Originator modified raw data to correct for salinity biases. Salinity not present for centre mooring serial no.9399. |
The data were visualised in internal built software EDSERPLO. Suspect data were flagged according. Missing data values were set to appropriate values and flagged. All data files were modified by the originator, to remove data points collected during the deployment and recovery of instrumentation.
Project Information
Ocean Surface Mixing, Ocean Sub-mesoscale Interaction Study (OSMOSIS)
Background
The Ocean Surface Mixing, Ocean Sub-mesoscale Interaction Study (OSMOSIS) consortium was funded to deliver NERC's Ocean Surface Boundary Layer (OSBL) programme. Commencing in 2011, this multiple year study will combine traditional observational techniques, such as moorings and CTDs, with the latest autonomous sampling technologies (including ocean gliders), capable of delivering near real-time scientific measurements through the water column.
The OSMOSIS consortium aims to improve understanding of the OSBL, the interface between the atmosphere and the deeper ocean. This layer of the water column is thought to play a pivotal role in global climate and the productivity of our oceans.
OSMOSIS involves collaborations between scientists at various universities (Reading, Oxford, Bangor, Southampton and East Anglia) together with researchers at the National Oceanography Centre (NOC), Scottish Association for Marine Science (SAMS) and Plymouth Marine Laboratory (PML). In addition, there are a number of project partners linked to the consortium.
Scientific Objectives
- The primary goal of the fieldwork component of OSMOSIS is to obtain a year-long time series of the properties of the OSBL and its controlling 3D physical processes. This is achieved with an array of moorings (two nested clusters of 4 moorings, each centred around a central mooring) and gliders deployed near the Porcupine Abyssal Plain (PAP) observatory. Data obtained from this campaign will help with the understanding of these processes and subsequent development of associated parameterisations.
- OSMOSIS will attempt to create parameterisations for the processes which determine the evolving stratification and potential vorticity budgets of the OSBL.
- The overall legacy of OSMOSIS will be to develop new (physically based and observationally supported) parameterisations of processes that deepen and shoal the OSBL, and to implement and evaluate these parameterisations in a state-of-the-art global coupled climate model, facilitating improved weather and climate predictions.
Fieldwork
Three cruises are directly associated with the OSMOSIS consortium. Preliminary exploratory work in the Clyde Sea (September 2011) to hone techniques and strategies, followed by a mooring deployment and recovery cruise in the vicinity of the Porcupine Abyssal Plain (PAP) observatory (in late Summer 2012 and 2013 respectively). Additional opportunist ship time being factored in to support the ambitious glider operations associated with OSMOSIS.
Instrumentation
Types of instrumentation and measurements associated with the OSMOSIS observational campaign:
- Ocean gliders
- Wave rider buoys
- Towed SeaSoar surveys
- Microshear measurements
- Moored current meters, conductivity-temperature sensors and ADCPs
- Traditional shipboard measurements (including CTD, underway, discrete nutrients, LADCP, ADCP).
Contacts
| Collaborator | Organisation |
|---|---|
| Prof. Stephen Belcher | University of Reading, U.K |
| Dr. Alberto C Naveira Garabato | University of Southampton, U.K |
Data Activity or Cruise Information
Data Activity
| Start Date (yyyy-mm-dd) | 2012-09-01 |
| End Date (yyyy-mm-dd) | 2013-09-08 |
| Organization Undertaking Activity | University of Southampton School of Ocean and Earth Science |
| Country of Organization | United Kingdom |
| Originator's Data Activity Identifier | OSMOSIS SW inner |
| Platform Category | subsurface mooring |
OSMOSIS south-west inner mooring
The short term moorings were deployed and recovered during cruise RRS Discovery D381A as part of the Ocean Surface Mixing, Ocean Submesoscale Interaction Study (OSMOSIS) project.
The target for the south-west mooring was 48° 40.740' N, 16° 12.360' W in approximately 4,830 m of water. The mooring consisted of 50 Star-Oddi thermistors, one upward pointing 75 kHz ADCP, seven Nortek single-point current meters and seven SBE 37 MicroCAT sensors. In addition, a light and Argo tag were fixed at the top of the mooring.
Instruments deployed on the mooring
| Instrument and equipment | Instrument serial number | Depth relative to surface |
|---|---|---|
| Thermistor | T4185 | 33 |
| Light | W03-095 | 36 |
| ARGO tag | A02-017 | 36 |
| Thermistor | T4186 | 47 |
| Nortek CM | 8059 | 53 |
| Thermistor | T4192 | 54 |
| SBE 37 MicroCAT | 9371 | 54 |
| Thermistor | T4193 | 59 |
| Thermistor | T4194 | 64 |
| Thermistor | T4195 | 69 |
| Thermistor | T4196 | 74 |
| Thermistor | T4197 | 79 |
| Thermistor | T4198 | 84 |
| Thermistor | T4199 | 89 |
| Thermistor | T4200 | 94 |
| Thermistor | T4201 | 99 |
| Nortek CM | 8080 | 110 |
| Thermistor | T4202 | 110 |
| SBE 37 MicroCAT | 9372 | 110 |
| Thermistor | T4203 | 115 |
| Thermistor | T4204 | 120 |
| Thermistor | T4205 | 125 |
| Thermistor | T4206 | 130 |
| Thermistor | T4207 | 135 |
| Thermistor | T4208 | 140 |
| Thermistor | T4209 | 145 |
| Thermistor | T4210 | 150 |
| Nortek CM | 8088 | 159 |
| SBE 37 MicroCAT | 9373 | 160 |
| Thermistor | T4211 | 162 |
| Thermistor | T4212 | 171 |
| Thermistor | T4213 | 180 |
| Thermistor | T4214 | 189 |
| Thermistor | T4343 | 198 |
| Thermistor | T4344 | 207 |
| Thermistor | T4345 | 216 |
| Nortek CM | 8093 | 228 |
| Thermistor | T4346 | 228 |
| SBE 37 MicroCAT | 9374 | 229 |
| Thermistor | T4347 | 234 |
| Thermistor | T4348 | 244 |
| Thermistor | T4349 | 254 |
| Thermistor | T4350 | 264 |
| Thermistor | T4351 | 274 |
| Thermistor | T4352 | 284 |
| Thermistor | T4353 | 293 |
| Nortek CM | 8097 | 298 |
| SBE 37 MicroCAT | 9375 | 299 |
| Thermistor | T4354 | 305 |
| Thermistor | T4355 | 319 |
| Thermistor | T4356 | 334 |
| Thermistor | T4357 | 348 |
| Nortek CM | 8111 | 352 |
| SBE 37 MicroCAT | 7310 | 353 |
| Thermistor | T4359 | 363 |
| Thermistor | T4360 | 378 |
| Thermistor | T4361 | 393 |
| Thermistor | T4362 | 408 |
| Thermistor | T4363 | 423 |
| Thermistor | T4364 | 438 |
| 75 kHz ADCP | LR10583 | 452 |
| Thermistor | T4365 | 453 |
| Thermistor | T4366 | 465 |
| Thermistor | T4367 | 480 |
| Thermistor | T4368 | 495 |
| Nortek CM | 8351 | 513 |
| SBE 37 MicroCAT | 7311 | 514 |
| Release | 1134/1491 | 4816 |
Related Data Activity activities are detailed in Appendix 1
Cruise
| Cruise Name | D381A |
| Departure Date | 2012-08-28 |
| Arrival Date | 2012-09-13 |
| Principal Scientist(s) | Alberto C Naveira Garabato (University of Southampton School of Ocean and Earth Science) |
| Ship | RRS Discovery |
Complete Cruise Metadata Report is available here
Fixed Station Information
No Fixed Station Information held for the Series
BODC Quality Control Flags
The following single character qualifying flags may be associated with one or more individual parameters with a data cycle:
| Flag | Description |
|---|---|
| Blank | Unqualified |
| < | Below detection limit |
| > | In excess of quoted value |
| A | Taxonomic flag for affinis (aff.) |
| B | Beginning of CTD Down/Up Cast |
| C | Taxonomic flag for confer (cf.) |
| D | Thermometric depth |
| E | End of CTD Down/Up Cast |
| G | Non-taxonomic biological characteristic uncertainty |
| H | Extrapolated value |
| I | Taxonomic flag for single species (sp.) |
| K | Improbable value - unknown quality control source |
| L | Improbable value - originator's quality control |
| M | Improbable value - BODC quality control |
| N | Null value |
| O | Improbable value - user quality control |
| P | Trace/calm |
| Q | Indeterminate |
| R | Replacement value |
| S | Estimated value |
| T | Interpolated value |
| U | Uncalibrated |
| W | Control value |
| X | Excessive difference |
SeaDataNet Quality Control Flags
The following single character qualifying flags may be associated with one or more individual parameters with a data cycle:
| Flag | Description |
|---|---|
| 0 | no quality control |
| 1 | good value |
| 2 | probably good value |
| 3 | probably bad value |
| 4 | bad value |
| 5 | changed value |
| 6 | value below detection |
| 7 | value in excess |
| 8 | interpolated value |
| 9 | missing value |
| A | value phenomenon uncertain |
| B | nominal value |
| Q | value below limit of quantification |
Appendix 1: OSMOSIS SW inner
Related series for this Data Activity are presented in the table below. Further information can be found by following the appropriate links.
If you are interested in these series, please be aware we offer a multiple file download service. Should your credentials be insufficient for automatic download, the service also offers a referral to our Enquiries Officer who may be able to negotiate access.
| Series Identifier | Data Category | Start date/time | Start position | Cruise |
|---|---|---|---|---|
| 1743146 | Currents -subsurface Eulerian | 2012-09-01 20:00:00 | 48.678 N, 16.205 W | RRS Discovery D381A |
| 1743158 | Currents -subsurface Eulerian | 2012-09-01 20:00:00 | 48.678 N, 16.205 W | RRS Discovery D381A |
| 1743171 | Currents -subsurface Eulerian | 2012-09-01 20:00:00 | 48.678 N, 16.205 W | RRS Discovery D381A |
| 1743183 | Currents -subsurface Eulerian | 2012-09-01 20:00:00 | 48.678 N, 16.205 W | RRS Discovery D381A |
| 1743195 | Currents -subsurface Eulerian | 2012-09-01 20:00:00 | 48.678 N, 16.205 W | RRS Discovery D381A |
| 1743202 | Currents -subsurface Eulerian | 2012-09-01 20:00:00 | 48.678 N, 16.205 W | RRS Discovery D381A |
| 1743214 | Currents -subsurface Eulerian | 2012-09-01 20:00:00 | 48.678 N, 16.205 W | RRS Discovery D381A |
| 1800737 | Hydrography time series at depth | 2012-09-01 20:00:00 | 48.678 N, 16.205 W | RRS Discovery D381A |
| 1800749 | Hydrography time series at depth | 2012-09-01 20:00:00 | 48.678 N, 16.205 W | RRS Discovery D381A |
| 1800750 | Hydrography time series at depth | 2012-09-01 20:00:00 | 48.678 N, 16.205 W | RRS Discovery D381A |
| 1800762 | Hydrography time series at depth | 2012-09-01 20:00:00 | 48.678 N, 16.205 W | RRS Discovery D381A |
| 1800774 | Hydrography time series at depth | 2012-09-01 20:00:00 | 48.678 N, 16.205 W | RRS Discovery D381A |
| 1800786 | Hydrography time series at depth | 2012-09-01 20:00:00 | 48.678 N, 16.205 W | RRS Discovery D381A |
| 1800798 | Hydrography time series at depth | 2012-09-01 20:00:00 | 48.678 N, 16.205 W | RRS Discovery D381A |
| 1800805 | Hydrography time series at depth | 2012-09-01 20:00:00 | 48.678 N, 16.205 W | RRS Discovery D381A |
| 1800817 | Hydrography time series at depth | 2012-09-01 20:00:00 | 48.678 N, 16.205 W | RRS Discovery D381A |
| 1800829 | Hydrography time series at depth | 2012-09-01 20:00:00 | 48.678 N, 16.205 W | RRS Discovery D381A |
| 1800830 | Hydrography time series at depth | 2012-09-01 20:00:00 | 48.678 N, 16.205 W | RRS Discovery D381A |
| 1800842 | Hydrography time series at depth | 2012-09-01 20:00:00 | 48.678 N, 16.205 W | RRS Discovery D381A |
| 1800854 | Hydrography time series at depth | 2012-09-01 20:00:00 | 48.678 N, 16.205 W | RRS Discovery D381A |
| 1800866 | Hydrography time series at depth | 2012-09-01 20:00:00 | 48.678 N, 16.205 W | RRS Discovery D381A |
| 1800878 | Hydrography time series at depth | 2012-09-01 20:00:00 | 48.678 N, 16.205 W | RRS Discovery D381A |
| 1800891 | Hydrography time series at depth | 2012-09-01 20:00:00 | 48.678 N, 16.205 W | RRS Discovery D381A |
| 1800909 | Hydrography time series at depth | 2012-09-01 20:00:00 | 48.678 N, 16.205 W | RRS Discovery D381A |
| 1800910 | Hydrography time series at depth | 2012-09-01 20:00:00 | 48.678 N, 16.205 W | RRS Discovery D381A |
| 1800922 | Hydrography time series at depth | 2012-09-01 20:00:00 | 48.678 N, 16.205 W | RRS Discovery D381A |
| 1800934 | Hydrography time series at depth | 2012-09-01 20:00:00 | 48.678 N, 16.205 W | RRS Discovery D381A |
| 1800946 | Hydrography time series at depth | 2012-09-01 20:00:00 | 48.678 N, 16.205 W | RRS Discovery D381A |
| 1800958 | Hydrography time series at depth | 2012-09-01 20:00:00 | 48.678 N, 16.205 W | RRS Discovery D381A |
| 1800971 | Hydrography time series at depth | 2012-09-01 20:00:00 | 48.678 N, 16.205 W | RRS Discovery D381A |
| 1800983 | Hydrography time series at depth | 2012-09-01 20:00:00 | 48.678 N, 16.205 W | RRS Discovery D381A |
| 1800995 | Hydrography time series at depth | 2012-09-01 20:00:00 | 48.678 N, 16.205 W | RRS Discovery D381A |
| 1801009 | Hydrography time series at depth | 2012-09-01 20:00:00 | 48.678 N, 16.205 W | RRS Discovery D381A |
| 1801010 | Hydrography time series at depth | 2012-09-01 20:00:00 | 48.678 N, 16.205 W | RRS Discovery D381A |
| 1801022 | Hydrography time series at depth | 2012-09-01 20:00:00 | 48.678 N, 16.205 W | RRS Discovery D381A |
| 1801034 | Hydrography time series at depth | 2012-09-01 20:00:00 | 48.678 N, 16.205 W | RRS Discovery D381A |
| 1801046 | Hydrography time series at depth | 2012-09-01 20:00:00 | 48.678 N, 16.205 W | RRS Discovery D381A |
| 1801058 | Hydrography time series at depth | 2012-09-01 20:00:00 | 48.678 N, 16.205 W | RRS Discovery D381A |
| 1801071 | Hydrography time series at depth | 2012-09-01 20:00:00 | 48.678 N, 16.205 W | RRS Discovery D381A |
| 1801083 | Hydrography time series at depth | 2012-09-01 20:00:00 | 48.678 N, 16.205 W | RRS Discovery D381A |
| 1801095 | Hydrography time series at depth | 2012-09-01 20:00:00 | 48.678 N, 16.205 W | RRS Discovery D381A |
| 1801102 | Hydrography time series at depth | 2012-09-01 20:00:00 | 48.678 N, 16.205 W | RRS Discovery D381A |
| 1801114 | Hydrography time series at depth | 2012-09-01 20:00:00 | 48.678 N, 16.205 W | RRS Discovery D381A |
| 1801126 | Hydrography time series at depth | 2012-09-01 20:00:00 | 48.678 N, 16.205 W | RRS Discovery D381A |
| 1801138 | Hydrography time series at depth | 2012-09-01 20:00:00 | 48.678 N, 16.205 W | RRS Discovery D381A |
| 1801151 | Hydrography time series at depth | 2012-09-01 20:00:00 | 48.678 N, 16.205 W | RRS Discovery D381A |
| 1801163 | Hydrography time series at depth | 2012-09-01 20:00:00 | 48.678 N, 16.205 W | RRS Discovery D381A |
| 1801175 | Hydrography time series at depth | 2012-09-01 20:00:00 | 48.678 N, 16.205 W | RRS Discovery D381A |
| 1801187 | Hydrography time series at depth | 2012-09-01 20:00:00 | 48.678 N, 16.205 W | RRS Discovery D381A |
| 1801199 | Hydrography time series at depth | 2012-09-01 20:00:00 | 48.678 N, 16.205 W | RRS Discovery D381A |
| 1801206 | Hydrography time series at depth | 2012-09-01 20:00:00 | 48.678 N, 16.205 W | RRS Discovery D381A |
| 1801218 | Hydrography time series at depth | 2012-09-01 20:00:00 | 48.678 N, 16.205 W | RRS Discovery D381A |
| 1801231 | Hydrography time series at depth | 2012-09-01 20:00:00 | 48.678 N, 16.205 W | RRS Discovery D381A |
| 1801243 | Hydrography time series at depth | 2012-09-01 20:00:00 | 48.678 N, 16.205 W | RRS Discovery D381A |
| 1801255 | Hydrography time series at depth | 2012-09-01 20:00:00 | 48.678 N, 16.205 W | RRS Discovery D381A |
| 1766735 | Hydrography time series at depth | 2012-09-01 20:00:01 | 48.678 N, 16.205 W | RRS Discovery D381A |
| 1766747 | Hydrography time series at depth | 2012-09-01 20:00:01 | 48.678 N, 16.205 W | RRS Discovery D381A |
| 1766759 | Hydrography time series at depth | 2012-09-01 20:00:01 | 48.678 N, 16.205 W | RRS Discovery D381A |
| 1766760 | Hydrography time series at depth | 2012-09-01 20:00:01 | 48.678 N, 16.205 W | RRS Discovery D381A |
| 1766772 | Hydrography time series at depth | 2012-09-01 20:00:01 | 48.678 N, 16.205 W | RRS Discovery D381A |
| 1766784 | Hydrography time series at depth | 2012-09-01 20:00:01 | 48.678 N, 16.205 W | RRS Discovery D381A |
