Metadata Report for BODC Series Reference Number 1798590
Metadata Summary
Problem Reports
Data Access Policy
Narrative Documents
Project Information
Data Activity or Cruise Information
Fixed Station Information
BODC Quality Flags
SeaDataNet Quality Flags
Metadata Summary
Data Description |
|||||||||||||||||||||||||
|
|||||||||||||||||||||||||
Data Identifiers |
|||||||||||||||||||||||||
|
|||||||||||||||||||||||||
Time Co-ordinates(UT) |
|||||||||||||||||||||||||
|
|||||||||||||||||||||||||
Spatial Co-ordinates | |||||||||||||||||||||||||
|
|||||||||||||||||||||||||
Parameters |
|||||||||||||||||||||||||
|
|||||||||||||||||||||||||
|
|||||||||||||||||||||||||
Problem Reports
No Problem Report Found in the Database
OSMOSIS Cruise D381A moored Star-Oddi Thermistors: Quality Report
Data quality issues were observed by the originator, which have been outlined below for future user awareness.
The temperature data collected here are much poorer than those from the MicroCATs.
The following sensors were judged to have poor data and recorded as such in the JC090 log:
s/n 4186 - lost
s/n 4263 - flooded
s/n 4236 - unable to connect
s/n 3114 - unable to connect
s/n 4204 - very short data record
The originator has placed thermistor T4218 within the NW-Inner mooring but was unable to cross-reference its location using either the deployment or recovery cruise reports. It should be noted that the temperature appears to be affected significantly by surface warming (very warm in September 2012 and September 2013) so it is likely near the top. The originator has placed suspect quality flags on the pressure channel for this reason which are flagged 'L' in the file.
The originator has applied poor quality flags to the pressure channel on the South West mooring on the following serial numbers due to pressure data from the nearest MicroCAT being poor and so replaced with that from the neighboring Nortek Aquadopp (SW Inner, 8080):
s/n 4199
s/n 4200
s/n 4201
s/n 4202
s/n 4203
s/n 4205
s/n 4206
During BODC quality control procedures, BODC have applied additional 'M' flags where the data values for temperature were significantly noisy at the beginning and end of the data collection period.
It should be noted that BODC has taken a high level approach and therefore further quality control has been left to the discretion of the end user.
Data Access Policy
Open Data
These data have no specific confidentiality restrictions for users. However, users must acknowledge data sources as it is not ethical to publish data without proper attribution. Any publication or other output resulting from usage of the data should include an acknowledgment.
If the Information Provider does not provide a specific attribution statement, or if you are using Information from several Information Providers and multiple attributions are not practical in your product or application, you may consider using the following:
"Contains public sector information licensed under the Open Government Licence v1.0."
Narrative Documents
Sea-Bird SBE 37-SM MicroCAT
The SBE 37-SM MicroCAT is a high accuracy conductivity and temperature recorder (pressure optional). Designed for moorings and other long-duration, fixed-site deployments, MicroCATs have non-corroding titanium housings rated for operation to 7000 metres or pressure sensor full scale-range. Communication with the MicroCAT is over an internal, 3-wire, RS-232C link. The MicroCAT's aged and pressure-protected thermistor has a long history of exceptional accuracy and stability (typical drift is less than 0.002° per year). Electrical isolation of the conductivity electronics eliminates any possibility of ground-loop noise.
Specifications
| Temperature (°C) | Conductivity (S m-1) | Optional Pressure | |
|---|---|---|---|
| Measurement Range | -5 to +35 | 0 to 7 (0 to 70 mS cm-1) | 0 to full scale range: 20 / 100 / 350 / 1000 / 2000 / 3500 / 7000 metres |
| Initial accuracy | 0.002 | 0.0003 | 0.1% of full scale range |
| Typical Stability | 0.0002 per month | 0.0003 per month | 0.05% of full scale range per year |
| Resolution | 0.0001 | 0.00001 | 0.002% of full scale range |
| Sensor Calibration | +1 to +32 | 0 to 6; physical calibration over range 2.6 to 6 S m-1, plus zero conductivity (air) | Ambient pressure to full scale range in 5 steps |
| Memory | 8 Mbyte non-volatile FLASH memory | ||
| Data Storage | Converted temperature and conductivity: 6 bytes per sample (3 bytes each) Time: 4 bytes per sample Pressure (optional): 5 bytes per sample | ||
| Real-Time Clock | 32,768 Hz TCXO accurate to ±1 minutes year-1 | ||
| Standard Internal Batteries | Nominal 10.6 Ampere-hour pack consisting of 12 AA lithium batteries. Provides sufficient capacity for more than 630,000 samples for a typical sampling scheme | ||
| Housing | Titanium pressure case rated at 7000 metres | ||
| Weight (without pressure) | In water: 2.3 kg In air: 3.8 kg | ||
Further information can be found via the following link: SBE 37-SM MicroCAT Datasheet
Star-Oddi Starmon mini Temperature Recorder
Description
The Star-Oddi Starmon mini is a compact microprocessor-controlled temperature recorder with electronics and probe housed in a strong waterproof cylinder made of either plastic or titanium.
Specifications
| Memory | 350000 measurements, although memory size can optionally be increased to 524000 or 699000 measurements. Temperature readings are stored in non-volatile Electrically Erasable Programmable Read Only Memory (EEPROM). |
|---|---|
| Data Retention | 20 years. |
| Temperature Range | -2 °C to +40 °C with outside ranges available at request. The average resolution is 0.013 °C, and the measuring accuracy is +/-0.05 °C. |
| Maximum Depth | Plastic version: 400 m (40 bar), titanium version: 11000 m (1100 bar) |
| Communication Link | Downloaded via PC interface box. Connects to a computer via a RS-232C standard serial interface. |
| Battery | A 3.6 V lithium battery with a life of 5 years for a sampling interval of 10 minutes or greater. |
For more information please see the manufacturers specification sheet.
OSMOSIS Cruise D381A moored Star-Oddi Thermistors: Originator's Data Processing
The originator has supplied Star-Oddi temperature logger data from inner mooring sites (NW, NE, SW, SE) and a central mooring site as part of the Ocean Surface Mixing, Ocean Sub mesoscale Interaction Study (OSMOSIS) consortium project.
The moorings were deployed on the RRS Discovery Cruise D381A in 2012 and were recovered a year later on the RRS James Cook Cruise JC090.
Originator's Data Processing
Temperature measurements were collected as part of the OSMOSIS experiment in the eastern North Atlantic. These data were obtained on a suite of five (5) moorings during September 2012-September 2013 and, therefore, contain mooring motion. They have been modified from their original measurements in order to correct for temperature biases. Wild-point editing were also applied to the noisy data. The originator has noted that pressure was not recorded on these data but was inferred from "known" positions on the mooring with respect to CTD locations (see Allen et al. 2013 D381 cruise report). Thus, these depths may be incorrect. Also, that for an unknown reasons, there does not seem to be a CTD cast coincident with MicroCAT measurements during the recovery period. Thus, no calibration curve exists. The original data can be obtained upon request.
Data have been cropped to the times during which the moorings were placed in the water (September 2012) and recovered (September 2013). This was ascertained from the pressure sensor on each instrument.
The originator has applied the following processing steps to each Star-Oddi Starmon file.
Read from .DAT file
Read into matlab and placed into large structure
Sorted depths
Looped over plots to assess data quality; made notes as appropriate (described below)
The originator took the additional following steps due to noise within these data to ensure data were of fair quality:
1. Determine the "quality" of each sensor's data (quality_check1.m)
* loop over each thermistor record and plot each data record visually
* manually assign a quality flag to the data (1 good, 2 potentially bad or 3 bad)
* in this pass, a quality flag (i.e., quality_flag) of 3 was given to data having spikes (or wild points)
2. Eliminate spikes or wild points within those records whose quality_flag = 3 (wild_point_editor.m)
* wild points are defined as those data points whose value exceeds a difference from the local mean of 7.1 times the local standard deviation.
* the kernel used to define the local mean and local standard dev is a 1-day (721-pixel) window centred on each data point
* wild points are replaced with the median value of data within the same window
* we retain the original data in the field "temperature"
* the (filtered) record is placed within a variable called "temperature_modified";
* the quality_flag is set to 2
Some records which pass this automated step are of poor quality. This is because the local standard deviation is large due to the outliers themselves. A subsequent step ensures data within the "temperature_modified" field is of superb quality.
3. Determine the "quality" of each sensor's data (quality_check2.m)
In this step, we correct those records which were not corrected in the preceding step.
* loop over each thermistor record and plot data visually
* we examine the "temperature_modified" field rather than the "temperature" field
* we correct those records whose quality_flag = 2 in the following manner:
a) if quality_flag = 2, we look at the time-series plot
(i) if it looks ok, we do not do anything but set the quality_flag = 1
(ii) if it does not look ok (for example, due to spikes), we run a subroutine called "use_with_quality_check2.m" and graphically define the data of interest using a plot of the mean temperature record vs the observed temperature record. The objective in this "expert-based" classifier algorithm is to separate the dense "cloud" of data points from the outliers. As this is a subjective process, the user of data within the "temperature_modified" variable should use caution. We made the following decision with regard to the "quality_flag" when processing the data in this manner:
* if the edges/borders of the dense cloud of data are clearly defined, we modify the "temperature_modified" time series and set quality_flag = 1.
* if the edges/borders of the dense cloud of data are not clearly defined, we modify the "temperature_modified" time series and set quality_flag = 2.
In this manner, the value of "quality_flag" represents the quality of the "temperature_modified" field rather than the "temperature" field. The user can distinguish between good original data and good modified data by noting that good original data does not have an associated "temperature_modified" record (i.e., it is an empty vector).
b) if quality_flag = 1 or quality_flag = 3, we do not modify the data
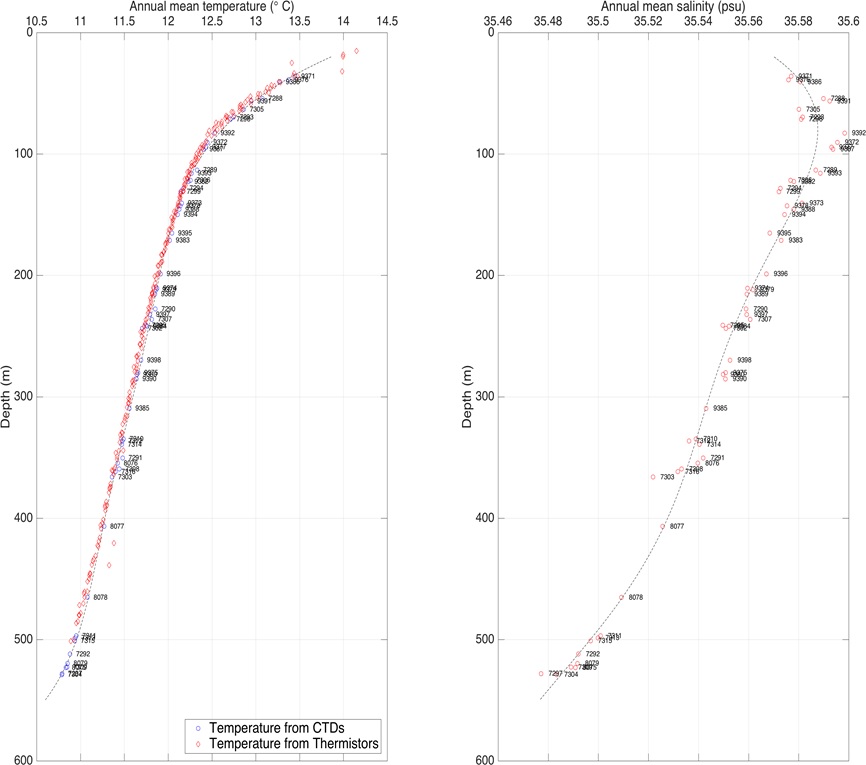
Figure 1. Annual average of thermistor temperatures (red, triangle) and microCAT CTD temperatures (blue, circles) and salinity (red, circles); depths correspond to the annual mean depths of each sensor over the year.
While temperature shows a very nice (canonical) shape with depth, salinity shows some scatter relative to a fifth-order polynomial fit. Thermistor temperature is slightly colder than CTD temperatures for the same depth. This suggests incorrect but consistent spacing between thermistors and MicroCAT CTDs.
OSMOSIS Cruise D381A moored Star-Oddi Thermistors: Processing by BODC
Data from 243 Star-Oddi thermistors were submitted to BODC as Matlab files, one file for each sensor. The table below describes the originators variables and how they were mapped to appropriate BODC parameter codes for standardisation purposes.
| Originator's variables | Originator's units | Description | BODC code | BODC units | Comments |
| Temperature | °C | Temperature of the water body | TEMPPR01 | °C | |
| Temperature_modified | °C | Temperature of the water body | TEMPPR01 | °C | Present in some files that required extra quality control steps. |
| Pressure | db | Pressure (measured variable) exerted by the water body by semi-fixed moored SBE MicroCAT and interpolation between instruments with pressure sensors | PREXSINT | db | Pressure was not recorded on these data but was inferred from "known" positions on the mooring with respect to MicroCAT locations |
Please note if only the temperature variable was populated in the file this was taken through, but if both temperature and temperature_modified variables were populated only the quality controlled temperature_modified variable was taken through. The basis of how this was determined is described in the originator's processing notes. The original files are available on request.
The data were visualised in internal built software EDSERPLO. Suspect data were flagged according. Missing data values were set to appropriate values and flagged. All data files were modified by the originator, to remove data points collected during the deployment and recovery of instrumentation.
Project Information
Ocean Surface Mixing, Ocean Sub-mesoscale Interaction Study (OSMOSIS)
Background
The Ocean Surface Mixing, Ocean Sub-mesoscale Interaction Study (OSMOSIS) consortium was funded to deliver NERC's Ocean Surface Boundary Layer (OSBL) programme. Commencing in 2011, this multiple year study will combine traditional observational techniques, such as moorings and CTDs, with the latest autonomous sampling technologies (including ocean gliders), capable of delivering near real-time scientific measurements through the water column.
The OSMOSIS consortium aims to improve understanding of the OSBL, the interface between the atmosphere and the deeper ocean. This layer of the water column is thought to play a pivotal role in global climate and the productivity of our oceans.
OSMOSIS involves collaborations between scientists at various universities (Reading, Oxford, Bangor, Southampton and East Anglia) together with researchers at the National Oceanography Centre (NOC), Scottish Association for Marine Science (SAMS) and Plymouth Marine Laboratory (PML). In addition, there are a number of project partners linked to the consortium.
Scientific Objectives
- The primary goal of the fieldwork component of OSMOSIS is to obtain a year-long time series of the properties of the OSBL and its controlling 3D physical processes. This is achieved with an array of moorings (two nested clusters of 4 moorings, each centred around a central mooring) and gliders deployed near the Porcupine Abyssal Plain (PAP) observatory. Data obtained from this campaign will help with the understanding of these processes and subsequent development of associated parameterisations.
- OSMOSIS will attempt to create parameterisations for the processes which determine the evolving stratification and potential vorticity budgets of the OSBL.
- The overall legacy of OSMOSIS will be to develop new (physically based and observationally supported) parameterisations of processes that deepen and shoal the OSBL, and to implement and evaluate these parameterisations in a state-of-the-art global coupled climate model, facilitating improved weather and climate predictions.
Fieldwork
Three cruises are directly associated with the OSMOSIS consortium. Preliminary exploratory work in the Clyde Sea (September 2011) to hone techniques and strategies, followed by a mooring deployment and recovery cruise in the vicinity of the Porcupine Abyssal Plain (PAP) observatory (in late Summer 2012 and 2013 respectively). Additional opportunist ship time being factored in to support the ambitious glider operations associated with OSMOSIS.
Instrumentation
Types of instrumentation and measurements associated with the OSMOSIS observational campaign:
- Ocean gliders
- Wave rider buoys
- Towed SeaSoar surveys
- Microshear measurements
- Moored current meters, conductivity-temperature sensors and ADCPs
- Traditional shipboard measurements (including CTD, underway, discrete nutrients, LADCP, ADCP).
Contacts
| Collaborator | Organisation |
|---|---|
| Prof. Stephen Belcher | University of Reading, U.K |
| Dr. Alberto C Naveira Garabato | University of Southampton, U.K |
Data Activity or Cruise Information
Data Activity
| Start Date (yyyy-mm-dd) | 2012-09-03 |
| End Date (yyyy-mm-dd) | 2013-09-06 |
| Organization Undertaking Activity | University of Southampton School of Ocean and Earth Science |
| Country of Organization | United Kingdom |
| Originator's Data Activity Identifier | OSMOSIS central |
| Platform Category | subsurface mooring |
OSMOSIS centre mooring
The short term moorings were deployed and recovered during cruise RRS Discovery D381A as part of the Ocean Surface Mixing, Ocean Submesoscale Interaction Study (OSMOSIS) project.
The target for the centre mooring was 48° 41.340' N, 16° 11.400' W in approximately 4,830 m of water. The mooring consisted of 48 Star-Oddi thermistors, one upward pointing 75 kHz ADCP, four 600 kHz ADCPs, thirteen Nortek single-point current meters and thirteen SBE 37 MicroCAT sensors. In addition, a light and Argo tag were fixed at the top of the mooring.
Instruments deployed on the mooring
| Instrument and equipment | Instrument serial number | Depth relative to surface |
|---|---|---|
| Thermistor | T2607 | 33 |
| Light | W10-030 | 35 |
| ARGO tag | A02-021 | 35 |
| Thermistor | T2608 | 47 |
| 600 kHz ADCP | WHS2390 | 48 |
| Thermistor | T2618 | 50 |
| Nortek CM | 9956 | 53 |
| SBE 37 MicroCAT | 9391 | 54 |
| Thermistor | T2620 | 57 |
| Thermistor | T2622 | 62 |
| Thermistor | T2624 | 67 |
| Thermistor | T2846 | 72 |
| 600 kHz ADCP | WHS7301 | 76 |
| Thermistor | T2850 | 77 |
| Nortek CM | 9957 | 79 |
| SBE 37 MicroCAT | 9392 | 79 |
| Thermistor | T3114 | 84 |
| Thermistor | T3725 | 89 |
| Thermistor | T3727 | 94 |
| Thermistor | T3728 | 99 |
| Thermistor | T3729 | 104 |
| Thermistor | T3730 | 112 |
| Nortek CM | 9960 | 113 |
| SBE 37 MicroCAT | 9393 | 113 |
| Thermistor | T3731 | 118 |
| Thermistor | T3732 | 123 |
| Thermistor | T4294 | 128 |
| Thermistor | T4295 | 133 |
| Thermistor | T4296 | 138 |
| Thermistor | T4297 | 145 |
| Nortek CM | 9962 | 146 |
| SBE 37 MicroCAT | 9394 | 146 |
| Thermistor | T4298 | 151 |
| Thermistor | T4299 | 156 |
| 600 kHz ADCP | WHS5807 | 158 |
| Nortek CM | 9966 | 161 |
| SBE 37 MicroCAT | 9395 | 162 |
| Thermistor | T4300 | 170 |
| Thermistor | T4301 | 178 |
| Thermistor | T4302 | 186 |
| Thermistor | T4303 | 195 |
| Nortek CM | 9968 | 195 |
| SBE 37 MicroCAT | 9396 | 195 |
| Thermistor | T4461 | 203 |
| Thermistor | T4462 | 211 |
| Thermistor | T4463 | 219 |
| Thermistor | T4464 | 228 |
| Nortek CM | 9969 | 229 |
| SBE 37 MicroCAT | 9397 | 229 |
| Thermistor | T4465 | 239 |
| Thermistor | T4466 | 249 |
| Nortek CM | 9972 | 261 |
| SBE 37 MicroCAT | 9398 | 262 |
| Thermistor | T4468 | 272 |
| Thermistor | T4469 | 282 |
| 600 kHz ADCP | WHS3725 | 294 |
| Thermistor | T4470 | 295 |
| Nortek CM | 9975 | 297 |
| SBE 37 MicroCAT | 9399 | 297 |
| Thermistor | T4471 | 303 |
| Thermistor | T4472 | 317 |
| Thermistor | T4473 | 332 |
| Thermistor | T4474 | 346 |
| Nortek CM | 9976 | 350 |
| SBE 37 MicroCAT | 8076 | 351 |
| Thermistor | T4475 | 357 |
| Thermistor | T4476 | 371 |
| Thermistor | T4477 | 386 |
| Nortek CM | 9979 | 402 |
| SBE 37 MicroCAT | 8077 | 402 |
| Thermistor | T4479 | 418 |
| Thermistor | T4480 | 434 |
| Thermistor | T4481 | 448 |
| 75 kHz ADCP | LR5575 | 454 |
| Nortek CM | 9986 | 458 |
| SBE 37 MicroCAT | 8078 | 459 |
| Thermistor | T44482 | 464 |
| Thermistor | T4483 | 479 |
| Thermistor | T4484 | 494 |
| Nortek CM | 9989 | 512 |
| SBE 37 MicroCAT | 8079 | 512 |
| Release | 1137/1493 | 4816 |
Related Data Activity activities are detailed in Appendix 1
Cruise
| Cruise Name | D381A |
| Departure Date | 2012-08-28 |
| Arrival Date | 2012-09-13 |
| Principal Scientist(s) | Alberto C Naveira Garabato (University of Southampton School of Ocean and Earth Science) |
| Ship | RRS Discovery |
Complete Cruise Metadata Report is available here
Fixed Station Information
No Fixed Station Information held for the Series
BODC Quality Control Flags
The following single character qualifying flags may be associated with one or more individual parameters with a data cycle:
| Flag | Description |
|---|---|
| Blank | Unqualified |
| < | Below detection limit |
| > | In excess of quoted value |
| A | Taxonomic flag for affinis (aff.) |
| B | Beginning of CTD Down/Up Cast |
| C | Taxonomic flag for confer (cf.) |
| D | Thermometric depth |
| E | End of CTD Down/Up Cast |
| G | Non-taxonomic biological characteristic uncertainty |
| H | Extrapolated value |
| I | Taxonomic flag for single species (sp.) |
| K | Improbable value - unknown quality control source |
| L | Improbable value - originator's quality control |
| M | Improbable value - BODC quality control |
| N | Null value |
| O | Improbable value - user quality control |
| P | Trace/calm |
| Q | Indeterminate |
| R | Replacement value |
| S | Estimated value |
| T | Interpolated value |
| U | Uncalibrated |
| W | Control value |
| X | Excessive difference |
SeaDataNet Quality Control Flags
The following single character qualifying flags may be associated with one or more individual parameters with a data cycle:
| Flag | Description |
|---|---|
| 0 | no quality control |
| 1 | good value |
| 2 | probably good value |
| 3 | probably bad value |
| 4 | bad value |
| 5 | changed value |
| 6 | value below detection |
| 7 | value in excess |
| 8 | interpolated value |
| 9 | missing value |
| A | value phenomenon uncertain |
| B | nominal value |
| Q | value below limit of quantification |
Appendix 1: OSMOSIS central
Related series for this Data Activity are presented in the table below. Further information can be found by following the appropriate links.
If you are interested in these series, please be aware we offer a multiple file download service. Should your credentials be insufficient for automatic download, the service also offers a referral to our Enquiries Officer who may be able to negotiate access.
| Series Identifier | Data Category | Start date/time | Start position | Cruise |
|---|---|---|---|---|
| 1742628 | Currents -subsurface Eulerian | 2012-09-03 18:30:00 | 48.6875 N, 16.1875 W | RRS Discovery D381A |
| 1742641 | Currents -subsurface Eulerian | 2012-09-03 18:30:00 | 48.6875 N, 16.1875 W | RRS Discovery D381A |
| 1742653 | Currents -subsurface Eulerian | 2012-09-03 18:30:00 | 48.6875 N, 16.1875 W | RRS Discovery D381A |
| 1742665 | Currents -subsurface Eulerian | 2012-09-03 18:30:00 | 48.6875 N, 16.1875 W | RRS Discovery D381A |
| 1742677 | Currents -subsurface Eulerian | 2012-09-03 18:30:00 | 48.6875 N, 16.1875 W | RRS Discovery D381A |
| 1742689 | Currents -subsurface Eulerian | 2012-09-03 18:30:00 | 48.6875 N, 16.1875 W | RRS Discovery D381A |
| 1742690 | Currents -subsurface Eulerian | 2012-09-03 18:30:00 | 48.6875 N, 16.1875 W | RRS Discovery D381A |
| 1742708 | Currents -subsurface Eulerian | 2012-09-03 18:30:00 | 48.6875 N, 16.1875 W | RRS Discovery D381A |
| 1742721 | Currents -subsurface Eulerian | 2012-09-03 18:30:00 | 48.6875 N, 16.1875 W | RRS Discovery D381A |
| 1742733 | Currents -subsurface Eulerian | 2012-09-03 18:30:00 | 48.6875 N, 16.1875 W | RRS Discovery D381A |
| 1742745 | Currents -subsurface Eulerian | 2012-09-03 18:30:00 | 48.6875 N, 16.1875 W | RRS Discovery D381A |
| 1742757 | Currents -subsurface Eulerian | 2012-09-03 18:30:00 | 48.6875 N, 16.1875 W | RRS Discovery D381A |
| 1742769 | Currents -subsurface Eulerian | 2012-09-03 18:30:00 | 48.6875 N, 16.1875 W | RRS Discovery D381A |
| 1798608 | Hydrography time series at depth | 2012-09-03 18:30:00 | 48.6875 N, 16.1875 W | RRS Discovery D381A |
| 1798621 | Hydrography time series at depth | 2012-09-03 18:30:00 | 48.6875 N, 16.1875 W | RRS Discovery D381A |
| 1798633 | Hydrography time series at depth | 2012-09-03 18:30:00 | 48.6875 N, 16.1875 W | RRS Discovery D381A |
| 1798645 | Hydrography time series at depth | 2012-09-03 18:30:00 | 48.6875 N, 16.1875 W | RRS Discovery D381A |
| 1798657 | Hydrography time series at depth | 2012-09-03 18:30:00 | 48.6875 N, 16.1875 W | RRS Discovery D381A |
| 1798669 | Hydrography time series at depth | 2012-09-03 18:30:00 | 48.6875 N, 16.1875 W | RRS Discovery D381A |
| 1798670 | Hydrography time series at depth | 2012-09-03 18:30:00 | 48.6875 N, 16.1875 W | RRS Discovery D381A |
| 1798682 | Hydrography time series at depth | 2012-09-03 18:30:00 | 48.6875 N, 16.1875 W | RRS Discovery D381A |
| 1798694 | Hydrography time series at depth | 2012-09-03 18:30:00 | 48.6875 N, 16.1875 W | RRS Discovery D381A |
| 1798701 | Hydrography time series at depth | 2012-09-03 18:30:00 | 48.6875 N, 16.1875 W | RRS Discovery D381A |
| 1798713 | Hydrography time series at depth | 2012-09-03 18:30:00 | 48.6875 N, 16.1875 W | RRS Discovery D381A |
| 1798725 | Hydrography time series at depth | 2012-09-03 18:30:00 | 48.6875 N, 16.1875 W | RRS Discovery D381A |
| 1798737 | Hydrography time series at depth | 2012-09-03 18:30:00 | 48.6875 N, 16.1875 W | RRS Discovery D381A |
| 1798749 | Hydrography time series at depth | 2012-09-03 18:30:00 | 48.6875 N, 16.1875 W | RRS Discovery D381A |
| 1798750 | Hydrography time series at depth | 2012-09-03 18:30:00 | 48.6875 N, 16.1875 W | RRS Discovery D381A |
| 1798762 | Hydrography time series at depth | 2012-09-03 18:30:00 | 48.6875 N, 16.1875 W | RRS Discovery D381A |
| 1798774 | Hydrography time series at depth | 2012-09-03 18:30:00 | 48.6875 N, 16.1875 W | RRS Discovery D381A |
| 1798786 | Hydrography time series at depth | 2012-09-03 18:30:00 | 48.6875 N, 16.1875 W | RRS Discovery D381A |
| 1798798 | Hydrography time series at depth | 2012-09-03 18:30:00 | 48.6875 N, 16.1875 W | RRS Discovery D381A |
| 1798805 | Hydrography time series at depth | 2012-09-03 18:30:00 | 48.6875 N, 16.1875 W | RRS Discovery D381A |
| 1798817 | Hydrography time series at depth | 2012-09-03 18:30:00 | 48.6875 N, 16.1875 W | RRS Discovery D381A |
| 1798829 | Hydrography time series at depth | 2012-09-03 18:30:00 | 48.6875 N, 16.1875 W | RRS Discovery D381A |
| 1798830 | Hydrography time series at depth | 2012-09-03 18:30:00 | 48.6875 N, 16.1875 W | RRS Discovery D381A |
| 1798842 | Hydrography time series at depth | 2012-09-03 18:30:00 | 48.6875 N, 16.1875 W | RRS Discovery D381A |
| 1798854 | Hydrography time series at depth | 2012-09-03 18:30:00 | 48.6875 N, 16.1875 W | RRS Discovery D381A |
| 1798866 | Hydrography time series at depth | 2012-09-03 18:30:00 | 48.6875 N, 16.1875 W | RRS Discovery D381A |
| 1798878 | Hydrography time series at depth | 2012-09-03 18:30:00 | 48.6875 N, 16.1875 W | RRS Discovery D381A |
| 1798891 | Hydrography time series at depth | 2012-09-03 18:30:00 | 48.6875 N, 16.1875 W | RRS Discovery D381A |
| 1798909 | Hydrography time series at depth | 2012-09-03 18:30:00 | 48.6875 N, 16.1875 W | RRS Discovery D381A |
| 1798910 | Hydrography time series at depth | 2012-09-03 18:30:00 | 48.6875 N, 16.1875 W | RRS Discovery D381A |
| 1798922 | Hydrography time series at depth | 2012-09-03 18:30:00 | 48.6875 N, 16.1875 W | RRS Discovery D381A |
| 1798934 | Hydrography time series at depth | 2012-09-03 18:30:00 | 48.6875 N, 16.1875 W | RRS Discovery D381A |
| 1798946 | Hydrography time series at depth | 2012-09-03 18:30:00 | 48.6875 N, 16.1875 W | RRS Discovery D381A |
| 1798958 | Hydrography time series at depth | 2012-09-03 18:30:00 | 48.6875 N, 16.1875 W | RRS Discovery D381A |
| 1798971 | Hydrography time series at depth | 2012-09-03 18:30:00 | 48.6875 N, 16.1875 W | RRS Discovery D381A |
| 1798983 | Hydrography time series at depth | 2012-09-03 18:30:00 | 48.6875 N, 16.1875 W | RRS Discovery D381A |
| 1798995 | Hydrography time series at depth | 2012-09-03 18:30:00 | 48.6875 N, 16.1875 W | RRS Discovery D381A |
| 1799009 | Hydrography time series at depth | 2012-09-03 18:30:00 | 48.6875 N, 16.1875 W | RRS Discovery D381A |
| 1799010 | Hydrography time series at depth | 2012-09-03 18:30:00 | 48.6875 N, 16.1875 W | RRS Discovery D381A |
| 1799022 | Hydrography time series at depth | 2012-09-03 18:30:00 | 48.6875 N, 16.1875 W | RRS Discovery D381A |
| 1799034 | Hydrography time series at depth | 2012-09-03 18:30:00 | 48.6875 N, 16.1875 W | RRS Discovery D381A |
| 1799046 | Hydrography time series at depth | 2012-09-03 18:30:00 | 48.6875 N, 16.1875 W | RRS Discovery D381A |
| 1799058 | Hydrography time series at depth | 2012-09-03 18:30:00 | 48.6875 N, 16.1875 W | RRS Discovery D381A |
| 1799071 | Hydrography time series at depth | 2012-09-03 18:30:00 | 48.6875 N, 16.1875 W | RRS Discovery D381A |
| 1799083 | Hydrography time series at depth | 2012-09-03 18:30:00 | 48.6875 N, 16.1875 W | RRS Discovery D381A |
| 1799095 | Hydrography time series at depth | 2012-09-03 18:30:00 | 48.6875 N, 16.1875 W | RRS Discovery D381A |
| 1766201 | Hydrography time series at depth | 2012-09-03 18:30:01 | 48.6875 N, 16.1875 W | RRS Discovery D381A |
| 1766213 | Hydrography time series at depth | 2012-09-03 18:30:01 | 48.6875 N, 16.1875 W | RRS Discovery D381A |
| 1766225 | Hydrography time series at depth | 2012-09-03 18:30:01 | 48.6875 N, 16.1875 W | RRS Discovery D381A |
| 1766237 | Hydrography time series at depth | 2012-09-03 18:30:01 | 48.6875 N, 16.1875 W | RRS Discovery D381A |
| 1766249 | Hydrography time series at depth | 2012-09-03 18:30:01 | 48.6875 N, 16.1875 W | RRS Discovery D381A |
| 1766250 | Hydrography time series at depth | 2012-09-03 18:30:01 | 48.6875 N, 16.1875 W | RRS Discovery D381A |
| 1766262 | Hydrography time series at depth | 2012-09-03 18:30:01 | 48.6875 N, 16.1875 W | RRS Discovery D381A |
| 1766274 | Hydrography time series at depth | 2012-09-03 18:30:01 | 48.6875 N, 16.1875 W | RRS Discovery D381A |
| 1766286 | Hydrography time series at depth | 2012-09-03 18:30:01 | 48.6875 N, 16.1875 W | RRS Discovery D381A |
| 1766298 | Hydrography time series at depth | 2012-09-03 18:30:01 | 48.6875 N, 16.1875 W | RRS Discovery D381A |
| 1766305 | Hydrography time series at depth | 2012-09-03 18:30:01 | 48.6875 N, 16.1875 W | RRS Discovery D381A |
| 1766317 | Hydrography time series at depth | 2012-09-03 18:30:01 | 48.6875 N, 16.1875 W | RRS Discovery D381A |
| 1766329 | Hydrography time series at depth | 2012-09-03 18:30:01 | 48.6875 N, 16.1875 W | RRS Discovery D381A |
