Metadata Report for BODC Series Reference Number 1801913
Metadata Summary
Problem Reports
Data Access Policy
Narrative Documents
Project Information
Data Activity or Cruise Information
Fixed Station Information
BODC Quality Flags
SeaDataNet Quality Flags
Metadata Summary
Data Description |
|||||||||||||||||||||||||||||||||||||||||||||||||||||||||||||
|
|||||||||||||||||||||||||||||||||||||||||||||||||||||||||||||
Data Identifiers |
|||||||||||||||||||||||||||||||||||||||||||||||||||||||||||||
|
|||||||||||||||||||||||||||||||||||||||||||||||||||||||||||||
Time Co-ordinates(UT) |
|||||||||||||||||||||||||||||||||||||||||||||||||||||||||||||
|
|||||||||||||||||||||||||||||||||||||||||||||||||||||||||||||
Spatial Co-ordinates | |||||||||||||||||||||||||||||||||||||||||||||||||||||||||||||
|
|||||||||||||||||||||||||||||||||||||||||||||||||||||||||||||
Parameters |
|||||||||||||||||||||||||||||||||||||||||||||||||||||||||||||
|
|||||||||||||||||||||||||||||||||||||||||||||||||||||||||||||
|
|||||||||||||||||||||||||||||||||||||||||||||||||||||||||||||
Problem Reports
No Problem Report Found in the Database
RRS James Cook cruise JC150 surface hydrography quality control report
General comments
It is not known what date/time the non-toxic, pumped seawater supply was turned on but from screening the sensors did not look realistic till 27th June 12:57. Therefore, data were flagged as suspect prior to this time (BODC assessment).
The non-toxic, pumped seawater supply was shutdown towards the end of the cruise on the 9th August at 09:30 and so data were flagged as suspect after this time.
All channels were flagged when the pump for the non-toxic supply was cleaned or inspected. The table below shows the dates and time when this occurred.
Flags were also added a few minutes after the non-toxic supply was turned on. (BODC assessment)
| Date | Stop time | Start time |
| 02/07/2017 | 16:10 | 16:40 |
| 09/07/2017 | 12:15 | 12:50 |
| 17/07/2017 | 14:50 | 15:30 |
| 24/07/2017 | 10:10 | 11:00 |
| 27/07/2017 | 14:00 | 14:50 |
| 28/07/2017 | 10:20 | 10:40 |
| 31/07/2017 | 09:50 | 10:45 |
Data Access Policy
Open Data
These data have no specific confidentiality restrictions for users. However, users must acknowledge data sources as it is not ethical to publish data without proper attribution. Any publication or other output resulting from usage of the data should include an acknowledgment.
If the Information Provider does not provide a specific attribution statement, or if you are using Information from several Information Providers and multiple attributions are not practical in your product or application, you may consider using the following:
"Contains public sector information licensed under the Open Government Licence v1.0."
Narrative Documents
SeaBird Digital Oceanographic Thermometer SBE38
The SBE38 is an ultra-stable thermistor that can be integrated as a remote temperature sensor with an SBE21 Thermosalinograph or an SBE 45 Micro TSG, or as a secondary temperature sensor with an SBE 16 plus, 16plus-IM, 16plus V2, 16plus-IM V2 or 19plus V2 SEACAT CTD.
Temperature is determined by applying an AC excitation to reference resistances and an ultra-stable aged thermistor. The reference resistor is a hermetically sealed VISHAY. AC excitation and ratiometric comparison using a common processing channel removes measurement errors due to parasitic thermocouples, offset voltages, leakage currents and gain errors.
The SBE38 can operate in polled sampling, where it takes one sample and transmits the data, or in continuous sampling.
Specifications
| Depth rating | up to 10500 m |
| Temperature range | -5 to 35°C |
| Initial accuracy | ± 0.001°C |
| Resolution | 0.00025°C |
| Stability | 0.001°C in 6 months |
| Response time | 500 ms |
| Self-heating error | < 200 µK |
Further details can be found in the manufacturer's specification sheet.
WET Labs WETStar Fluorometers
WET Labs WETStar fluorometers are miniature flow-through fluorometers, designed to measure relative concentrations of chlorophyll, CDOM, uranine, rhodamineWT dye, or phycoerythrin pigment in a sample of water. The sample is pumped through a quartz tube, and excited by a light source tuned to the fluorescence characteristics of the object substance. A photodiode detector measures the portion of the excitation energy that is emitted as fluorescence.
Specifications
By model:
| Chlorophyll WETStar | CDOM WETStar | Uranine WETStar | Rhodamine WETStar | Phycoerythrin WETStar | |
|---|---|---|---|---|---|
| Excitation wavelength | 460 nm | 370 nm | 485 nm | 470 nm | 525 nm |
| Emission wavelength | 695 nm | 460 nm | 530 nm | 590 nm | 575 nm |
| Sensitivity | 0.03 µg l-1 | 0.100 ppb QSD | 1 µg l-1 | - | - |
| Range | 0.03-75 µg l-1 | 0-100 ppb; 0-250 ppb | 0-4000 µg l-1 | - | - |
All models:
| Temperature range | 0-30°C |
|---|---|
| Depth rating | 600 m |
| Response time | 0.17 s analogue; 0.125 s digital |
| Output | 0-5 VDC analogue; 0-4095 counts digital |
Further details can be found in the manufacturer's specification sheet, and in the instrument manual.
WETLabs C-Star transmissometer
This instrument is designed to measure beam transmittance by submersion or with an optional flow tube for pumped applications. It can be used in profiles, moorings or as part of an underway system.
Two models are available, a 25 cm pathlength, which can be built in aluminum or co-polymer, and a 10 cm pathlength with a plastic housing. Both have an analog output, but a digital model is also available.
This instrument has been updated to provide a high resolution RS232 data output, while maintaining the same design and characteristics.
Specifications
| Pathlength | 10 or 25 cm |
| Wavelength | 370, 470, 530 or 660 nm |
| Bandwidth | ~ 20 nm for wavelengths of 470, 530 and 660 nm ~ 10 to 12 nm for a wavelength of 370 nm |
| Temperature error | 0.02 % full scale °C-1 |
| Temperature range | 0 to 30°C |
| Rated depth | 600 m (plastic housing) 6000 m (aluminum housing) |
Further details are available in the manufacturer's specification sheet or user guide.
RRS James Cook cruise JC150 surface hydrography instrumentation
Instrumentation
The sea surface hydrographical suite of sensors was fed by the pumped-seawater, non-toxic supply. The depth of the seawater intake was at 5.5 m.
The following surface hydrology sensors were fitted:
| Manufacturer | Model | Serial number | Last manufacturer's calibration date | Comments |
| WETLabs Fluorimeter | WETStar | WS3S-246 | 12/12/2016 | |
| WETLabs Transmissometer | C-Star | CST-114PR | 19/12/2016 | 25 cm pathlength |
| Sea-Bird Temperature sensor | SBE38 | 3854115-0487 | 15/02/2017 | |
| Sea-Bird | SBE45 TSG | 4548881-0232 | 13/10/2015 |
SeaBird MicroTSG Thermosalinograph SBE 45
The SBE45 MicroTSG is an externally powered instrument designed for shipboard measurement of temperature and conductivity of pumped near-surface water samples. The instrument can also compute salinity and sound velocity internally.
The MicroTSG comprises a platinum-electrode glass conductivity cell and a stable, pressure-protected thermistor temperature sensor. It also contains an RS-232 port for appending the output of a remote temperature sensor, allowing for direct measurement of sea surface temperature.
The instrument can operate in Polled, Autonomous and Serial Line Sync sampling modes:
- Polled sampling: the instrument takes one sample on command
- Autonomous sampling: the instrument samples at preprogrammed intervals and does not enter quiescence (sleep) state between samples
- Serial Line Sync: a pulse on the serial line causes the instrument to wake up, sample and re-enter quiescent state automatically
Specifications
| Conductivity | Temperature | Salinity | |
|---|---|---|---|
| Range | 0 to 7 Sm-1 | -5 to 35°C | |
| Initial accuracy | 0.0003 Sm-1 | 0.002°C | 0.005 (typical) |
| Resolution | 0.00001 Sm-1 | 0.0001°C | 0.0002 (typical) |
| Typical stability (per month) | 0.0003 Sm-1 | 0.0002°C | 0.003 (typical) |
Further details can be found in the manufacturer's specification sheet.
RRS James Cook cruise JC150 surface hydrography data processing procedures
Originator's Data Processing
The data were logged by the TECHSAS (TECHnical and Scientific sensors Acquisition System) version 5.11 data logging system into daily NetCDF files which were provided to BODC for processing. Data was additionally logged into the RVS Level-C format which have been archived at BODC.
Files delivered to BODC
| Filename | Content description | Format | Interval | Start date/time (UTC) | End date/time (UTC) | Comments |
| yyyymmdd-000000-Surf-SURFMET.SURFMETv2 | Fluorescence and transmittance | NetCDF | 1 sec. | 22/06/2017 12:11:25 | 12/08/2017 07:01:48 | |
| yyyymmdd-000000-SBE45-SBE45.TSG | Housing Temperature, remote temperature, salinity and conductivity | NetCDF | 1 sec. | 22/06/2017 12:11:24 | 12/08/2017 07:24:48 |
BODC Data Processing
The files were reformatted to BODC internal format using standard data banking procedures. All files were averaged to 60 second intervals. The following table shows how the variables within the files were mapped to appropriate BODC parameter codes:
yyyymmdd-000000-Surf-SURFMET.SURFMETv2
| Originator's variable | Originator's units | Description | BODC Code | BODC Units | Unit conversion | Comments |
| trans | volts | Raw voltage measured by transmissometer | TVLTDR01 | volts | none | |
| temp_h | degrees celcius | Housing water temperature | Not transferred | |||
| fluo | volt | Raw voltage measured by fluorometer | FVLTWS01 | volt | none | |
| temp_m | degrees celcius | Remote temperature | Not transferred | |||
| cond | s/m | Conductivity | Not transferred | |||
| time | days since 1899-12-30 00:00:00 UTC | Acquisition time | Not transferred |
yyyymmdd-000000-SBE45-SBE45.TSG
| Originator's variable | Originator's units | Description | BODC Code | BODC Units | Unit conversion | Comments |
| salin | dimensionless | TSG salinity | PSALSU01 | dimensionless | none | |
| temp_h | degrees celcius | Housing water temperature | TMESSG01 | degrees celcius | none | |
| sndspeed | m/s | TSG sound velocity | Not transferred | |||
| cond | s/m | Conductivity | CNDCSG01 | s/m | none | |
| temp_r | degrees celcius | Remote water temperature | TEMPHU01 | degrees celcius | none | |
| time | days since 1899-12-30 00:00:00 UTC | Acquisition time | Not transferred |
All the reformatted data were visualised using the in-house EDSERPLO software. Suspect data were marked by adding an appropriate quality control flag.
Calibration
Manufacturers Calibrations
Transmissometer
The transmissometer voltage channel was converted to beam transmission ( beamtrans ) and beam attenuation ( atten ) as follows:
beamtrans [%] = ([ volts - Vdark ] / [ Vref - Vdark ])100
atten [per m] = (-1/ pathlength ) ln( beamtrans /100)
where Vdark = 0.058 V, Vref = 4.667 V and pathlength = 0.25 m.
Fluorometer
The fluorescence voltage channel was converted to engineering units ( chla ) using the following calibration:
chla [µg/L]= SF ( volts - CWO )
where SF = 15.8 µg/L/V and CWO = 0.050 V.
Field Calibrations
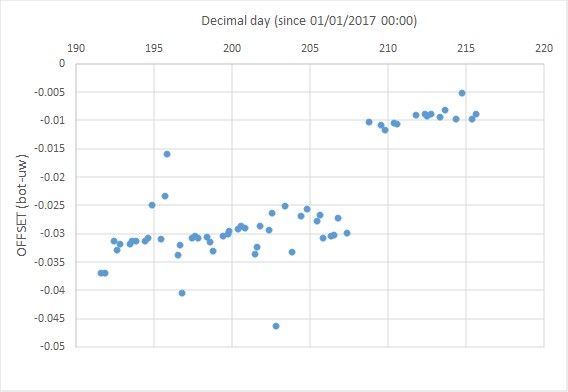
Salinity was calibrated against independent bottles samples collected 2-3 times a day during the cruise from the non-toxic, pumped seawater supply located next to the TSG. Bottle salinities and corresponding underway data values were extracted using standard BODC procedures (n = 65). Three sample points were removed because there were no corresponding UW data at the times bottle samples were collected (n = 62). The salinity offset was calculated (BOT-UW). After the offset was calculated, two steps were identified in the calibration data which corresponded to a manual cleaning event on 28/07/2017 10:40 (decimal day 208.44) as shown below. Therefore, the data were split into two sections (pre-clean and post-clean) and calibrated separately. Four outliers were removed because they were more than twice the standard deviation around the mean of each section (n = 58).
Pre-clean calibration
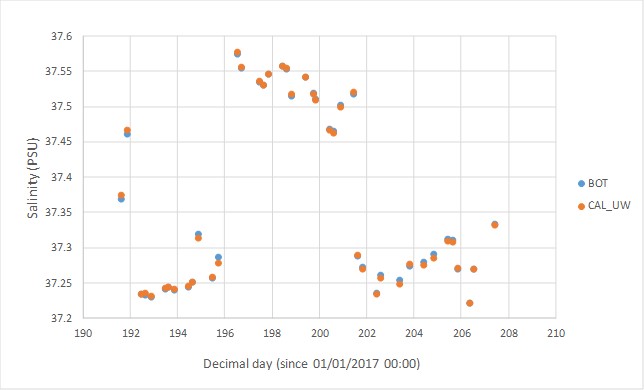
A significant but weak trend was found between the salinity offset and time (R2 = 0.206, n = 43, P = 0.002), however, when applied to the data it did not fully adjust the underway data to match bottle samples across the section. A significant mean offset was observed and appeared to adjust the calibrated data well (as shown below). Therefore, underway salinity was calibrated with a mean offset as follows:
UW[new] (PSU) = UW[old] (PSU) - 0.0302 (±0.0029 S.D., P <0.001, n = 43)
Post-clean calibration
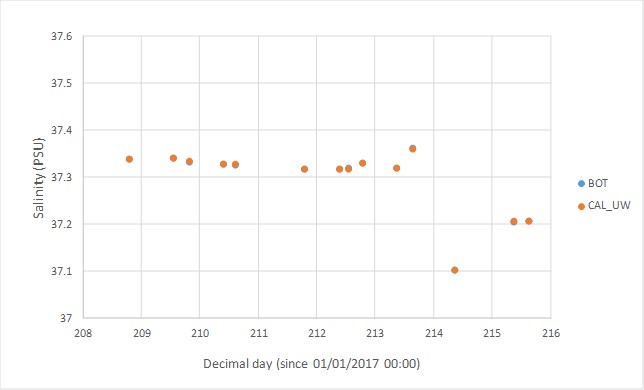
A significant but weak trend was found between the salinity offset and time (R2adj = 0.395, n = 14, P = 0.010), however, when applied to the data it did not fully adjust the underway data to match bottle samples across the section. A significant mean offset was observed and appeared to adjust the calibrated data well (as shown below). Therefore, underway salinity was calibrated with a mean offset as follows:
UW[new] (PSU) = UW[old] (PSU) - 0.0097 (±0.0010 S.D., P <0.001, n = 14)
Project Information
Zinc, iron and phosphorous co-limitation in the Ocean: ZIPLOc
ZIPLOc is an 3 year project that aims to measure how zinc and phosphorous control biological activity in the North Atlantic subtropical gyre using novel measurement techniques. The observations made will be further explored using the latest modelling techniques over decadal timescales and in other basins.
The research aims to make an improvement in our overall understanding of how subtropical gyre ecosystems respond to ongoing climate change.
The project is led by the University of Liverpool, Earth, Ocean and Ecological Sciences and is a collaboration with the University of Southampton, School of Ocean and Earth Science. The project received funding from the Natural Environmental Research Council and runs between January 2017 and February 2020.
Data Activity or Cruise Information
Cruise
| Cruise Name | JC150 (GApr08, ZIPLOC) |
| Departure Date | 2017-06-25 |
| Arrival Date | 2017-08-12 |
| Principal Scientist(s) | Claire Mahaffey (University of Liverpool Department of Earth, Ocean and Ecological Sciences) |
| Ship | RRS James Cook |
Complete Cruise Metadata Report is available here
Fixed Station Information
No Fixed Station Information held for the Series
BODC Quality Control Flags
The following single character qualifying flags may be associated with one or more individual parameters with a data cycle:
| Flag | Description |
|---|---|
| Blank | Unqualified |
| < | Below detection limit |
| > | In excess of quoted value |
| A | Taxonomic flag for affinis (aff.) |
| B | Beginning of CTD Down/Up Cast |
| C | Taxonomic flag for confer (cf.) |
| D | Thermometric depth |
| E | End of CTD Down/Up Cast |
| G | Non-taxonomic biological characteristic uncertainty |
| H | Extrapolated value |
| I | Taxonomic flag for single species (sp.) |
| K | Improbable value - unknown quality control source |
| L | Improbable value - originator's quality control |
| M | Improbable value - BODC quality control |
| N | Null value |
| O | Improbable value - user quality control |
| P | Trace/calm |
| Q | Indeterminate |
| R | Replacement value |
| S | Estimated value |
| T | Interpolated value |
| U | Uncalibrated |
| W | Control value |
| X | Excessive difference |
SeaDataNet Quality Control Flags
The following single character qualifying flags may be associated with one or more individual parameters with a data cycle:
| Flag | Description |
|---|---|
| 0 | no quality control |
| 1 | good value |
| 2 | probably good value |
| 3 | probably bad value |
| 4 | bad value |
| 5 | changed value |
| 6 | value below detection |
| 7 | value in excess |
| 8 | interpolated value |
| 9 | missing value |
| A | value phenomenon uncertain |
| B | nominal value |
| Q | value below limit of quantification |
