Metadata Report for BODC Series Reference Number 1816659
Metadata Summary
Problem Reports
Data Access Policy
Narrative Documents
Project Information
Data Activity or Cruise Information
Fixed Station Information
BODC Quality Flags
SeaDataNet Quality Flags
Metadata Summary
Data Description |
|||||||||||||||||||||||||||||||||||||||||||||||||
|
|||||||||||||||||||||||||||||||||||||||||||||||||
Data Identifiers |
|||||||||||||||||||||||||||||||||||||||||||||||||
|
|||||||||||||||||||||||||||||||||||||||||||||||||
Time Co-ordinates(UT) |
|||||||||||||||||||||||||||||||||||||||||||||||||
|
|||||||||||||||||||||||||||||||||||||||||||||||||
Spatial Co-ordinates | |||||||||||||||||||||||||||||||||||||||||||||||||
|
|||||||||||||||||||||||||||||||||||||||||||||||||
Parameters |
|||||||||||||||||||||||||||||||||||||||||||||||||
|
|||||||||||||||||||||||||||||||||||||||||||||||||
|
|||||||||||||||||||||||||||||||||||||||||||||||||
Problem Reports
Trapped bubbles are potentially affecting the transmissometer readings from the start of the series with an exhibited decrease trend. All values have been flagged. (BODC assessment)
Trapped bubbles are potentially affecting the transmissometer readings from the start of the series with an exhibited decrease trend. All values have been flagged. (BODC assessment)
Trapped bubbles are potentially affecting the transmissometer readings from the start of the series with an exhibited decrease trend. All values have been flagged. (BODC assessment)
RRS James Cook JC088 surface hydrography quality control report
General comments
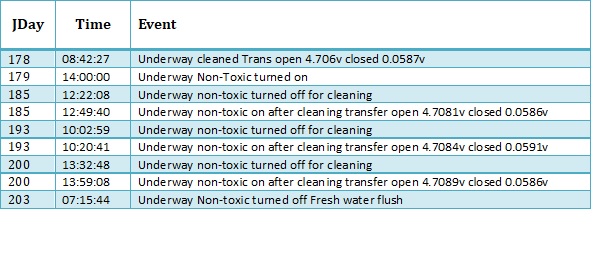
The Non-toxic water supply was turned off and the sensors cleaned at intervals throughout the cruise details below. Transmissometer readings were taken after cleaning with the sensor in open air and closed off to light, readings are also below. All channels were flagged when the pump for the non-toxic supply was temporarily switched off.
Temperature and Salinity
Strong variations in sea surface temperatures (measured at the raw water inlet and in the housing; Temp_r, Temp_h) and Salinity, were observed. Subsequently, the sensors were switched off and on, on 11th July 2013 at 12:30 GMT, however this had no effect on the data. It was noted that these variations coincided with the beginning of the MSS (microstructure) profiling, during which the ship's speed was reduced to 0.5-1 kn. Increasing atmospheric pressure and rising air temperatures were also observed during this period, and subsequently a strong thermocline developed in the surface layer. It was concluded that the vertical motion of the ship through the stratified surface layer caused the strong variations in observed sea surface temperatures. (Originators assessment)
Chlorophyll
The manufacturers calibrated chlorophyll should be treated with caution. Calibration of underway fluorimetry is notoriously difficult because of daytime fluorescence quenching in surface waters. (Originators assessment)
Data Access Policy
Open Data
These data have no specific confidentiality restrictions for users. However, users must acknowledge data sources as it is not ethical to publish data without proper attribution. Any publication or other output resulting from usage of the data should include an acknowledgment.
If the Information Provider does not provide a specific attribution statement, or if you are using Information from several Information Providers and multiple attributions are not practical in your product or application, you may consider using the following:
"Contains public sector information licensed under the Open Government Licence v1.0."
Narrative Documents
SeaBird Digital Oceanographic Thermometer SBE38
The SBE38 is an ultra-stable thermistor that can be integrated as a remote temperature sensor with an SBE21 Thermosalinograph or an SBE 45 Micro TSG, or as a secondary temperature sensor with an SBE 16 plus, 16plus-IM, 16plus V2, 16plus-IM V2 or 19plus V2 SEACAT CTD.
Temperature is determined by applying an AC excitation to reference resistances and an ultra-stable aged thermistor. The reference resistor is a hermetically sealed VISHAY. AC excitation and ratiometric comparison using a common processing channel removes measurement errors due to parasitic thermocouples, offset voltages, leakage currents and gain errors.
The SBE38 can operate in polled sampling, where it takes one sample and transmits the data, or in continuous sampling.
Specifications
| Depth rating | up to 10500 m |
| Temperature range | -5 to 35°C |
| Initial accuracy | ± 0.001°C |
| Resolution | 0.00025°C |
| Stability | 0.001°C in 6 months |
| Response time | 500 ms |
| Self-heating error | < 200 µK |
Further details can be found in the manufacturer's specification sheet.
WET Labs WETStar Fluorometers
WET Labs WETStar fluorometers are miniature flow-through fluorometers, designed to measure relative concentrations of chlorophyll, CDOM, uranine, rhodamineWT dye, or phycoerythrin pigment in a sample of water. The sample is pumped through a quartz tube, and excited by a light source tuned to the fluorescence characteristics of the object substance. A photodiode detector measures the portion of the excitation energy that is emitted as fluorescence.
Specifications
By model:
| Chlorophyll WETStar | CDOM WETStar | Uranine WETStar | Rhodamine WETStar | Phycoerythrin WETStar | |
|---|---|---|---|---|---|
| Excitation wavelength | 460 nm | 370 nm | 485 nm | 470 nm | 525 nm |
| Emission wavelength | 695 nm | 460 nm | 530 nm | 590 nm | 575 nm |
| Sensitivity | 0.03 µg l-1 | 0.100 ppb QSD | 1 µg l-1 | - | - |
| Range | 0.03-75 µg l-1 | 0-100 ppb; 0-250 ppb | 0-4000 µg l-1 | - | - |
All models:
| Temperature range | 0-30°C |
|---|---|
| Depth rating | 600 m |
| Response time | 0.17 s analogue; 0.125 s digital |
| Output | 0-5 VDC analogue; 0-4095 counts digital |
Further details can be found in the manufacturer's specification sheet, and in the instrument manual.
WETLabs C-Star transmissometer
This instrument is designed to measure beam transmittance by submersion or with an optional flow tube for pumped applications. It can be used in profiles, moorings or as part of an underway system.
Two models are available, a 25 cm pathlength, which can be built in aluminum or co-polymer, and a 10 cm pathlength with a plastic housing. Both have an analog output, but a digital model is also available.
This instrument has been updated to provide a high resolution RS232 data output, while maintaining the same design and characteristics.
Specifications
| Pathlength | 10 or 25 cm |
| Wavelength | 370, 470, 530 or 660 nm |
| Bandwidth | ~ 20 nm for wavelengths of 470, 530 and 660 nm ~ 10 to 12 nm for a wavelength of 370 nm |
| Temperature error | 0.02 % full scale °C-1 |
| Temperature range | 0 to 30°C |
| Rated depth | 600 m (plastic housing) 6000 m (aluminum housing) |
Further details are available in the manufacturer's specification sheet or user guide.
RRS James Cook JC088 Surface Hydrography Instrumentation
Instrumentation
The sea surface hydrographical suite of sensors was fed by the pumped-seawater, non-toxic supply. The depth of the seawater intake was at 5.5 m.
The following surface hydrology sensors were fitted:
| Manufacturer | Model | Serial number | Last manufacturer's calibration date | Comments |
| WETLabs Fluorometer | WETStar | WS3S-351P | 24/07/2012 | |
| WETLabs Transmissometer | C-Star | CST-1132PR | 19/07/2012 | 25 cm pathlength |
| Sea-Bird Temperature sensor | SBE38 | 3854115-0490 | 12/12/2012 | |
| Sea-Bird | SBE45 TSG | 4548881-0230 | 27/11/2012 |
SeaBird MicroTSG Thermosalinograph SBE 45
The SBE45 MicroTSG is an externally powered instrument designed for shipboard measurement of temperature and conductivity of pumped near-surface water samples. The instrument can also compute salinity and sound velocity internally.
The MicroTSG comprises a platinum-electrode glass conductivity cell and a stable, pressure-protected thermistor temperature sensor. It also contains an RS-232 port for appending the output of a remote temperature sensor, allowing for direct measurement of sea surface temperature.
The instrument can operate in Polled, Autonomous and Serial Line Sync sampling modes:
- Polled sampling: the instrument takes one sample on command
- Autonomous sampling: the instrument samples at preprogrammed intervals and does not enter quiescence (sleep) state between samples
- Serial Line Sync: a pulse on the serial line causes the instrument to wake up, sample and re-enter quiescent state automatically
Specifications
| Conductivity | Temperature | Salinity | |
|---|---|---|---|
| Range | 0 to 7 Sm-1 | -5 to 35°C | |
| Initial accuracy | 0.0003 Sm-1 | 0.002°C | 0.005 (typical) |
| Resolution | 0.00001 Sm-1 | 0.0001°C | 0.0002 (typical) |
| Typical stability (per month) | 0.0003 Sm-1 | 0.0002°C | 0.003 (typical) |
Further details can be found in the manufacturer's specification sheet.
RRS James Cook JC088 Surface Hydrography processing procedures
Originator's Data Processing
The data were logged by the TECHSAS (TECHnical and Scientific sensors Acquisition System) system into daily NetCDF files. The TECHSAS system is used as the main data logging system on NMF-SS operated research vessels. Data were additionally logged into the RVS Level-C format files.
Each Level-C file was read into Matlab so that further processing, calibration and quality control could be performed on selected variables.
Samples from the ships underway water supply were taken every 6 hours up until 25th June 2012, and then every 4 hours thereafter, in order to provide calibration for salinity and chlorophyll concentration.
Salinity
A total of 136 useable salinity samples were analyzed using a Guildline Autosal salinometer (S/N 60839) against standard seawater. After the residuals were calculated, three distinct step changes were detected in the data. These coincided with the weekly non-toxic cleaning of the underway data. As a result, four periods were chosen to be analysed separately.
These periods were:
1st: 28th June - 4th July 2013
2nd: 4th - 12th July 2013
3rd: 12th - 19th July 2013
4th: 19th - 22nd July 2013
During the first period a total of 25 samples were used from which the mean and standard deviation of residuals (Sample SBE45) is - 0.0045 ±0.0011. An offset of -0.0045 has therefore been applied to the SBE45 underway salinity during this period.
During the second period 39 samples were used from which the mean and standard deviation of residuals (Sample SBE45) is - 0.0086 ±0.0014. An offset of -0.0086 has therefore been applied to the SBE45 underway salinity during this period.
During the third period 32 samples were used from which the mean and standard deviation of residuals (Sample SBE45) is - 0.0191 ±0.0014. An offset of -0.0191 has therefore been applied to the SBE45 underway salinity during this period.
During the last period 10 samples were used from which the mean and standard deviation of residuals (Sample SBE45) is - 0.0242 ±0.000712. An offset of -0.0242 has therefore been applied to the SBE45 underway salinity during this period.
Chlorophyll
A chlorophyll calibration was not attempted while at sea. The voltage (Fluor) and manufacturer calibration (CHL in µg/l) were provided to BODC in the .mat files but should be treated with caution.
Calibration of underway fluorimetry is notoriously difficult because of daytime fluorescence quenching in surface waters. During the day when the amount of incoming solar radiation is highest, light levels exceed the amount that phytoplankton cells in the surface can process and the excess energy is dissipated as heat rather than fluorescence. In this situation, the amount of fluorescence measured, relative to the amount of chlorophyll pigment present is decreased. In-situ measurements of chlorophyll concentration would therefore not show the same amount of chlorophyll present in the water. Other factors that can add significant variability in the relationship between fluorescence and pigment concentration are: community composition, light history of the cells (changes in mixed layer depth or stratification caused for example by a wind event), and nutrient limitation.
The worst spiking from a number of channels was removed, by identifying measurements falling beyond x standard deviations of the median within a Δt second window. In exceptional cases, spikes were identified and removed manually.
The Matlab surface hydrography files provided to BODC were used for BODC processing. Data were additionally logged into the RVS Level-C format files and TECHSAS which have been archived at BODC.
For more detailed information on the Originator's underway data processing, please see the cruise report
Files delivered to BODC
| Filename | Content description | Format | Interval | Start date/time (UTC) | End date/time (UTC) | Comments |
| JC88_SURF1_1s.mat | Housing Temperature, remote temperature, salinity | Matlab | 1 second | 28/06/2013 08:00:00 | 22/07/2013 07:15:00 | |
| JC88_SURF2_1s.mat | Fluorescence, Chlorophyll, transmittance, beam attenuance | Matlab | 1 second | 28/06/2013 08:00:00 | 22/07/2013 07:15:00 |
BODC Data Processing
The files were reformatted to BODC internal format using standard data banking procedures. All files were reduced to 60 second intervals. The following table shows how the variables within the files were mapped to appropriate BODC parameter codes:
JC88_SURF1_1s.mat
| Originator's variable | Originator's units | Description | BODC Code | BODC Units | Unit conversion | Comments |
| daynum | Decimal Julian day number | Measure timestamp | Not transferred | |||
| dd | Matlab serial date number | Measure timestamp | Not transferred | |||
| Latitude | degree_north | Latitude north | Not transferred | |||
| Longitude | degree_east | Longitude east | Not transferred | |||
| Salinity | pss-78 | TSG salinity calibrated | PSALSG01 | dimensionless | none | |
| Temp_h | degrees Celcius | Housing water temperature | TMESSG01 | degrees Celcius | none | |
| Temp_r | degrees Celcius | Remote water temperature | TEMPHU01 | degrees Celcius | none |
JC88_SURF2_1s.mat
| Originator's variable | Originator's units | Description | BODC Code | BODC Units | Unit conversion | Comments |
| daynum | Decimal Julian day number | Measure timestamp | Not transferred | |||
| dd | Matlab serial date number | Measure timestamp | Not transferred | |||
| Latitude | degree_north | Latitude north | Not transferred | |||
| Longitude | degree_east | Longitude east | Not transferred | |||
| Tr | % | Transmittance | POPTDR01 | % | none | |
| C | per metre | Beam attenuation coefficient | ATTNDR01 | per metre | none | |
| Fluor | volt | Raw voltage measured by fluorometer | FVLTWS01 | volt | none | |
| CHL | ug/l | Chlorophyll | CPHLUMTF | mg/m3 | none |
Screening
All the reformatted data were visualised using the in-house EDSERPLO software. Suspect data were marked by adding an appropriate quality control flag.
Calibration
Field Calibrations
Salinity was calibrated as described in the originators processing section above.
Manufacturers Calibrations
Transmissometer
The transmissometer voltage channel was converted to beam transmission ( beamtrans ) and beam attenuation ( atten ) by the originator as follows:
beamtrans [%] = ([ volts - Vdark ] / [ Vref - Vdark ])100
atten [per m] = (-1/ pathlength ) ln( beamtrans /100)
where Vdark = 0.060 V, Vref = 4.665 V and pathlength = 0.25 m.
Fluorometer
The fluorescence voltage channel was converted to engineering units ( chla ) by the originator using the following calibration:
chla [µg/L]= SF ( volts - CWO )
where SF = 12.7 µg/L/V and CWO = 0.057 V.
Project Information
Fluxes Across Sloping Topography of the North East Atlantic (FASTNEt)
Background
The FASTNEt consortium was funded to deliver NERC's Ocean Shelf Edge Exchange Programme. Commencing in October 2011, this four year study aims to couple established observational techniques, such as moorings and CTDs, with the very latest in autonomous sampling initiatives - including use of Autosub Long Range and gliders. With the aid of novel model techniques, these observations will be utilised to construct a new paradigm of Ocean/Shelf exchange.
Shelf edge regions mark the gateway between the world's deep oceans and shallower coastal seas, linking terrestrial, atmospheric and oceanic carbon pools and influencing biogeochemical fluxes. Shelf edge processes can influence near-shore productivity (and fisheries) and ultimately affect global climate.
FASTNEt brings together researchers from multiple UK organisations. Further collaboration has been established with five Project Partners: the UK Met Office, Marine Scotland Science, Agri-Food and Biosciences Institute, Marine Institute Ireland and Scripps Institution of Oceanography.
Scientific Objectives
- To determine the seasonality of physical gradients and exchange across the shelf edge by deploying new observational technologies (gliders, Autosub Long Range) and established techniques (long term moorings, drifters)
- To quantify key exchange mechanisms and to collect new data targeted at testing and improving high resolution models of the shelf edge, by carrying out detailed process studies in contrasting regions of the shelf edge of the NE Atlantic margin
- To develop a new parameterisation of shelf edge exchange processes suitable for regional-scale models, using improved resolution numerical, and new empirical models constrained by the observations
- To test the new parameterisations in a regional model in the context of making an assessment of inter-annual variability of ocean-shelf exchange.
Fieldwork
Three survey sites on the UK shelf edge have been selected for FASTNEt. These are a) the Celtic Sea shelf edge, b) Malin shelf and c) North Scotland shelf. Fieldwork is centred around two research cruises. The first, to the Celtic Sea, on RRS Discovery in June 2012. The second cruise visits the Malin shelf on RRS James Cook, during summer 2013. In addition to these dedicated cruises, opportunist cruise activity to the North Scotland shelf has been agreed with project partner Marine Scotland Science. Autonomous technologies will complement observations made during the cruises and provide knowledge of seasonal and inter-annual variability in exchange processes.
Instrumentation
Types of instruments/measurements:
- Gliders
- Autosub Long Range
- Drifter buoys
- Scanfish
- Microstructure profilers
- Moored CTD/CT loggers and ADCPs
- Shipboard measurements: CTD, underway, nutrients (and other discrete sampling), LADCP, ADCP.
Contacts
| Collaborator | Organisation |
|---|---|
| Prof. Mark Inall (lead) | Scottish Association for Marine Science, U.K |
| Dr. Jason Holt | National Oceanography Centre, U.K |
| Dr. Peter Miller | Plymouth Marine Laboratory, U.K |
| Dr. Mattias Green | Bangor University, U.K |
| Prof. Jonathan Sharples | University of Liverpool, U.K |
| Dr. Vasyl Vlasenko | University of Plymouth, U.K |
Data Activity or Cruise Information
Cruise
| Cruise Name | JC088 |
| Departure Date | 2013-06-28 |
| Arrival Date | 2013-07-24 |
| Principal Scientist(s) | Mark E Inall (Scottish Association for Marine Science) |
| Ship | RRS James Cook |
Complete Cruise Metadata Report is available here
Fixed Station Information
No Fixed Station Information held for the Series
BODC Quality Control Flags
The following single character qualifying flags may be associated with one or more individual parameters with a data cycle:
| Flag | Description |
|---|---|
| Blank | Unqualified |
| < | Below detection limit |
| > | In excess of quoted value |
| A | Taxonomic flag for affinis (aff.) |
| B | Beginning of CTD Down/Up Cast |
| C | Taxonomic flag for confer (cf.) |
| D | Thermometric depth |
| E | End of CTD Down/Up Cast |
| G | Non-taxonomic biological characteristic uncertainty |
| H | Extrapolated value |
| I | Taxonomic flag for single species (sp.) |
| K | Improbable value - unknown quality control source |
| L | Improbable value - originator's quality control |
| M | Improbable value - BODC quality control |
| N | Null value |
| O | Improbable value - user quality control |
| P | Trace/calm |
| Q | Indeterminate |
| R | Replacement value |
| S | Estimated value |
| T | Interpolated value |
| U | Uncalibrated |
| W | Control value |
| X | Excessive difference |
SeaDataNet Quality Control Flags
The following single character qualifying flags may be associated with one or more individual parameters with a data cycle:
| Flag | Description |
|---|---|
| 0 | no quality control |
| 1 | good value |
| 2 | probably good value |
| 3 | probably bad value |
| 4 | bad value |
| 5 | changed value |
| 6 | value below detection |
| 7 | value in excess |
| 8 | interpolated value |
| 9 | missing value |
| A | value phenomenon uncertain |
| B | nominal value |
| Q | value below limit of quantification |
