Metadata Report for BODC Series Reference Number 2012150
Metadata Summary
Problem Reports
Data Access Policy
Narrative Documents
Project Information
Data Activity or Cruise Information
Fixed Station Information
BODC Quality Flags
SeaDataNet Quality Flags
Metadata Summary
Data Description |
|||||||||||||||||||||||||||||||||||||||||||||||||||||||||
|
|||||||||||||||||||||||||||||||||||||||||||||||||||||||||
Data Identifiers |
|||||||||||||||||||||||||||||||||||||||||||||||||||||||||
|
|||||||||||||||||||||||||||||||||||||||||||||||||||||||||
Time Co-ordinates(UT) |
|||||||||||||||||||||||||||||||||||||||||||||||||||||||||
|
|||||||||||||||||||||||||||||||||||||||||||||||||||||||||
Spatial Co-ordinates | |||||||||||||||||||||||||||||||||||||||||||||||||||||||||
|
|||||||||||||||||||||||||||||||||||||||||||||||||||||||||
Parameters |
|||||||||||||||||||||||||||||||||||||||||||||||||||||||||
|
|||||||||||||||||||||||||||||||||||||||||||||||||||||||||
|
|||||||||||||||||||||||||||||||||||||||||||||||||||||||||
Problem Reports
As stated on page 115 of the cruise report, the Transmissometer was producing poor data up until ~20:00 on 22/03/2017. The data cycles show a significant improvement after cleaning but the quality of the data declines with time throughout the series. There are many spikes observed and the channel exhibits arbitrary decline for the remainder of the cruise after the cleaning on 22/03/2017. This is likely due to trapped bubbles at the sensor. Consequently, the entire channel has been flagged. No additional cleaning took place for the remainder of the cruise.
As stated on page 115 of the cruise report, the Transmissometer was producing poor data up until ~20:00 on 22/03/2017. The data cycles show a significant improvement after cleaning but the quality of the data declines with time throughout the series. There are many spikes observed and the channel exhibits arbitrary decline for the remainder of the cruise after the cleaning on 22/03/2017. This is likely due to trapped bubbles at the sensor. Consequently, the entire channel has been flagged. No additional cleaning took place for the remainder of the cruise.
JR16005 Sea Surface Hydrography Quality Control Report
Fluorescence
The quality of the Fluorescence channel looks good overall. Flags were applied to some minor noisy periods and to where some large spikes were observed.
Sea surface temperature and housing temperature, conductivity and salinity
The remote temperature channels are very consistent with little to no variations between the two channels. On comparison, the difference between the remote channels and the housing channel is significant. The housing channel is between approximately between 38.9% and 44.8% warmer than the remote channels and features ~2 minutes delay.
Data Access Policy
Open Data
These data have no specific confidentiality restrictions for users. However, users must acknowledge data sources as it is not ethical to publish data without proper attribution. Any publication or other output resulting from usage of the data should include an acknowledgment.
If the Information Provider does not provide a specific attribution statement, or if you are using Information from several Information Providers and multiple attributions are not practical in your product or application, you may consider using the following:
"Contains public sector information licensed under the Open Government Licence v1.0."
Narrative Documents
RRS James Clark Ross cruise JR16005 underway document
Cruise details
| Dates | 17th March 2017 - 8th May 2017 (UTC) |
|---|---|
| Principal Scientific Officer | Prof. Alberto Naveira Garabato (British Antarctic Survey) |
SeaBird Digital Oceanographic Thermometer SBE38
The SBE38 is an ultra-stable thermistor that can be integrated as a remote temperature sensor with an SBE21 Thermosalinograph or an SBE 45 Micro TSG, or as a secondary temperature sensor with an SBE 16 plus, 16plus-IM, 16plus V2, 16plus-IM V2 or 19plus V2 SEACAT CTD.
Temperature is determined by applying an AC excitation to reference resistances and an ultra-stable aged thermistor. The reference resistor is a hermetically sealed VISHAY. AC excitation and ratiometric comparison using a common processing channel removes measurement errors due to parasitic thermocouples, offset voltages, leakage currents and gain errors.
The SBE38 can operate in polled sampling, where it takes one sample and transmits the data, or in continuous sampling.
Specifications
| Depth rating | up to 10500 m |
| Temperature range | -5 to 35°C |
| Initial accuracy | ± 0.001°C |
| Resolution | 0.00025°C |
| Stability | 0.001°C in 6 months |
| Response time | 500 ms |
| Self-heating error | < 200 µK |
Further details can be found in the manufacturer's specification sheet.
Turner Designs 10AU Field Fluorometer
The Turner Designs 10AU is designed for continuous-flow monitoring or discrete sample analyses of fluorescent species. A variety of optical kits with appropriate filters and lamps are available for a wide range of applications. Individual filters and lamps are also available for customised applications.
Standard optical kits include those for chlorophyll-a (extracted and/or in vivo), phycocyanin, phycoerythrin, CDOM, ammonium, rhodamine and fluorescein dye tracing, crude oil, refined oil, histamine and optical brighteners.
The instrument's light source is a 4 watt lamp and the detector is a photomultiplier tube with a standard detection range of 300-650 nm. A red-sensitive version with a detetion range of 185-970 nm is also available.
Specifications
| Operating temperature | 0 to 55°C |
| Detector | PhotoMultiplier Tube 300 to 650 nm (standard) 185 to 870 nm (Red) |
| Detection Limits: Extracted Chlorophyll-a Rhodamine WT Dye Fluorescein Dye | 0.025 µg L-1 0.01 ppb (in potable water) 0.01 ppb (in potable water) |
| Linear range: Extracted Chlorophyll-a Rhodamine WT Dye Fluorescein Dye | 0 to 250µg L-1 0 to 250 ppb 0 to 250 ppb |
Further details can be found in the manufacturer's specification sheet.
WETLabs C-Star transmissometer
This instrument is designed to measure beam transmittance by submersion or with an optional flow tube for pumped applications. It can be used in profiles, moorings or as part of an underway system.
Two models are available, a 25 cm pathlength, which can be built in aluminum or co-polymer, and a 10 cm pathlength with a plastic housing. Both have an analog output, but a digital model is also available.
This instrument has been updated to provide a high resolution RS232 data output, while maintaining the same design and characteristics.
Specifications
| Pathlength | 10 or 25 cm |
| Wavelength | 370, 470, 530 or 660 nm |
| Bandwidth | ~ 20 nm for wavelengths of 470, 530 and 660 nm ~ 10 to 12 nm for a wavelength of 370 nm |
| Temperature error | 0.02 % full scale °C-1 |
| Temperature range | 0 to 30°C |
| Rated depth | 600 m (plastic housing) 6000 m (aluminum housing) |
Further details are available in the manufacturer's specification sheet or user guide.
JR16005 Surface Hydrography Instrument Description Document
The sea surface hydrographical suite of sensors was fed by the pumped-seawater, non-toxic supply. The seawater intake was located at 6.5 m below the sea surface. The following surface hydrology sensors were fitted:
| Manufacturer | Model | Main Function | Serial number | Last calibration date | Comments |
| Sea Bird Electronics | SBE45 | Thermosalinograph | 4524698-0018 | 6/11/2015 | Manufacturer calibration applied |
| Sea Bird Electronics | SBE38 | Sea surface temperature (sensor 1) | 0767 | 18/05/2016 | Manufacturer calibration applied |
| Sea Bird Electronics | SBE38 | Sea surface temperature (sensor 2) | 0771 | 21/05/2016 | Manufacturer calibration applied |
| Turner Designs | 10AU Field and Laboratory Fluorometer | Chlorophyll fluorescence | 6456RTX | unknown | Calibrated by scientists onboard |
| Wet Labs | C-Star | Transmissometer | CST-527DR | 18/06/2015 | Manufacturer calibration applied |
Litre Meter flow meter
A flow meter used to monitor water flow rates for pumped systems such as ships' continuous seawater supplies.
SeaBird MicroTSG Thermosalinograph SBE 45
The SBE45 MicroTSG is an externally powered instrument designed for shipboard measurement of temperature and conductivity of pumped near-surface water samples. The instrument can also compute salinity and sound velocity internally.
The MicroTSG comprises a platinum-electrode glass conductivity cell and a stable, pressure-protected thermistor temperature sensor. It also contains an RS-232 port for appending the output of a remote temperature sensor, allowing for direct measurement of sea surface temperature.
The instrument can operate in Polled, Autonomous and Serial Line Sync sampling modes:
- Polled sampling: the instrument takes one sample on command
- Autonomous sampling: the instrument samples at preprogrammed intervals and does not enter quiescence (sleep) state between samples
- Serial Line Sync: a pulse on the serial line causes the instrument to wake up, sample and re-enter quiescent state automatically
Specifications
| Conductivity | Temperature | Salinity | |
|---|---|---|---|
| Range | 0 to 7 Sm-1 | -5 to 35°C | |
| Initial accuracy | 0.0003 Sm-1 | 0.002°C | 0.005 (typical) |
| Resolution | 0.00001 Sm-1 | 0.0001°C | 0.0002 (typical) |
| Typical stability (per month) | 0.0003 Sm-1 | 0.0002°C | 0.003 (typical) |
Further details can be found in the manufacturer's specification sheet.
JR16005 Surface Hydrography Processing Procedures Document
Originator's Data Processing
The sea surface hydrography measurements were performed by a Sea Bird electronics thermosalinograph in the ship's flow through system and by a temperature sensor located near the flow through intake, at the hull. The depth of the flow through intake was 6.5 m. The data streams were logged every second to the SCS system and merged into a comma separated file format, and logged to the Oceanlogger.ACO file. The header information was stored in the associated .TPL files.
The originator compiled the .ACO files into a MATLAB structure array for further processing. The originator's .MAT file includes thermosalinograph, flourometer and transmittance data. The .MAT file was provided to BODC and used for BODC processing.
| Filename | Content Discription | Format | Interval | Start date | Start Time | End date | End Time |
| underway_data.mat |
| .MAT | 4-6 sec | 18-03-2017 | 00:00:05 | 29-04-2017 | 23:59:55 |
BODC Data Processing
The files were reformatted to BODC internal format using standard data banking procedures. All files were averaged to 60 second intervals. The following table shows how the variables within the files were mapped to appropriate BODC parameter codes:
| Originator's File | Originator's Parameterth> | Originator's Units | Description | BODC code | BODC Units | Comments and unit conversions |
|---|---|---|---|---|---|---|
| underway_data.mat | salinity | psu | Sea surface practical salinity | PSALSU01 | Dimensionless | - |
| underway_data.mat | sstemp | °C | Sea surface temperature (sensor 1) | TEMPHU01 | °C | - |
| underway_data.mat | sstemp2 | °C | Sea surface temperature (sensor 1) | TEMPSU01 | °C | - |
| oceanlogger.ACO | tstemp1 | °C | Temperature of conductivity measurement | TMESSG01 | °C | Omitted from originator's .MAT file. Added from .ACO file |
| oceanlogger.ACO | conductivity | S m-1 | Electrical conductivity | CNDCSG01 | S m-1 | Omitted from originator's .MAT file. Added from .ACO file |
| underway_data.mat | chlorophyll | µg l-1 | Concentration of chlorophyll-a | CPHLUMTF | mg m-3 | - |
| underway_data.mat | flowrate | l min-1 | Flow rate through instrument | INFLTF01 | l min-1 | - |
| underway_data.mat | trans | % | Transmittance | TVLTDR01 | % | - |
Calibrations
Field Calibrations
No calibration against independent variables were applied to these data.
Manufacturers Calibrations
Transmissometer
The transmissometer voltage channel was converted to beam transmission ( beamtrans ) and beam attenuation ( atten ) as follows:
atten [per m] = (-1/ pathlength ) ln(beamtrans /100)
where pathlength = 0.25 m.
Project Information
Dynamics of Orkney Passage Outflow (DynOPO)
DynOPO is a five year research project that aims to understand how Antarctic Bottom Water is exported and modified through the Orkney Passage, the overflow's controlling dynamics, and its downstream impact on the Atlantic Ocean abyss.
Introduction
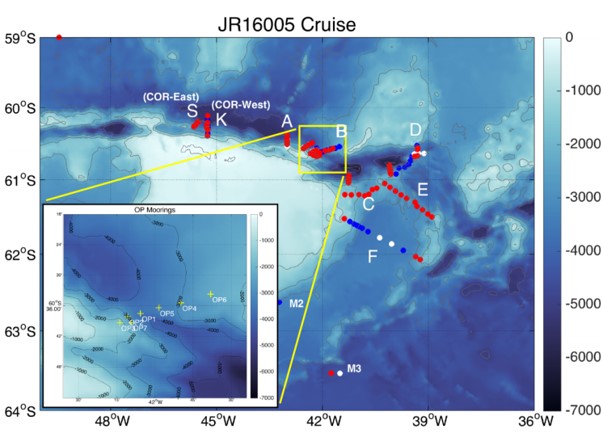
Mooring data collected for the DynOPO project are a component of a long term time series, in association with the Ocean Regulation of Climate by Heat and Carbon Sequestration and Transports (ORCHESTRA) project, led by Emily Shuckburgh (British Antarctic Survey) since 2016. The time series originally started out as part of the British Antarctic Survey's Long-Term Monitoring and Survey (LTMS) programme. Moorings were deployed on RRS James Clark Ross cruise JR20150309 (JR310 and JR272D) which ran from 09 March to 14 April 2015. RRS James Clark Ross cruise JR16005 ran from 17 March to 08 May 2017 and was the primary fieldwork element of the DynOPO project. The cruise had two main goals: (1) to conduct measurements of the hydrographic properties, velocity and turbulent processes of the Antarctic Bottom Water outflow along its pathway through the Orkney Passage region; and (2) to turn around a set of long-term moorings deployed in the area by British Antarctic Survey (BAS) and Lamont-Doherty Earth Observatory (LDEO) scientists, including recovery of additional instruments on some of the moorings deployed by JR20150309.
Project Collaborators
The project was led by the University of Southampton, and is an international collaboration with;
- UK: British Antarctic Survey (BAS), UK Meteorological Office, University of East Anglia and Newcastle University;
- Europe: University of Gothenburg (Sweden), University of Paris 6 (France);
- Australia: University of Tasmania;
- US: Lamont Doherty Earth Observatory, Woods Hole Oceanographic Institute, NOAA, University of California, Washington State University and Princeton University
Funding
The project was funded by the Natural Environment Research Council and ran from March 2015 to November 2018.
Data Activity or Cruise Information
Cruise
| Cruise Name | JR16005 |
| Departure Date | 2017-03-17 |
| Arrival Date | 2017-05-08 |
| Principal Scientist(s) | Alberto C Naveira Garabato (University of Southampton School of Ocean and Earth Science), Povl Abrahamsen (British Antarctic Survey) |
| Ship | RRS James Clark Ross |
Complete Cruise Metadata Report is available here
Fixed Station Information
No Fixed Station Information held for the Series
BODC Quality Control Flags
The following single character qualifying flags may be associated with one or more individual parameters with a data cycle:
| Flag | Description |
|---|---|
| Blank | Unqualified |
| < | Below detection limit |
| > | In excess of quoted value |
| A | Taxonomic flag for affinis (aff.) |
| B | Beginning of CTD Down/Up Cast |
| C | Taxonomic flag for confer (cf.) |
| D | Thermometric depth |
| E | End of CTD Down/Up Cast |
| G | Non-taxonomic biological characteristic uncertainty |
| H | Extrapolated value |
| I | Taxonomic flag for single species (sp.) |
| K | Improbable value - unknown quality control source |
| L | Improbable value - originator's quality control |
| M | Improbable value - BODC quality control |
| N | Null value |
| O | Improbable value - user quality control |
| P | Trace/calm |
| Q | Indeterminate |
| R | Replacement value |
| S | Estimated value |
| T | Interpolated value |
| U | Uncalibrated |
| W | Control value |
| X | Excessive difference |
SeaDataNet Quality Control Flags
The following single character qualifying flags may be associated with one or more individual parameters with a data cycle:
| Flag | Description |
|---|---|
| 0 | no quality control |
| 1 | good value |
| 2 | probably good value |
| 3 | probably bad value |
| 4 | bad value |
| 5 | changed value |
| 6 | value below detection |
| 7 | value in excess |
| 8 | interpolated value |
| 9 | missing value |
| A | value phenomenon uncertain |
| B | nominal value |
| Q | value below limit of quantification |
