Metadata Report for BODC Series Reference Number 2115498
Metadata Summary
Problem Reports
Data Access Policy
Narrative Documents
Project Information
Data Activity or Cruise Information
Fixed Station Information
BODC Quality Flags
SeaDataNet Quality Flags
Metadata Summary
Data Description |
|||||||||||||||||||||||||||||||||||||
|
|||||||||||||||||||||||||||||||||||||
Data Identifiers |
|||||||||||||||||||||||||||||||||||||
|
|||||||||||||||||||||||||||||||||||||
Time Co-ordinates(UT) |
|||||||||||||||||||||||||||||||||||||
|
|||||||||||||||||||||||||||||||||||||
Spatial Co-ordinates | |||||||||||||||||||||||||||||||||||||
|
|||||||||||||||||||||||||||||||||||||
Parameters |
|||||||||||||||||||||||||||||||||||||
|
|||||||||||||||||||||||||||||||||||||
Definition of BOTTFLAG | |||||||||||||||||||||||||||||||||||||
| BOTTFLAG | Definition |
|---|---|
| 0 | The sampling event occurred without any incident being reported to BODC. |
| 1 | The filter in an in-situ sampling pump physically ruptured during sample resulting in an unquantifiable loss of sampled material. |
| 2 | Analytical evidence (e.g. surface water salinity measured on a sample collected at depth) indicates that the water sample has been contaminated by water from depths other than the depths of sampling. |
| 3 | The feedback indicator on the deck unit reported that the bottle closure command had failed. General Oceanics deck units used on NERC vessels in the 80s and 90s were renowned for reporting misfires when the bottle had been closed. This flag is also suitable for when a trigger command is mistakenly sent to a bottle that has previously been fired. |
| 4 | During the sampling deployment the bottle was fired in an order other than incrementing rosette position. Indicative of the potential for errors in the assignment of bottle firing depth, especially with General Oceanics rosettes. |
| 5 | Water was reported to be escaping from the bottle as the rosette was being recovered. |
| 6 | The bottle seals were observed to be incorrectly seated and the bottle was only part full of water on recovery. |
| 7 | Either the bottle was found to contain no sample on recovery or there was no bottle fitted to the rosette position fired (but SBE35 record may exist). |
| 8 | There is reason to doubt the accuracy of the sampling depth associated with the sample. |
| 9 | The bottle air vent had not been closed prior to deployment giving rise to a risk of sample contamination through leakage. |
Definition of Rank |
|
|
Problem Reports
No Problem Report Found in the Database
Data Access Policy
GEOTRACES - data access conditions
Access to this data is currently restricted and it is not available via BODC's normal delivery mechanisms.
GEOTRACES data are published via the GEOTRACES IDP, available at:
Narrative Documents
Novel Ultraclean PRISTINE water sampler
Ultraclean water sampler developed by the Royal Netherlands Institute For Sea Research (NIOZ) for the GEOTRACES Program. Individual sample bottles have a capacity of 27 litres and include butterfly valves that ensure bottles are closed when passing through the ocean surface and reopen subsurface. Teflon valves for subsampling at the base of bottles ensure drainage of settling particulates. The top valve can be connected to gas pressure for pressure filtration at bottom sub sampling valve.
Bottles are deployed on a Kevlar hydrowire cable with internal signal cables, while the bottles themselves are composed of ultraclean PVDF (polyvinylidene difluoride). A single bottle may be used (e.g., during small boat work) or an array of bottles may be mounted on a titanium frame for shipboard CTD work. Trip mechanisms range from a weighted messenger to trip wires or hydraulics for rosette sampling.
Further details can be found in the brochure.
Dissolved nutrients from GEOTRACES GA02 cruises JC057
Responsible investigator
Evaline van Weerlee 1, Micha J A Rijkenberg 1
1Royal Netherlands Institute for Sea Research
Originator's Protocol for Data Acquisition and Analysis
During JC057 more than 1000 samples were analyzed for phosphate, silicate, nitrate and nitrite (912 samples from CTD bottles and 112 samples from the 'underway fish samples') using a Bran en Luebbe trAAcs 800 Auto-analyzer. The different nutrients were determined colorimetrical as described by Grashoff et al. (1983).
Samples were obtained from both CTD's, the large volume CTD rosette sampler and the ultra clean CTD, as well as the tow FISH. All samples were collected directly after the DIC and DOC sampling in 125ml polypropylene bottles and stored in a fridge at 4°C (unfiltered). Fish samples were filtrated over a 0.2 µm filters and collected in 125ml polypropylene bottles and stored at 4 °C prior to analysis.
Calibration Standards were prepared fresh every day diluted from stock solutions of the different nutrients in 0.2 µm filtered low nutrient seawater (LNSW). Stock standards were made by weighing in primary nutrient salts in deionized water (DIW) at the home laboratory. The analytical grade nutrient salts used were: 1) KH2PO4, 2) Na2SiF6, 3) KNO3, 4) NaNO2. The LNSW is surface seawater depleted for most nutrients, and is also used as baseline water for the analysis inbetween the samples. The samples were measured from the lowest to the highest concentration in order to keep the carry over effects as small as possible, so from surface to deep waters. Prior to analysis, all samples and standards were brought to room temperature of 23 °C.
In every run a mixed nutrient standard containing silicate, phosphate and nitrate a so called nutrient-cocktail, was measured in triplicate. Secondly a natural sterilized Reference Nutrient Sample (RMNS Kanso, Japan) containing a known concentration of silicate, phosphate, nitrate and nitrite , was analyzed in triplicate every run. The cocktail and the RMNS were both used to monitor the performance of the analysis. Finally the RMNS was used to adjust all data by means of computing with a factor, to obtain the final data set, so all referred to the same RMNS values for each analysis. This made data international comparable and comparable to the first legs of GEOTRACES.
From every station the deepest sample is sub sampled for nutrients in duplicate, the duplicate sample-vials were all stored dark at 4 °C, and measured again with the next station, for statistics.
The baseline resulted of low nutrient seawater (LNSW) the same water was used as diluents for the nutrient working standards. The back ground level of nutrients within this LNSW was determined by omitting one of the crucial reagents for color forming being: 1) Phosphate; ascorbic acid, 2) Silicate; ascorbic acid, 3) Nitrate; naphtylethylene diamine , 4) Nitrite; naphtylethylene diamine, compared with the same procedure in de-ionised water (MQ-water, Millipore). Taking A = LNSW + all reagents, B = LNSW + reagents - crucial reagent, C = MQ + all reagents, and D = MQ + reagents - crucial reagent, than the concentration of the nutrients of the zero nutrient baseline was determined using equation 1,
[nutrients baseline] = (A-B)-(C-D) * 1/slope of the calibration (1)
To clarify the baseline procedure the below example is given. The 'Baseline Background' procedure determines the amount of nutrient background in the base water being used. This procedure was performed by running the TrAAcs on all reagents and using the LNSW to be determined as the base water. The gain was set on its most sensitive setting and a low PO4 standard solution (0.2 to 0.5µM) was added to set the scale and its concentration measured with the peak height being recorded. Once a steady baseline was observed, a colour reagent line is placed into a reagent which doesn't contain the essential colour reagent, Ascorbic Acid, and then was placed back into the normal colour reagent mix. The process with and without the Ascorbic Acid in the colour reagent is then repeated with fresh Ultra-Pure Water being used as the baseline, see Figure 9. It is important to note that the Ultra-Pure Water needs to be checked for water quality. Therefore, by using the peak height from the added PO4 standard in LNSW and the difference between the baselines with and without the colour chemistry during LNSW and Ultra-Pure Water base waters, the Phosphate concentration in the LNSW can be computed using the following calculation;
µM of PO4 in LNSW = ([PO4] peak/y)*(ΔLNSW- ΔUltra-Pure Water) (2)
where,
[PO4] peak -is the concentration in µM of the low PO4 peak
y -is the peak height of the low concentration PO4 peak to the baseline
Δ LNSW -is the difference in baseline height that is seen with and then without ascorbic acid during LNSW base water
Δ Ultra Pure Water -is the difference in baseline height that is seen with and without ascorbic acid during Ultra-Pure Water baseline
All working standards were prepared by diluting stock standards with the LNSW. The salinity matrix of the working standards were not kept constant. The highest dilution was 1050 µl stock standard added to 98.95 ml LNSW which means an offset in salinity of maximum 0.4. Typically, the concentrations used for the calibration ranged between 0 up till 120% from the highest environmental concentrations that we encountered. Calibrations for all nutrients were always linear and therefore fitted linearly. A calibration was executed for each run of up to 48 samples maximum.
Table 1. Results of Reference material of Nutrients. The reference material of nutrients is deep Pacific Ocean seawater that is filtered, processed and bottled by The General Environment Technos Co., Ltd. 3-1-1, higashikuraji, katano-shi, Osaka, 576-0061 Japan. URL: http://www.kanso.co.jp/. The manufacturer provides values for concentrations on the basis of their own analyses. This value is not an absolute value, instead it is equivalent in accuracy to the value obtained by another laboratory for the same reference material. Therefore in a recent 2012 intercomparison excercise between laboratories a consensus value was produced, this is the mean of reported values of the X laboratories including NIOZ (Aoyama et al., 2013).
| Value provided by manufacturer Kanso (Lot code AX) [micromol/kg] | Shipboard value NIOZ [micromol/kg] | Consensus mean value (2012) [micromol/kg] | |
| Silicic acid | 59.5 | 58.50 | 59.41 (n=51) |
| Nitrate | 21.39 | 21.80 | 21.62 (n=44) |
| Phosphate | 01.59 | 01.61 | 01.62 (n=48) |
During the 2010-2012 GEOTRACES cruises of the Netherlands the reproducibility of the Kanso reference standard was typically around 0.6 % of the average value for silicate, phosphate, nitrate. Day-to-day variability of the analyses was monitored and compensated for by 2 approaches. Firstly the Kanso standard was run along with the 24 samples of each station, and at the end of the cruise the mean of these Kanso values was calculated and used to correct the devation of every analytical run station by station. Secondly, the deepest sample analyzed of a station of 24 samples, was also kept and re-analyzed within the next run of the next station of 24 samples as another verification for ruling out variability between runs.
Chemistry:
Silicate reacts with ammoniummolybdate to a yellow complex, after reduction with ascorbic acid the obtained blue silica molybdenum complex was measured at 800 nm. Oxalic acid was used to prevent formation of the blue phosphate molybdenum.
Phosphate reacts with ammoniummolybdate at pH 1.0, and potassiumantimonyl tartrate was used as an inhibitor. The yellow phosphate molybdenum complex was reduced by ascorbic acid and measured at 880 nm.
Nitrate plus nitrite (NOx) was mixed with a buffer imidazol at pH 7.5 and reduced by a copperized cadmium column to nitrite. This was diazotated with sulphanylamide and naphtylethylenediamine to a pink coloured complex and measured at 550 nm. After subtracting the nitrite value of the nitrite channel the nitrate value was achieved.
Nitrite was diazotated with sulphanylamide and naphtylethylenediamine to a pink coloured complex and measured at 550 nm.
References Cited
Grasshoff K, Erhardt M, Kremling K., 1983. Methods of seawater analysis, 2nd revised and extended edition. Verlag Chemie, Weinheim
Aoyama, M., and 67 others, 2013. 2012 Interlaboratory Comparison Study of a Reference Material for Nutrients in Seawater. Technical Report of the Meteorological Research Institute No. 70. In press.
BODC Data Processing Procedures
Data were received and were loaded using established BODC data banking procedures. This document covers data submitted using the following GEOTRACES parameters:
| GEOTRACES Parameter | GEOTRACES Units | Definition | Comments |
|---|---|---|---|
| NITRATE_D_CONC | umol/kg | Concentration of dissolved nitrate, samples may or may not have been filtered | - |
| NITRITE_D_CONC | umol/kg | Concentration of dissolved nitrite, samples may or may not have been filtered | - |
| PHOSPHATE_D_CONC | umol/kg | Concentration of dissolved phosphate, samples may or may not have been filtered | - |
| SILICATE_D_CONC | umol/kg | Concentration of dissolved silicate (silicic acid), samples may or may not have been filtered | - |
Data Quality Report
The nitrite channel has a sinus baseline signal during the cruise due to sensitive adjustment of the system. The detection limit was therefore increased to 0.04 µmol/L.
Project Information
GEOTRACES
Introduction
GEOTRACES is an international programme sponsored by SCOR which aims to improve our understanding of biogeochemical cycles and large-scale distribution of trace elements and their isotopes (TEIs) in the marine environment. The global field programme started in 2009 and will run for at least a decade. Before the official launch of GEOTRACES, fieldwork was carried out as part of the International Polar Year (IPY)(2007-2009) where 14 cruises were connected to GEOTRACES.
GEOTRACES is expected to become the largest programme to focus on the chemistry of the oceans and will improve our understanding of past, present and future distributions of TEIs and their relationships to important global processes.
This initiative was prompted by the increasing recognition that TEIs are playing a crucial role as regulators and recorders of important biogeochemical and physical processes that control the structure and productivity of marine ecosystems, the dispersion of contaminants in the marine environment, the level of greenhouse gases in the atmosphere, and global climate.
Scientific Objectives
GEOTRACES mission is: To identify processes and quantify fluxes that control the distribution of key trace elements and isotopes in the ocean, and to establish the sensitivity of these distributions to changing environmental conditions.
Three overriding goals support the GEOTRACES mission
- Determine ocean distributions of selected TEIs at all major ocean basins
- Evaluate the sources, sinks, and internal cycling of these TEIs and thereby characterize more completely their global biogeochemical cycles
- Provide a baseline distribution in the Polar Regions as reference for assessing past and future changes.
These goals will be pursued through complementary research strategies, including observations, experiments and modelling.
Fieldwork
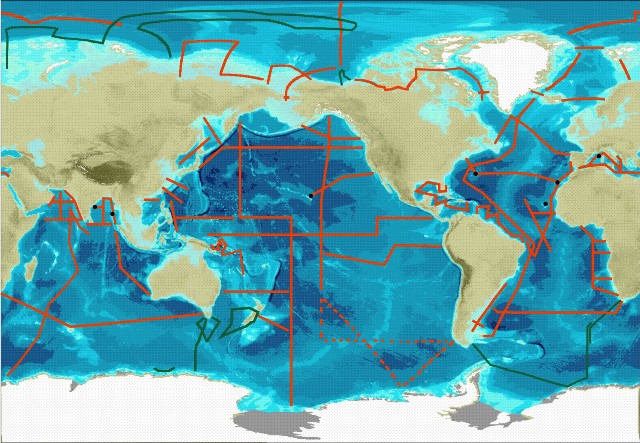
The central component of GEOTRACES fieldwork will be a series of cruises spanning all Ocean basins see map below.
Three types of cruise are required to meet the goals set out by GEOTRACES. These are
- Section cruises - These will measure all the key parameters (see below) over the full depth of the water column. The sections were discussed and approved by the International GEOTRACES Scientific Steering Committee at the basin workshops.
- Process Studies - These will investigate a particular process relevant to the cycling of trace metal and isotopes. They must follow the "Criteria for Establishing GEOTRACES Process Studies" and be approved by the International GEOTRACES Scientific Steering Committee.
- Cruises collecting GEOTRACES compliant data - These will collect some trace element or isotope data. They must follow the GEOTRACES Intercalibration and Data Management protocols
IPY-GEOTRACES
The IPY-GEOTRACES programme comprised of 14 research cruises on ships from 7 nations; Australia, Canada, France, Germany, New Zealand, Japan and Russia. The cruises will not be classified in the same way as the full GEOTRACES programme since the intercalibration protocols and data management protocols had not been established before the start of the IPY. But IPY-GEOTRACES data will still be quality controlled by GDAC and in the majority of cases verified versus Intercalibration standards or protocols.
Key parameters
The key parameters as set out by the GEOTRACES science plan are as follows: Fe, Al, Zn, Mn, Cd, Cu; 15N, 13C; 230Th, 231Pa; Pb isotopes, Nd isotopes; stored sample, particles, aerosols.
Weblink:
http://www.bodc.ac.uk/geotraces/
http://www.geotraces.org/
Data Activity or Cruise Information
Data Activity
| Start Date (yyyy-mm-dd) | 2011-03-25 |
| End Date (yyyy-mm-dd) | 2011-03-25 |
| Organization Undertaking Activity | Royal Netherlands Institute for Sea Research |
| Country of Organization | Netherlands |
| Originator's Data Activity Identifier | JC057_UCCTD_17_01_UCC |
| Platform Category | lowered unmanned submersible |
BODC Sample Metadata Report for JC057_UCCTD_17_01_UCC
| Sample reference number | Nominal collection volume(l) | Bottle rosette position | Bottle firing sequence number | Minimum pressure sampled (dbar) | Maximum pressure sampled (dbar) | Depth of sampling point (m) | Bottle type | Sample quality flag | Bottle reference | Comments |
|---|---|---|---|---|---|---|---|---|---|---|
| 639065 | 1 | 4974.60 | 4975.60 | 4891.00 | NIOZ PRISTINE ultraclean water sampler | No problem reported | 1 | |||
| 639068 | 2 | 4922.50 | 4923.50 | 4840.00 | NIOZ PRISTINE ultraclean water sampler | No problem reported | 2 | |||
| 639071 | 3 | 4573.90 | 4574.90 | 4501.00 | NIOZ PRISTINE ultraclean water sampler | No problem reported | 3 | |||
| 639074 | 4 | 4059.80 | 4060.80 | 4000.00 | NIOZ PRISTINE ultraclean water sampler | No problem reported | 4 | |||
| 639077 | 5 | 3548.70 | 3549.70 | 3500.00 | NIOZ PRISTINE ultraclean water sampler | No problem reported | 5 | |||
| 639080 | 6 | 3037.50 | 3038.50 | 3000.00 | NIOZ PRISTINE ultraclean water sampler | No problem reported | 6 | |||
| 639083 | 7 | 2530.20 | 2531.20 | 2502.00 | NIOZ PRISTINE ultraclean water sampler | No problem reported | 7 | |||
| 639086 | 8 | 2021.30 | 2022.30 | 2001.00 | NIOZ PRISTINE ultraclean water sampler | No problem reported | 8 | |||
| 639089 | 9 | 1767.00 | 1768.00 | 1750.00 | NIOZ PRISTINE ultraclean water sampler | No problem reported | 9 | |||
| 639092 | 10 | 1513.90 | 1514.90 | 1501.00 | NIOZ PRISTINE ultraclean water sampler | No problem reported | 10 | |||
| 639095 | 11 | 1261.20 | 1262.20 | 1251.00 | NIOZ PRISTINE ultraclean water sampler | No problem reported | 11 | |||
| 639098 | 12 | 1007.30 | 1008.30 | 1000.00 | NIOZ PRISTINE ultraclean water sampler | No problem reported | 12 | |||
| 639101 | 13 | 755.00 | 756.00 | 750.00 | NIOZ PRISTINE ultraclean water sampler | No problem reported | 13 | |||
| 639104 | 14 | 501.50 | 502.50 | 499.00 | NIOZ PRISTINE ultraclean water sampler | No problem reported | 14 | |||
| 639107 | 15 | 375.50 | 376.50 | 374.00 | NIOZ PRISTINE ultraclean water sampler | No problem reported | 15 | |||
| 639110 | 16 | 301.20 | 302.20 | 300.00 | NIOZ PRISTINE ultraclean water sampler | No problem reported | 16 | |||
| 639113 | 17 | 250.00 | 251.00 | 249.00 | NIOZ PRISTINE ultraclean water sampler | No problem reported | 17 | |||
| 639116 | 18 | 200.20 | 201.20 | 200.00 | NIOZ PRISTINE ultraclean water sampler | No problem reported | 18 | |||
| 639119 | 19 | 150.30 | 151.30 | 150.00 | NIOZ PRISTINE ultraclean water sampler | No problem reported | 19 | |||
| 639122 | 20 | 100.10 | 101.10 | 100.00 | NIOZ PRISTINE ultraclean water sampler | No problem reported | 20 | |||
| 639125 | 21 | 75.00 | 76.00 | 75.00 | NIOZ PRISTINE ultraclean water sampler | No problem reported | 21 | |||
| 639128 | 22 | 59.00 | 60.00 | 59.00 | NIOZ PRISTINE ultraclean water sampler | No problem reported | 22 | |||
| 639131 | 23 | 16.40 | 17.40 | 17.00 | NIOZ PRISTINE ultraclean water sampler | No problem reported | 23 | |||
| 639134 | 24 | 9.50 | 10.50 | 10.00 | NIOZ PRISTINE ultraclean water sampler | No problem reported | 24 |
Please note:the supplied parameters may not have been sampled from all the bottle firings described in the table above. Cross-match the Sample Reference Number above against the SAMPRFNM value in the data file to identify the relevant metadata.
Cruise
| Cruise Name | JC057 (GA02) |
| Departure Date | 2011-03-02 |
| Arrival Date | 2011-04-06 |
| Principal Scientist(s) | Micha J A Rijkenberg (Royal Netherlands Institute for Sea Research) |
| Ship | RRS James Cook |
Complete Cruise Metadata Report is available here
Fixed Station Information
No Fixed Station Information held for the Series
BODC Quality Control Flags
The following single character qualifying flags may be associated with one or more individual parameters with a data cycle:
| Flag | Description |
|---|---|
| Blank | Unqualified |
| < | Below detection limit |
| > | In excess of quoted value |
| A | Taxonomic flag for affinis (aff.) |
| B | Beginning of CTD Down/Up Cast |
| C | Taxonomic flag for confer (cf.) |
| D | Thermometric depth |
| E | End of CTD Down/Up Cast |
| G | Non-taxonomic biological characteristic uncertainty |
| H | Extrapolated value |
| I | Taxonomic flag for single species (sp.) |
| K | Improbable value - unknown quality control source |
| L | Improbable value - originator's quality control |
| M | Improbable value - BODC quality control |
| N | Null value |
| O | Improbable value - user quality control |
| P | Trace/calm |
| Q | Indeterminate |
| R | Replacement value |
| S | Estimated value |
| T | Interpolated value |
| U | Uncalibrated |
| W | Control value |
| X | Excessive difference |
SeaDataNet Quality Control Flags
The following single character qualifying flags may be associated with one or more individual parameters with a data cycle:
| Flag | Description |
|---|---|
| 0 | no quality control |
| 1 | good value |
| 2 | probably good value |
| 3 | probably bad value |
| 4 | bad value |
| 5 | changed value |
| 6 | value below detection |
| 7 | value in excess |
| 8 | interpolated value |
| 9 | missing value |
| A | value phenomenon uncertain |
| B | nominal value |
| Q | value below limit of quantification |
