Metadata Report for BODC Series Reference Number 597525
Metadata Summary
Problem Reports
Data Access Policy
Narrative Documents
Project Information
Data Activity or Cruise Information
Fixed Station Information
BODC Quality Flags
SeaDataNet Quality Flags
Metadata Summary
Data Description |
|||||||||||||||||||||||||||||||||
|
|||||||||||||||||||||||||||||||||
Data Identifiers |
|||||||||||||||||||||||||||||||||
|
|||||||||||||||||||||||||||||||||
Time Co-ordinates(UT) |
|||||||||||||||||||||||||||||||||
|
|||||||||||||||||||||||||||||||||
Spatial Co-ordinates | |||||||||||||||||||||||||||||||||
|
|||||||||||||||||||||||||||||||||
Parameters |
|||||||||||||||||||||||||||||||||
|
|||||||||||||||||||||||||||||||||
|
|||||||||||||||||||||||||||||||||
Problem Reports
No Problem Report Found in the Database
Data Access Policy
Open Data
These data have no specific confidentiality restrictions for users. However, users must acknowledge data sources as it is not ethical to publish data without proper attribution. Any publication or other output resulting from usage of the data should include an acknowledgment.
If the Information Provider does not provide a specific attribution statement, or if you are using Information from several Information Providers and multiple attributions are not practical in your product or application, you may consider using the following:
"Contains public sector information licensed under the Open Government Licence v1.0."
Narrative Documents
Falmouth Scientific Integrated CTD (ICTD) Profiler
The FSI ICTD is designed to collect high precision conductivity, temperature and pressure data with self calibrating electronics. This instrument can support five primary sensors (including up to three temperature sensors) and can be coupled with a water bottle sampler. The ICTD is equipped with a titanium housing rated to 7000 m and has a sampling rate of 32 Hz.
Three temperature sensors are available: primary platinum, redundant platinum and exposed thermistor. Any combination of these can be used in the primary channels. The instrument also has multiple RS-232 serial inputs for a variety of sensors including: ADCP, Benthos PSA-916 Altimeter and WetLabs SAFire. There are an additional eight DC input channels that can support virtually any sensor that has a DC output.
Specifications:
| Parameter | Conductivity | Temperature | Pressure |
| Sensor | Inductive cell | Platinum thermometer | Precision-machined Silicon |
| Range | 0 to 70 mS cm-1 | -2 to 35°C | Customer specified |
| Accuracy | ±0.002 mS cm-1 | 0.002°C | ±0.01 % full scale |
| Resolution | 0.0001 mS cm-1 | 0.00005°C | 0.0004 % full scale |
| Response | 5.0 cm at 1 ms-1 | 150 ms Platinum 20 ms Thermistor* | 25 ms |
*Optional
Further details can be found in the manufacturer's specification sheet.
LI-COR LI-192 Underwater Quantum Sensor
The LI-192 Underwater Quantum Sensor is used to measure photosynthetic photon flux density and is cosine corrected. The sensor is often referred to as LI-192SA or LI-192SB (the LI-192SB model was superseded by LI-192SA). One of the main differences is that the LI-192SA model includes a built-in voltage output for interfacing with NexSens iSIC and SDL data loggers.
Sensor specifications, current at January 2012, are given in the table below. More information can be found in the manufacturer's LI-192SA andLI-192SB specification sheets.
Sensor Specifications
(Specifications apply to both models unless otherwise stated)
| Absolute Calibration | ± 5 % in air traceable to NBS. |
|---|---|
| Sensitivity | Typically 3 µA per 1000 µmol s-1 m-2 for LI-192SB and 4 µA per 1000 µmol s-1 m-2 for LI-192SA in water. |
| Linearity | Maximum deviation of 1 % up to 10,000 µmol s-1 m-2. |
| Stability | < ± 2 % change over a 1 year period. |
| Response Time | 10 µs. |
| Temperature Dependence | ± 0.15 % per °C maximum. |
| Cosine Correction | Optimized for both underwater and atmospheric use. |
| Azimuth | < ± 1 % error over 360 ° at 45 ° elevation. |
| Detector | High stability silicon photovoltaic detector (blue enhanced). |
| Sensor Housing | Corrosion resistant metal with acrylic diffuser for both saltwater and freshwater applications. Waterproof to withstand 800 psi (5500 kPa) (560 meters). |
Seapoint Turbidity Meter
The Seapoint Turbidity Meter detects light scattered by particles suspended in water, generating an output voltage proportional to turbidity or suspended solids. Range is selected by two digital lines which can be hard wired or microprocessor controlled, thereby choosing the appropriate range and resolution for measurement of extremely clean to very turbid waters. The offset voltage is within 1 mV of zero and requires no adjustment across gains. The optical design confines the sensing volume to within 5 cm of the sensor allowing near-bottom measurements and minimizing errant reflections in restricted spaces.
Sensor specifications, current at August 2006, are given in the table below.
Sensor Specifications
| Power requirements | 7 - 20 VDC, 3.5 mA avg., 6 mA pk. |
|---|---|
| Output | 0 - 5.0 VDC |
| Output Time Constant | 0.1 sec. |
| RMS Noise> | < 1 mV |
| Power-up transient period | < 1 sec. |
| Light Source Wavelength | 880 nm |
| Sensing Distance (from windows) | < 5 cm (approx.) |
| Linearity | < 2% deviation 0 - 750 FTU |
| Gain | Sensitivity (mV FTU-1) | Range (FTU) | |
|---|---|---|---|
| Sensitivity/Range | 100x 20x 5x 1x | 200 40 10 2 | 25 125 500 ** |
** output is non-linear above 750 FTU.
Further details can be found in the manufacturer's specification sheet.
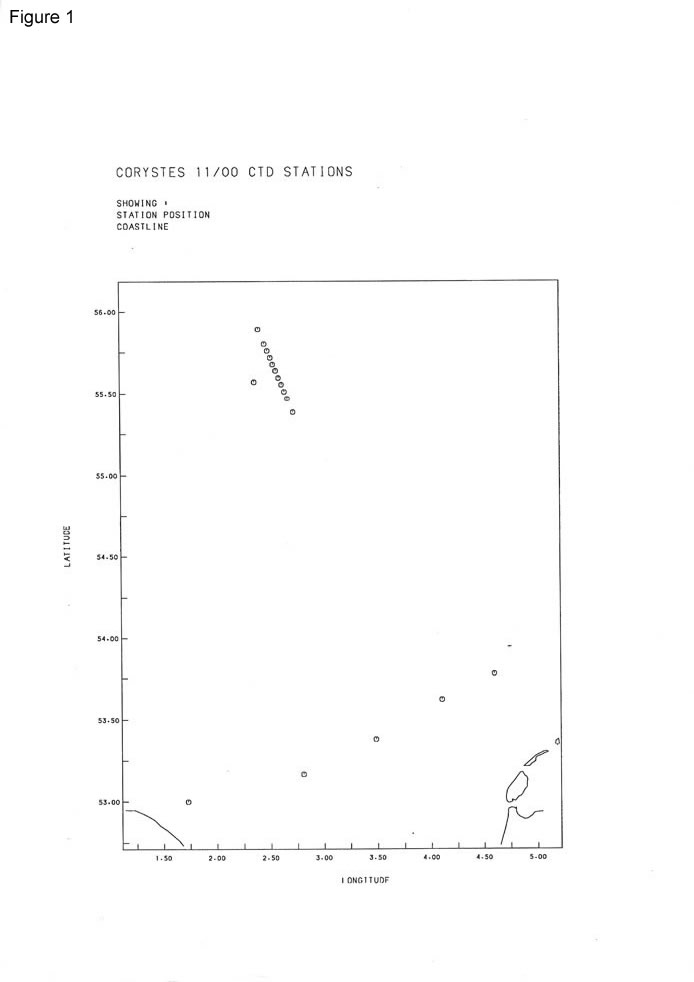
RV Corystes Cruise 11/00 CTD Data Documentation
Seventeen full depth CTD profiles were obtained using a FSI ICTD s/n 1366 during this cruise to the North Sea during August 2000; see Figure 1. Five stations (2, 166, 192, 202 and 207) were from contract A1221 productivity sites and twelve for contract A1219 on the Dogger Bank.
Samples were collected for salinity analysis (using a Guildline salinometer) to derive a calibration for the instrument conductivity sensor and a single pair of digital reversing thermometers used to compare with the CTD temperature estimates. A Seapoint fluorometer, a LSS to measure turbidity and a LICOR photosynthetically-active-radiation sensor with a six-decade log amplifier were fitted to the rosette. Chlorophyll samples were collected to calibrate the fluorometer and samples for suspended particulate matter analysis were used to calibrate the turbidity sensor.
(a) Pressure
The pressure sensor was calibrated using a dead-weight tester during August 2000 at 10 degC. This suggested that at 1020mb atmospheric pressure the CTD sensor was reading too low by 1.5db. During the cruise the 'on deck' CTD pressure immediately prior to lowering the CTD was recorded. This consistently indicated that the sensor was reading too low by 1.5db and these 'on deck' observations have been used to correct recorded CTD pressure:
P(cor) = P(unc) + 1.5 db
(b) Temperature
The PRT temperature sensor fitted to the CTD was calibrated using PRT's on 9th August 2000 (but using triple point cells coefficients determined on 18th May 2000) and this was used to correct the CTD temperature :
T(cor) = T(unc) + dT
dT = a*T(unc)*T(unc) + b*T(unc) + c
where a = -2.471e-5 b = 2.675e-4 c = 8.662e-4
These are equivalent to a correction between 1 and -2 millidegC in the range 8 to 18 degC.
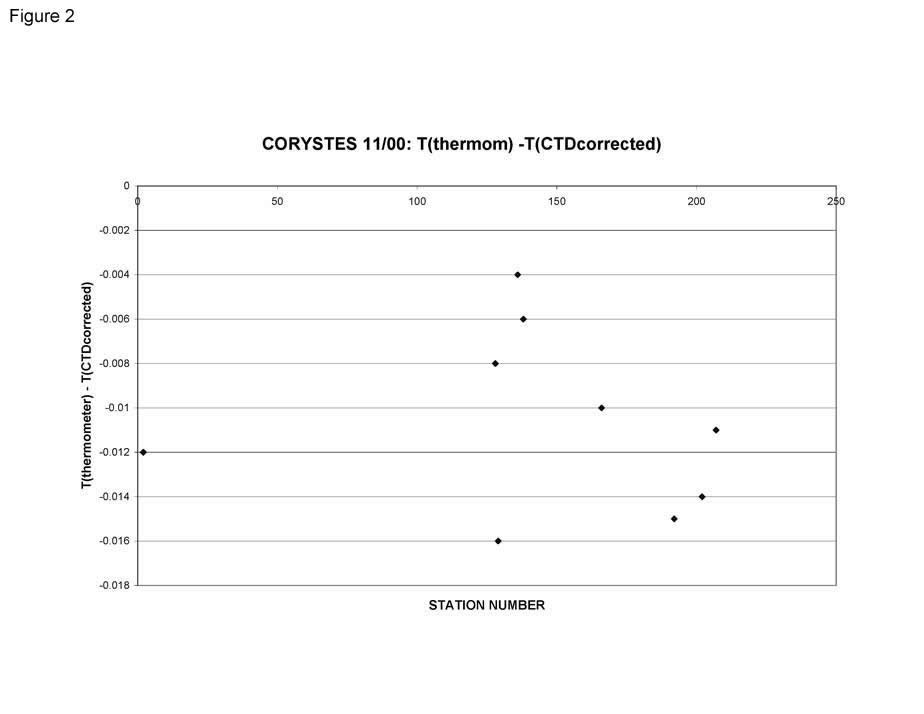
A pair of electronic thermometers was fitted to one Niskin bottle. The difference between the temperatures from thermometers and CTD is plotted in Figure 2. The difference is larger than expected but close to being within the tolerances of the two sensors (+/- 5 millidegC for the thermometers).
(c) Conductivity
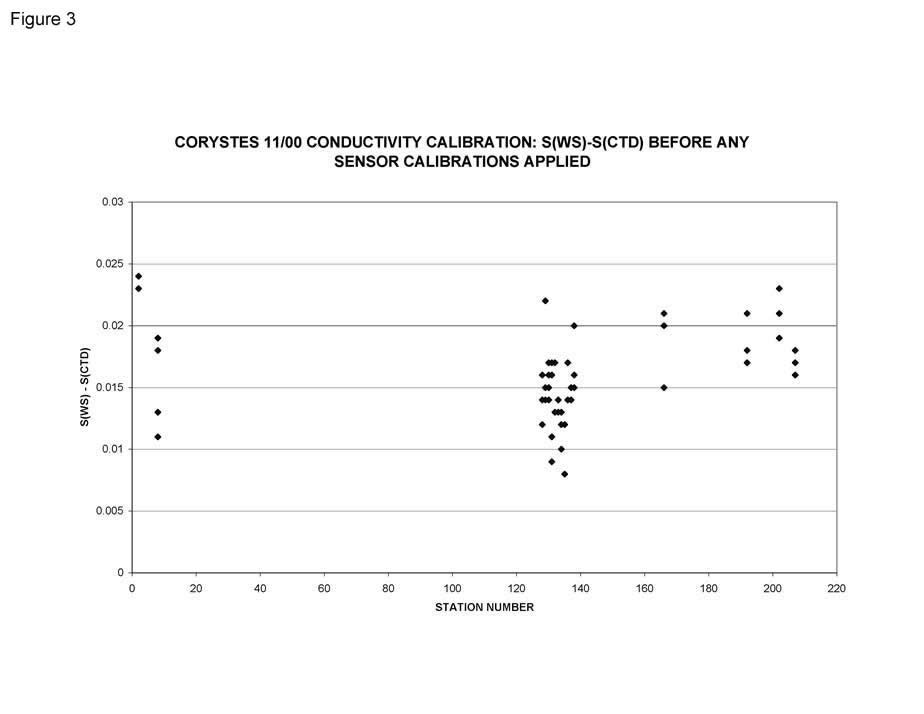
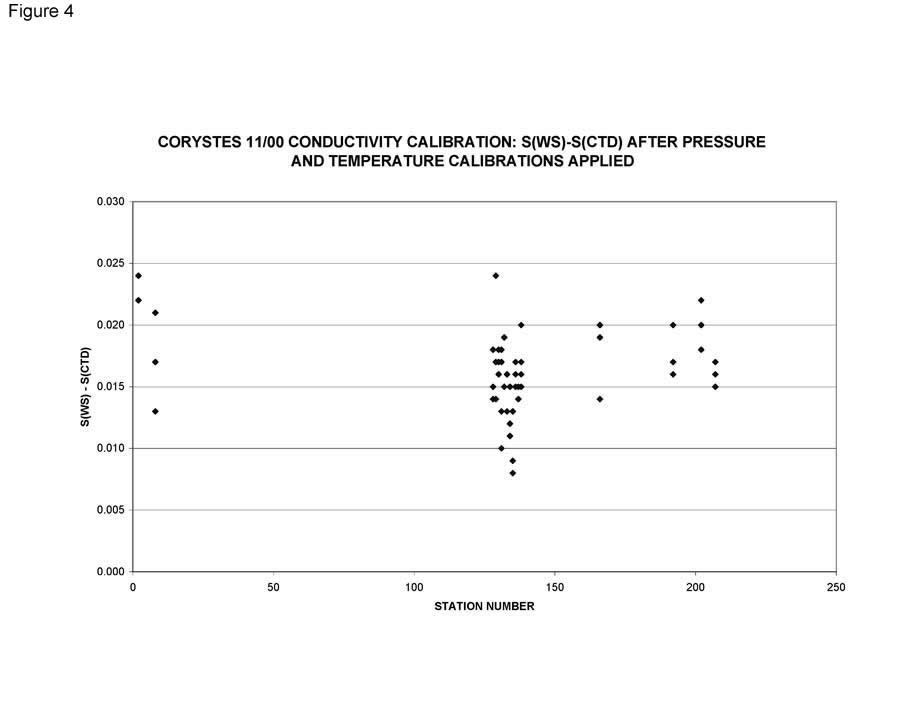
The difference between salinometer and CTD salinity before any corrections are applied to the sensors is plotted in Figure 3. The CTD salinity is an under-estimate with a mean difference of 0.016. This offset remains after the pressure and temperature calibrations have been applied, standard deviation 0.004, as shown in Figure 4.
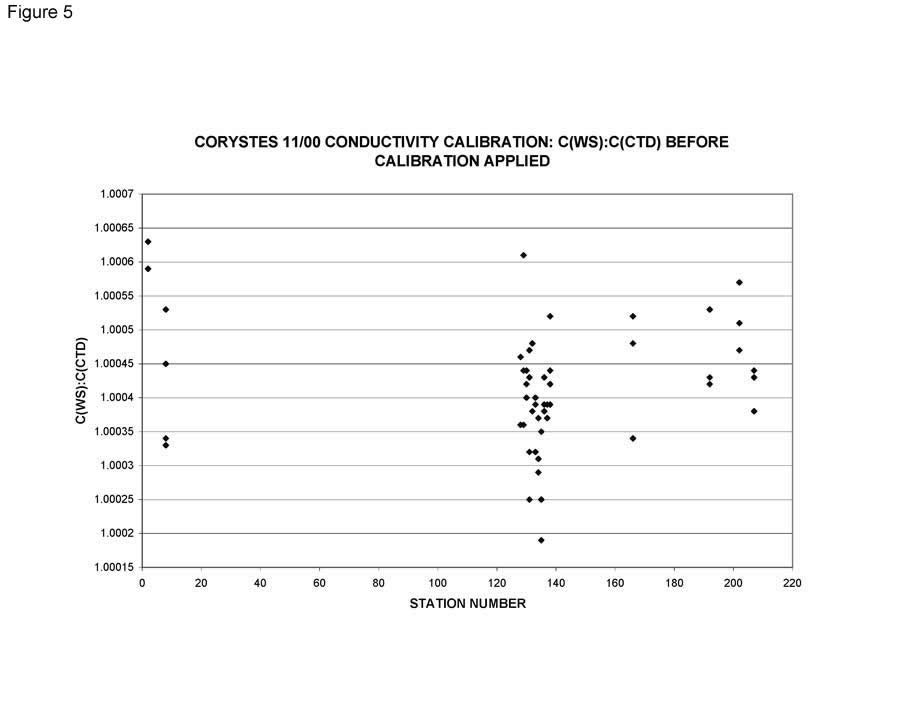
Figure 5 shows conductivity ratio(water samples): conductivity ratio(CTD), the water sample conductivity ratio being that from the salinometer salinity at the corrected pressure and temperature given by the CTD. The CTD conductivity is being under-estimated.
To compensate for this a least square fit was used to determine appropriate calibration coefficients:
CR(cor) = CR(ctd) [a*T(cor) + b*P(cor) + c]
where T(cor) and P(cor) are the corrected CTD temperature and pressure and
a = 1.4919037e-5, b = -2.0703639e-6, c = 1.0001509
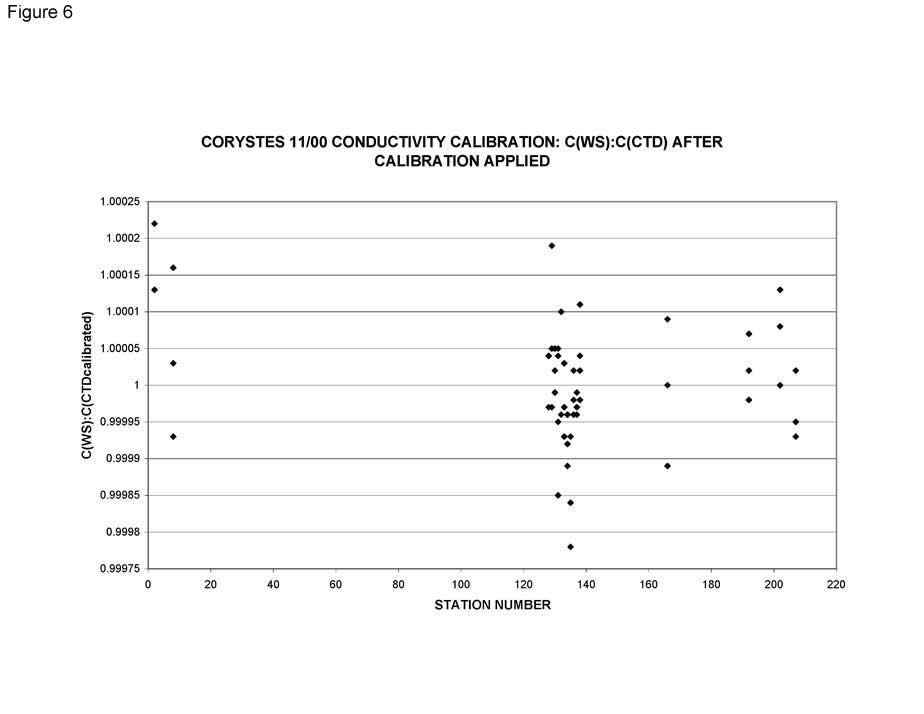
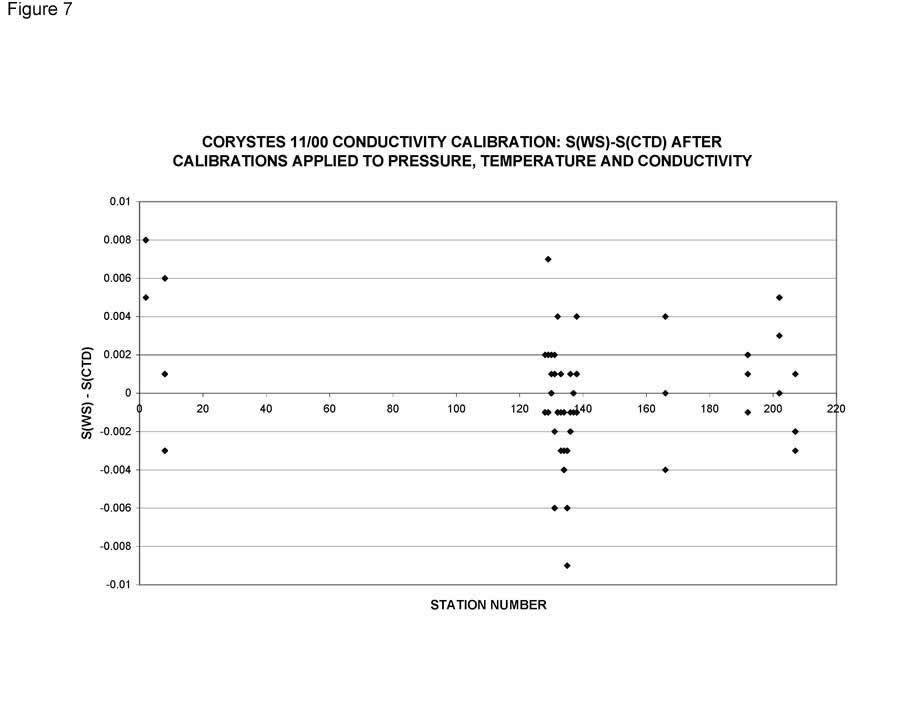
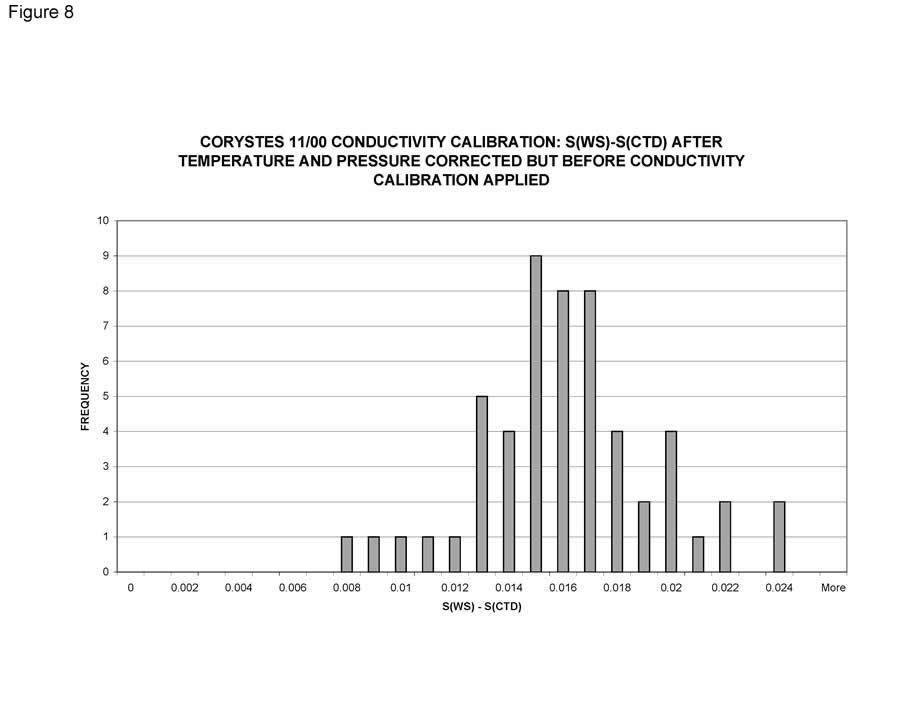
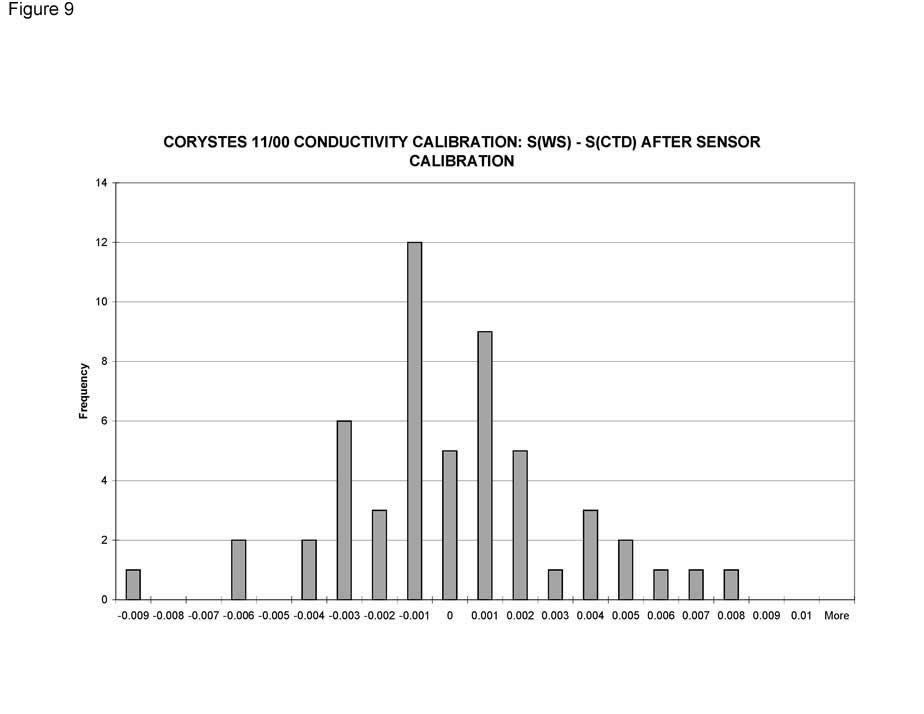
Using these coefficients the rms difference between water sample (salinometer) and corrected CTD salinity is 0.003 for 54 samples. Figures 6, 7, 8 and 9 show how effective these coefficients are in correcting the CTD salinity. The histograms of Figures 8 and 9 show the differences before and after the application of the conductivity coefficients. The former histogram shows the differences after temperature and pressure have been corrected; the latter histogram after these and the conductivity calibration has been used. If it assumed that the CTD is accurate to 0.01 and the salinometer to 0.003 then differences of +/-0.013 are acceptable. In this instance all differences are within +/-0.013.
Suspended Load -LSS/ Turbidity Sensor
The LSS/ turbidity sensor (s/n 243) was calibrated by comparing recorded voltages with samples collected (during ascent of the CTD) for suspended load analysis. The usual procedure would have entailed dividing the data into two groups to accommodate the two different geographical areas - the Dogger Bank and the A1221 stations further south. But because the spm levels were so low at the former it was not possible to obtain a meaningful calibration at these stations. The samples from all stations have been grouped to derive a calibration of the LSS:
suspended load (mg/l) = a * LSS(volts) + b
where
a = 1.6458,b = 0.4775 N=46, R = 0.92
Users should be aware that despite the good calibration the turbidity profiles are noisy compared with those from earlier cruises, noise in the turbidity and fluorometer channels being a problem on all cruises this year, other than Corystes 1/2000. SPM profiles at stations 2, 192 and 202 are very noisy.
Fluorometer - Chlorophyll Calibration
A Seapoint fluorometer (s/n 2289) was fitted to the rosette sampler and used to estimate chlorophyll levels. Usually the sensor is calibrated by comparing recorded voltages with measured chlorophyll of samples collected in Niskin bottles as the CTD returns to the surface. In this instance the logged data was much noisier during ascent compared to descent and the calibration was achieved by a linear correlation of sample chlorophyll and fluorometer voltages during descent at the depth the sample was collected. Computing calibrations for each of the A1221 and A1219 areas was not successful and individual calibrations were derived for each station. Nominally eight samples were collected at each A1219 station, three at each A1221 station.
Chlorophyll = a*Fluorometer volts - b
Where a and b are :
| Station no. | a | b | R |
|---|---|---|---|
| 2 | 4.025 | -1.3485 | 0.96 |
| 8 | 1.1626 | 0.4196 | 0.87 |
| 128 | 1.4104 | 0.0555 | 0.99 |
| 129 | 1.3195 | 0.1801 | 0.86 |
| 130 | 1.7663 | 0.0957 | 0.95 |
| 131 | 1.0812 | 0.2474 | 0.96 |
| 132 | 1.7167 | 0.2301 | 0.88 |
| 133 | 1.5975 | 0.4252 | 0.91 |
| 134 | 2.0392 | -0.0050 | 0.89 |
| 135 | 1.5367 | 0.1523 | 0.93 |
| 136 | 1.7466 | -0.1393 | 0.91 |
| 137 | 1.2821 | 0.0440 | 0.98 |
| 138 | 1.4011 | 0.0750 | 0.98 |
| 166 | 2.0846 | -0.1500 | 0.99 |
| 192 | 4.025 | -1.3485 | 0.96 |
| 202 | 1.180 | 0.0 | N/A |
| 207 | 4.025 | -1.3485 | 0.96 |
The profiles of chlorophyll are noisier than usual, those at A1221stations 2, 192, 202 and 207 being especially poor.
Photosynthetically Active Radiation
The LICOR light sensor (s/n 5672) used to measure photosynthetically active radiation was calibrated on 26th May 1999, using a standard lamp. This gave an in-air current of 0.826 microAmp per 217.1 micromolesm-2s-1, equivalent to 0.3469 micromolesm-2s-1 per nanoAmp in water.
Ken Medler
10/11/2000
General Data Screening carried out by BODC
BODC screen both the series header qualifying information and the parameter values in the data cycles themselves.
Header information is inspected for:
- Irregularities such as unfeasible values
- Inconsistencies between related information, for example:
- Times for instrument deployment and for start/end of data series
- Length of record and the number of data cycles/cycle interval
- Parameters expected and the parameters actually present in the data cycles
- Originator's comments on meter/mooring performance and data quality
Documents are written by BODC highlighting irregularities which cannot be resolved.
Data cycles are inspected using time or depth series plots of all parameters. Currents are additionally inspected using vector scatter plots and time series plots of North and East velocity components. These presentations undergo intrinsic and extrinsic screening to detect infeasible values within the data cycles themselves and inconsistencies as seen when comparing characteristics of adjacent data sets displaced with respect to depth, position or time. Values suspected of being of non-oceanographic origin may be tagged with the BODC flag denoting suspect value; the data values will not be altered.
The following types of irregularity, each relying on visual detection in the plot, are amongst those which may be flagged as suspect:
- Spurious data at the start or end of the record.
- Obvious spikes occurring in periods free from meteorological disturbance.
- A sequence of constant values in consecutive data cycles.
If a large percentage of the data is affected by irregularities then a Problem Report will be written rather than flagging the individual suspect values. Problem Reports are also used to highlight irregularities seen in the graphical data presentations.
Inconsistencies between the characteristics of the data set and those of its neighbours are sought and, where necessary, documented. This covers inconsistencies such as the following:
- Maximum and minimum values of parameters (spikes excluded).
- The occurrence of meteorological events.
This intrinsic and extrinsic screening of the parameter values seeks to confirm the qualifying information and the source laboratory's comments on the series. In screening and collating information, every care is taken to ensure that errors of BODC making are not introduced.
Project Information
No Project Information held for the Series
Data Activity or Cruise Information
Cruise
| Cruise Name | COR11/00 |
| Departure Date | 2000-08-15 |
| Arrival Date | 2000-08-31 |
| Principal Scientist(s) | Juan Brown (Centre for Environment, Fisheries and Aquaculture Science Lowestoft Laboratory) |
| Ship | RV Corystes |
Complete Cruise Metadata Report is available here
Fixed Station Information
No Fixed Station Information held for the Series
BODC Quality Control Flags
The following single character qualifying flags may be associated with one or more individual parameters with a data cycle:
| Flag | Description |
|---|---|
| Blank | Unqualified |
| < | Below detection limit |
| > | In excess of quoted value |
| A | Taxonomic flag for affinis (aff.) |
| B | Beginning of CTD Down/Up Cast |
| C | Taxonomic flag for confer (cf.) |
| D | Thermometric depth |
| E | End of CTD Down/Up Cast |
| G | Non-taxonomic biological characteristic uncertainty |
| H | Extrapolated value |
| I | Taxonomic flag for single species (sp.) |
| K | Improbable value - unknown quality control source |
| L | Improbable value - originator's quality control |
| M | Improbable value - BODC quality control |
| N | Null value |
| O | Improbable value - user quality control |
| P | Trace/calm |
| Q | Indeterminate |
| R | Replacement value |
| S | Estimated value |
| T | Interpolated value |
| U | Uncalibrated |
| W | Control value |
| X | Excessive difference |
SeaDataNet Quality Control Flags
The following single character qualifying flags may be associated with one or more individual parameters with a data cycle:
| Flag | Description |
|---|---|
| 0 | no quality control |
| 1 | good value |
| 2 | probably good value |
| 3 | probably bad value |
| 4 | bad value |
| 5 | changed value |
| 6 | value below detection |
| 7 | value in excess |
| 8 | interpolated value |
| 9 | missing value |
| A | value phenomenon uncertain |
| B | nominal value |
| Q | value below limit of quantification |
