Metadata Report for BODC Series Reference Number 599083
Metadata Summary
Problem Reports
Data Access Policy
Narrative Documents
Project Information
Data Activity or Cruise Information
Fixed Station Information
BODC Quality Flags
SeaDataNet Quality Flags
Metadata Summary
Data Description |
|||||||||||||||||||||||||||||||||
|
|||||||||||||||||||||||||||||||||
Data Identifiers |
|||||||||||||||||||||||||||||||||
|
|||||||||||||||||||||||||||||||||
Time Co-ordinates(UT) |
|||||||||||||||||||||||||||||||||
|
|||||||||||||||||||||||||||||||||
Spatial Co-ordinates | |||||||||||||||||||||||||||||||||
|
|||||||||||||||||||||||||||||||||
Parameters |
|||||||||||||||||||||||||||||||||
|
|||||||||||||||||||||||||||||||||
|
|||||||||||||||||||||||||||||||||
Problem Reports
In the salinity channel there are large spikes and null values that have been flagged on the thermocline. This could be due to a mismatch between the conductivity cell and the thermistor.
Data Access Policy
Open Data
These data have no specific confidentiality restrictions for users. However, users must acknowledge data sources as it is not ethical to publish data without proper attribution. Any publication or other output resulting from usage of the data should include an acknowledgment.
If the Information Provider does not provide a specific attribution statement, or if you are using Information from several Information Providers and multiple attributions are not practical in your product or application, you may consider using the following:
"Contains public sector information licensed under the Open Government Licence v1.0."
Narrative Documents
Falmouth Scientific Integrated CTD (ICTD) Profiler
The FSI ICTD is designed to collect high precision conductivity, temperature and pressure data with self calibrating electronics. This instrument can support five primary sensors (including up to three temperature sensors) and can be coupled with a water bottle sampler. The ICTD is equipped with a titanium housing rated to 7000 m and has a sampling rate of 32 Hz.
Three temperature sensors are available: primary platinum, redundant platinum and exposed thermistor. Any combination of these can be used in the primary channels. The instrument also has multiple RS-232 serial inputs for a variety of sensors including: ADCP, Benthos PSA-916 Altimeter and WetLabs SAFire. There are an additional eight DC input channels that can support virtually any sensor that has a DC output.
Specifications:
| Parameter | Conductivity | Temperature | Pressure |
| Sensor | Inductive cell | Platinum thermometer | Precision-machined Silicon |
| Range | 0 to 70 mS cm-1 | -2 to 35°C | Customer specified |
| Accuracy | ±0.002 mS cm-1 | 0.002°C | ±0.01 % full scale |
| Resolution | 0.0001 mS cm-1 | 0.00005°C | 0.0004 % full scale |
| Response | 5.0 cm at 1 ms-1 | 150 ms Platinum 20 ms Thermistor* | 25 ms |
*Optional
Further details can be found in the manufacturer's specification sheet.
Dr Haardt BackScat I fluorometer
The Dr Haardt BackScat I is a backscatter fluorometer designed to detect concentrations of a variety of substances in the water column. The instrument uses a Xe-flashlight source and exhibits a fast response and low power consumption. Integrated turbidity and other sensors are available and the instrument has a titanium housing rated to a maximum depth of 6000 m.
Each fluorometer is custom-built to measure substances of interest. Available spectral ranges are visible, UV I and UV II. A range of filter units are available for the measurement of chlorophyll-a, phycoerythrin, humic acids, aromatic hydrocarbons, phenol, oils, rhodamine B, sulforhodamine, fluorescein, eosin, pyranin and naphthionate.
LI-COR LI-192 Underwater Quantum Sensor
The LI-192 Underwater Quantum Sensor is used to measure photosynthetic photon flux density and is cosine corrected. The sensor is often referred to as LI-192SA or LI-192SB (the LI-192SB model was superseded by LI-192SA). One of the main differences is that the LI-192SA model includes a built-in voltage output for interfacing with NexSens iSIC and SDL data loggers.
Sensor specifications, current at January 2012, are given in the table below. More information can be found in the manufacturer's LI-192SA andLI-192SB specification sheets.
Sensor Specifications
(Specifications apply to both models unless otherwise stated)
| Absolute Calibration | ± 5 % in air traceable to NBS. |
|---|---|
| Sensitivity | Typically 3 µA per 1000 µmol s-1 m-2 for LI-192SB and 4 µA per 1000 µmol s-1 m-2 for LI-192SA in water. |
| Linearity | Maximum deviation of 1 % up to 10,000 µmol s-1 m-2. |
| Stability | < ± 2 % change over a 1 year period. |
| Response Time | 10 µs. |
| Temperature Dependence | ± 0.15 % per °C maximum. |
| Cosine Correction | Optimized for both underwater and atmospheric use. |
| Azimuth | < ± 1 % error over 360 ° at 45 ° elevation. |
| Detector | High stability silicon photovoltaic detector (blue enhanced). |
| Sensor Housing | Corrosion resistant metal with acrylic diffuser for both saltwater and freshwater applications. Waterproof to withstand 800 psi (5500 kPa) (560 meters). |
RV Corystes Cruise 9/97 CTD Data Documentation
Twenty five CTD profiles were obtained using a FSI ICTD (s/n 1366) during this cruise to the North Sea; see Figure 1a.
Samples were collected for salinity analysis to derive a calibration for the instrument conductivity sensor. A fluorometer, a light scattering sensor (lss) and a photosynthetically active radiation sensor was fitted to the rosette. Chlorophyll samples were collected in order to calibrate the fluorometer and samples for suspended load analysis were used to calibrate the lss.
Salinity
Samples for salinity analysis on the Laboratory's Guildline salinometer were collected at every station. Duplicate samples were drawn on eight occasions and their differences were as follows:
| Difference | No. | Accumulative % |
|---|---|---|
| 0.000 | 6 | 75 |
| 0.001 | 2 | 100 |
CTD Sensor Calibration
(a) Pressure
The pressure sensor was calibrated using a dead-weight tester before the cruise on 24/8/97. This suggested that a correction of -0.4dbar was required at an atmospheric pressure of 1020mb. During the cruise the 'on deck' CTD pressure was recorded and this consistently indicated that the sensor was reading too high by 0.5 dbar, in good agreement wth the laboratory calibration, and this was used to correct the pressure estimates:
ie P(cor) =P(unc) + dP where dP = -0.5 dbar
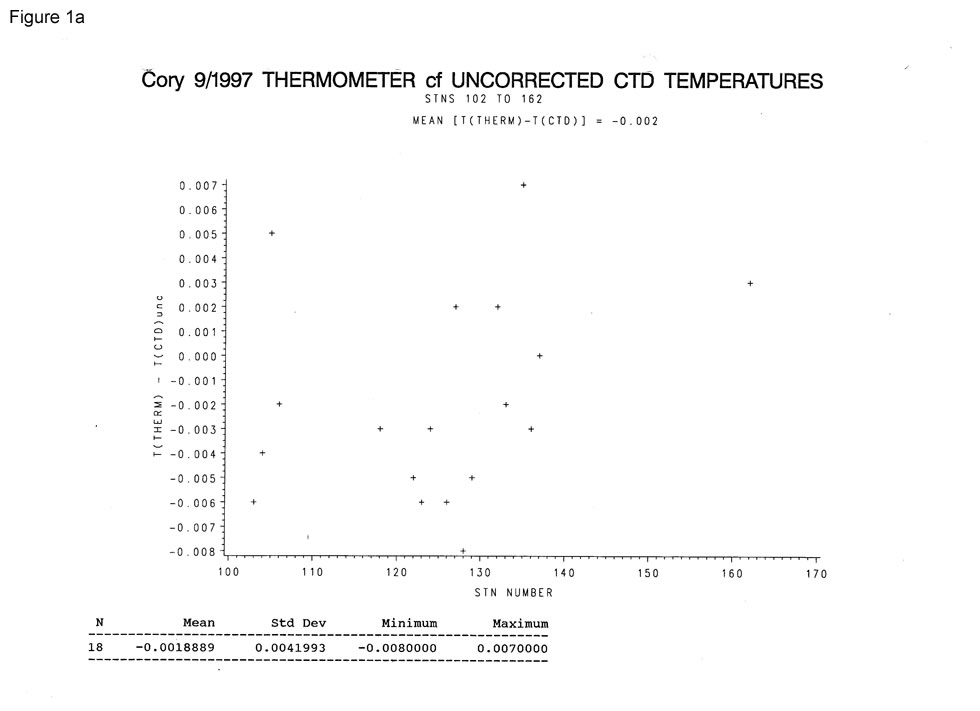
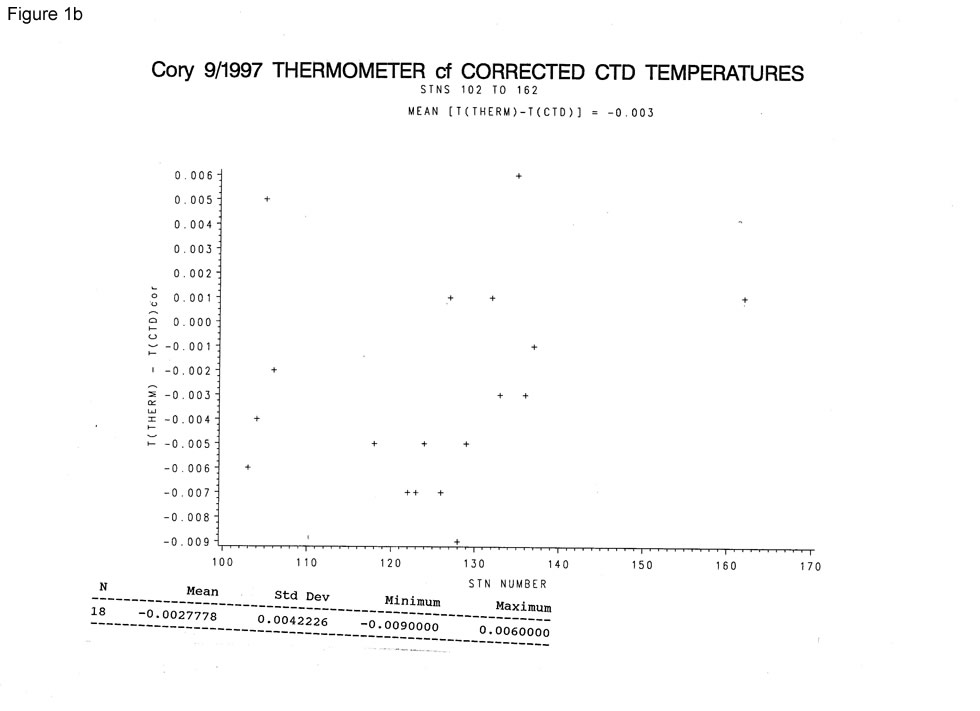
(b) Temperature
Both fast (thermistor) and slow (prt) temperature sensors fitted to the CTD were calibrated using PRT's on 14/08/1997 and this was used to correct the CTD temperature :
T(cor) = T(unc) + dT
dT = a*T(unc)*T(unc) + b*T(unc) + c
where
slow sensor a=1.24903e-5, b=-6.1416e-4, c=5.902e-3
fast sensor a=8.67344e-5, b=-2.6642e-3, c=2.062e-2
These are equivalent to corrections of the slow sensor (prt) used in processing of the CTD profiles of 0.002 at 7 degC and -0.001 at 18 degC.
One pair of electronic thermometers were fitted to one Niskin bottle. The differences between the thermometers and CTD are plotted in Figures 1(a) and 1(b). It appears that the differences are marginally larger after the CTD temperatures have been corrected, but the difference is not significant, being well within the tolerances of the two sensors (0.005 degC for the thermometers).
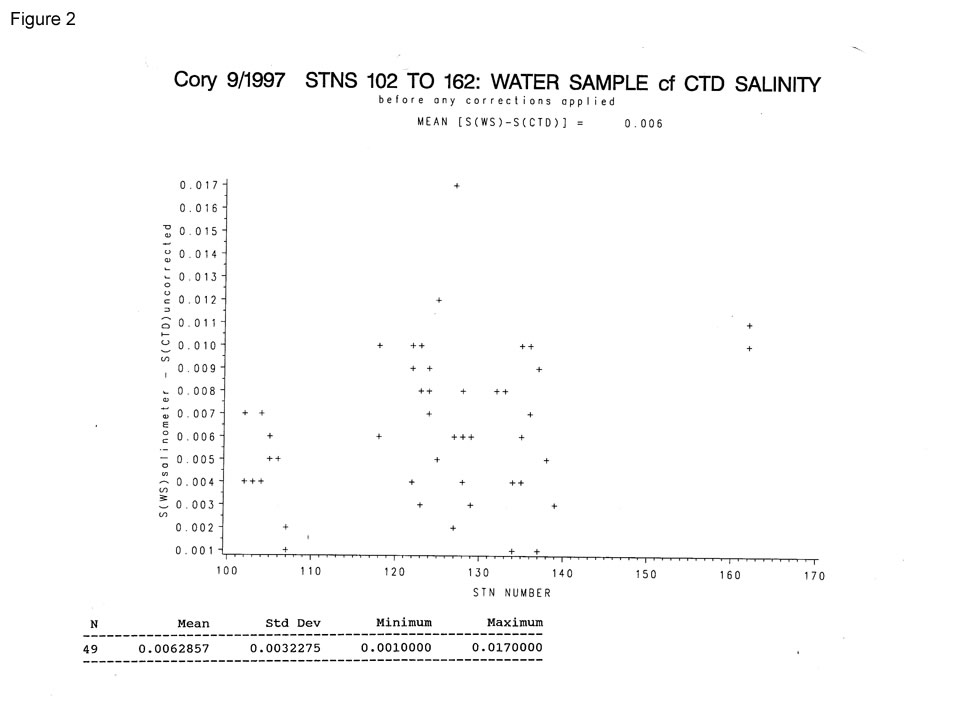
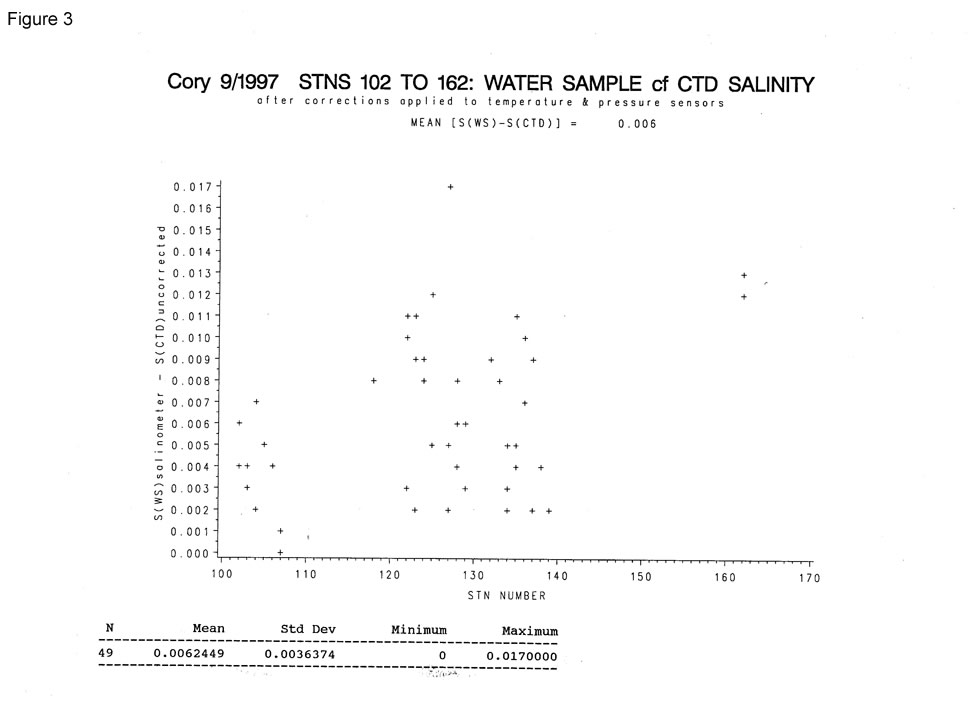
(c) Conductivity
The difference between salinometer and CTD salinity before any corrections are applied to the sensors is plotted in Figure 2. The mean difference (0.006) remains unchanged after the pressure and temperature calibrations have been applied, standard deviation 0.004, as plotted in Figure 3.
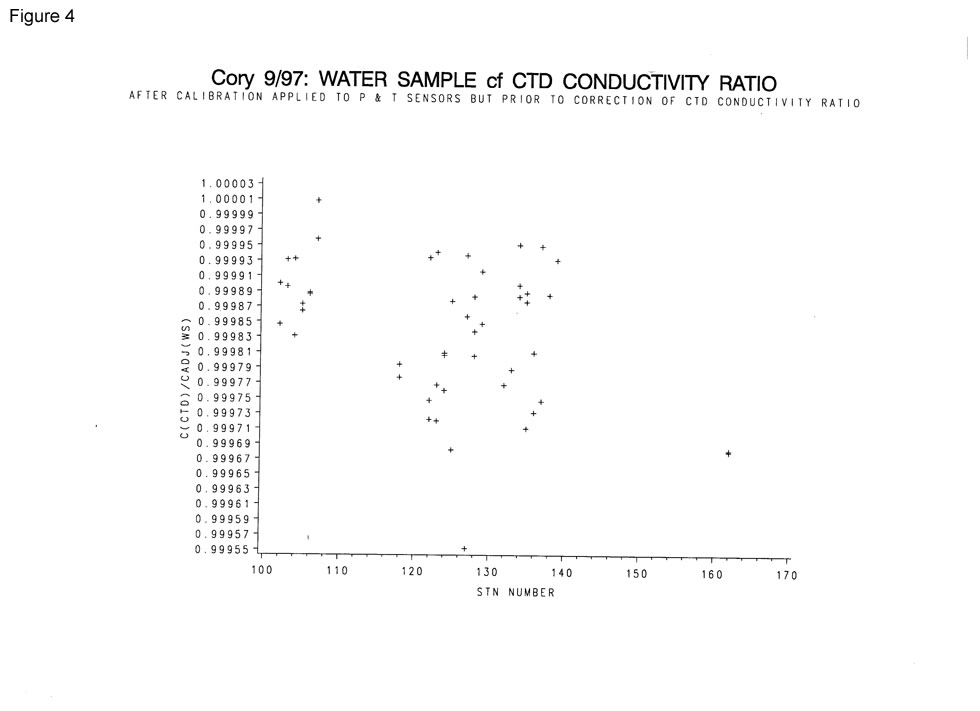
Figure 4 shows conductivity ratio(CTD): conductivity ratio(water samples), the water sample conductivity ratio being that from the salinometer salinity at the corrected pressure and temperature given by the CTD. The CTD conductivity is clearly being under-estimated. To compensate for this a least square fit was used to determine appropriate calibration coefficients:
CR(cor) = CR(ctd) [a*T(cor) + b*P(cor) + c]
where T(cor) and P(cor) are the corrected CTD temperature and pressure and
a = -2.26026e-5, b = -1.17684e-6, c = 1.000490
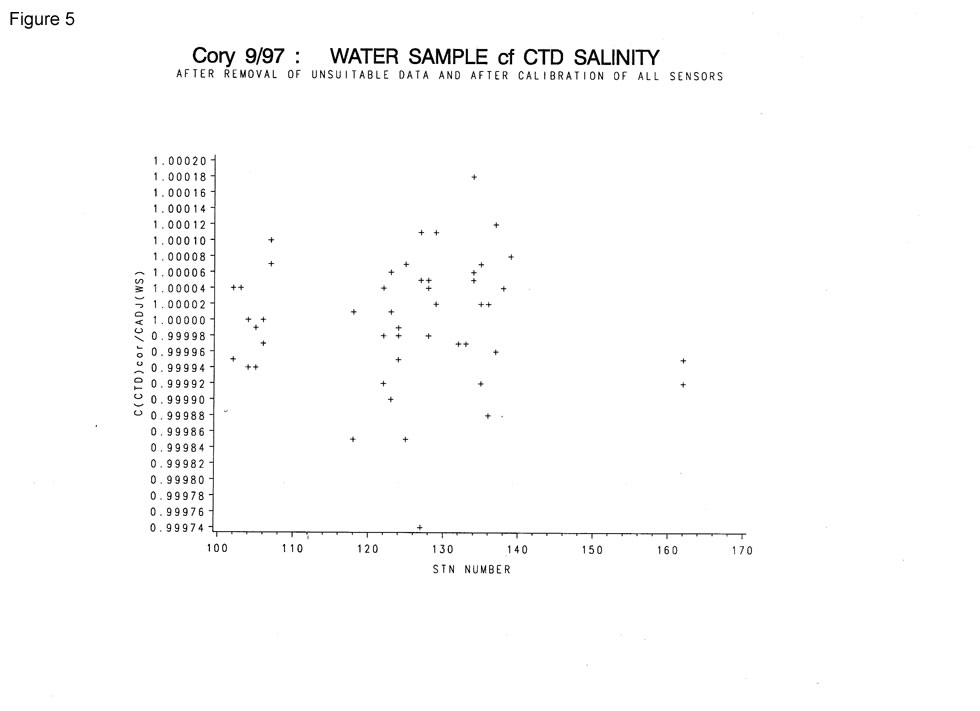
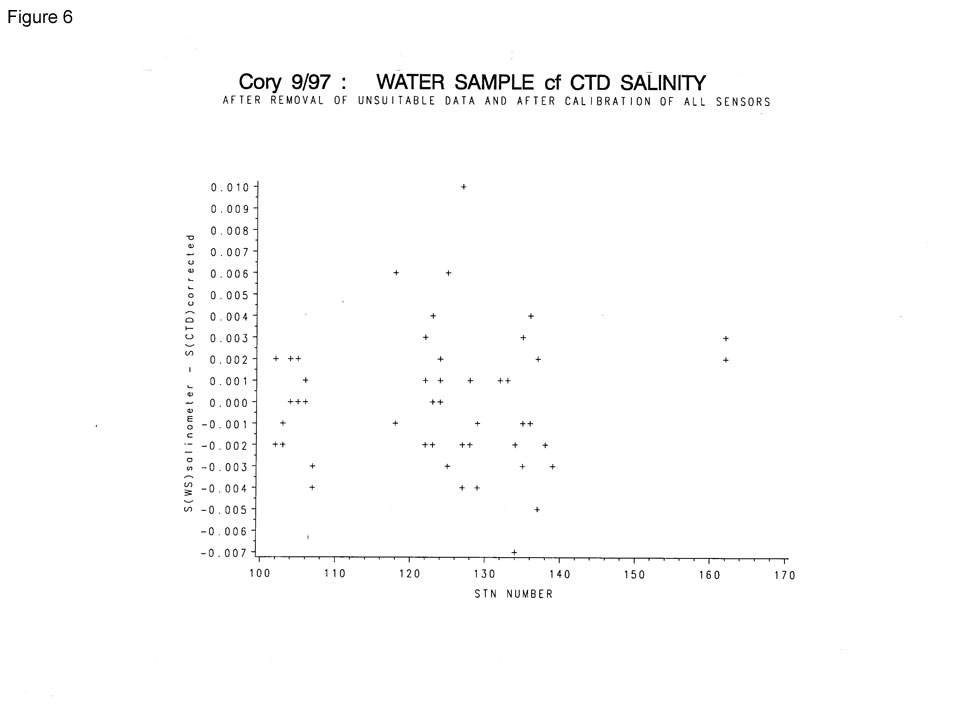
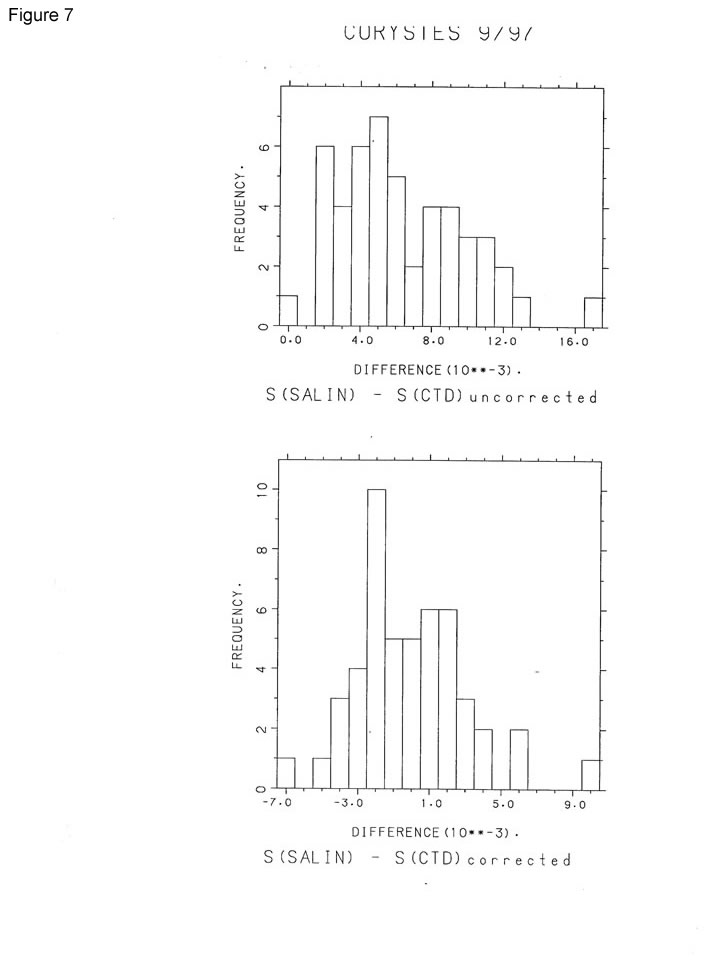
Using these coefficients the rms difference between water sample (salinometer) and corrected CTD salinity is 0.003 for 49 samples. Figures 5, 6 and 7 show how effective these coefficients are in correcting the CTD salinity. The histograms of Figure 7 show the differences before and after the application of these conductivity coefficients. The upper histogram shows the differences after temperature and pressure have been corrected; the bottom histogram after these and the conductivity calibration has been used. If it assumed that the CTD is accurate to 0.01 and the salinometer to 0.006 then differences of +/-0.016 are acceptable. In this instance all difference are within +/-0.013 suggesting that these tolerances may be over-estimated.
Suspended Load Estimates Corystes 9/1997
The light scattering sensor used to measure seawater turbidity was calibrated by comparing recorded voltage with samples collected ( during ascent of the CTD) for suspended load analysis. The calibration coefficients derived apply to all profiles collected during the cruise.
suspended load (mg/l) = a * lss(volts) + b
where a = 5.006, b = 0.534 N=68, R= 0.97, rmse = 0.4
Fluorometer - Chlorophyll Calibration
A Dr Haart fluorometer was fitted to the rosette sampler and used to estimate chlorophyll levels. The sensor was calibrated by comparing recorded voltages when samples for chlorophyll analysis were collected. A least square fit of sample chlorophyll, Chl (ug/l), to fluorometer voltage, V, indicated that
Chl = 1.989 * V - 0.307 N=63, R= 0.93, rmse= 0.3
Ken Medler
7th November 1997
General Data Screening carried out by BODC
BODC screen both the series header qualifying information and the parameter values in the data cycles themselves.
Header information is inspected for:
- Irregularities such as unfeasible values
- Inconsistencies between related information, for example:
- Times for instrument deployment and for start/end of data series
- Length of record and the number of data cycles/cycle interval
- Parameters expected and the parameters actually present in the data cycles
- Originator's comments on meter/mooring performance and data quality
Documents are written by BODC highlighting irregularities which cannot be resolved.
Data cycles are inspected using time or depth series plots of all parameters. Currents are additionally inspected using vector scatter plots and time series plots of North and East velocity components. These presentations undergo intrinsic and extrinsic screening to detect infeasible values within the data cycles themselves and inconsistencies as seen when comparing characteristics of adjacent data sets displaced with respect to depth, position or time. Values suspected of being of non-oceanographic origin may be tagged with the BODC flag denoting suspect value; the data values will not be altered.
The following types of irregularity, each relying on visual detection in the plot, are amongst those which may be flagged as suspect:
- Spurious data at the start or end of the record.
- Obvious spikes occurring in periods free from meteorological disturbance.
- A sequence of constant values in consecutive data cycles.
If a large percentage of the data is affected by irregularities then a Problem Report will be written rather than flagging the individual suspect values. Problem Reports are also used to highlight irregularities seen in the graphical data presentations.
Inconsistencies between the characteristics of the data set and those of its neighbours are sought and, where necessary, documented. This covers inconsistencies such as the following:
- Maximum and minimum values of parameters (spikes excluded).
- The occurrence of meteorological events.
This intrinsic and extrinsic screening of the parameter values seeks to confirm the qualifying information and the source laboratory's comments on the series. In screening and collating information, every care is taken to ensure that errors of BODC making are not introduced.
Project Information
No Project Information held for the Series
Data Activity or Cruise Information
Cruise
| Cruise Name | COR9/97 |
| Departure Date | 1997-08-22 |
| Arrival Date | 1997-09-03 |
| Principal Scientist(s) | Juan Brown (Centre for Environment, Fisheries and Aquaculture Science Lowestoft Laboratory) |
| Ship | RV Corystes |
Complete Cruise Metadata Report is available here
Fixed Station Information
No Fixed Station Information held for the Series
BODC Quality Control Flags
The following single character qualifying flags may be associated with one or more individual parameters with a data cycle:
| Flag | Description |
|---|---|
| Blank | Unqualified |
| < | Below detection limit |
| > | In excess of quoted value |
| A | Taxonomic flag for affinis (aff.) |
| B | Beginning of CTD Down/Up Cast |
| C | Taxonomic flag for confer (cf.) |
| D | Thermometric depth |
| E | End of CTD Down/Up Cast |
| G | Non-taxonomic biological characteristic uncertainty |
| H | Extrapolated value |
| I | Taxonomic flag for single species (sp.) |
| K | Improbable value - unknown quality control source |
| L | Improbable value - originator's quality control |
| M | Improbable value - BODC quality control |
| N | Null value |
| O | Improbable value - user quality control |
| P | Trace/calm |
| Q | Indeterminate |
| R | Replacement value |
| S | Estimated value |
| T | Interpolated value |
| U | Uncalibrated |
| W | Control value |
| X | Excessive difference |
SeaDataNet Quality Control Flags
The following single character qualifying flags may be associated with one or more individual parameters with a data cycle:
| Flag | Description |
|---|---|
| 0 | no quality control |
| 1 | good value |
| 2 | probably good value |
| 3 | probably bad value |
| 4 | bad value |
| 5 | changed value |
| 6 | value below detection |
| 7 | value in excess |
| 8 | interpolated value |
| 9 | missing value |
| A | value phenomenon uncertain |
| B | nominal value |
| Q | value below limit of quantification |
