Metadata Report for BODC Series Reference Number 600669
Metadata Summary
Problem Reports
Data Access Policy
Narrative Documents
Project Information
Data Activity or Cruise Information
Fixed Station Information
BODC Quality Flags
SeaDataNet Quality Flags
Metadata Summary
Data Description |
|||||||||||||||||||||||||
|
|||||||||||||||||||||||||
Data Identifiers |
|||||||||||||||||||||||||
|
|||||||||||||||||||||||||
Time Co-ordinates(UT) |
|||||||||||||||||||||||||
|
|||||||||||||||||||||||||
Spatial Co-ordinates | |||||||||||||||||||||||||
|
|||||||||||||||||||||||||
Parameters |
|||||||||||||||||||||||||
|
|||||||||||||||||||||||||
|
|||||||||||||||||||||||||
Problem Reports
No Problem Report Found in the Database
Data Access Policy
Open Data
These data have no specific confidentiality restrictions for users. However, users must acknowledge data sources as it is not ethical to publish data without proper attribution. Any publication or other output resulting from usage of the data should include an acknowledgment.
If the Information Provider does not provide a specific attribution statement, or if you are using Information from several Information Providers and multiple attributions are not practical in your product or application, you may consider using the following:
"Contains public sector information licensed under the Open Government Licence v1.0."
Narrative Documents
Guildline 8705 CTD
The 8705 CTD is a conductivity-temperature-pressure profiler designed for marine applications down to depths of 6000 m. The instrument includes an anodised aluminium tube with a steel cage to protect the temperature and conductivity sensors and a urethane cap to protect the pressure sensor.
Specifications
| Parameter | Range | Accuracy | Resolution | Stability | Response time |
|---|---|---|---|---|---|
| Pressure | 0 to 6000 dbar | ± 0.15% of full range | ± 0.01% of full range | - | < 50 ms |
| Temperature | -2 to 30 °C | ± 0.005 °C | ± 0.0005 °C | ± 0.002 °C over 30 days ± 0.0025°C over 6 months | < 50 ms |
| Conductivity * | 100 ppm to 40 ppt | ± 0.005 ppt | ± 0.001 ppt | ± 0.002 ppt over 6 months | < 50 ms |
* Conductivity specifications are given in terms of equivalent salinity
Further details can be found in the manufacturer's specification sheet.
RV Corystes Cruise 13/94 CTD Data Documentation
Stations 10-197
For this cruise the Guildline CTD (s/n 45056) was used. The following is a presentation of the data from all stations. One hundred and fifty-seven CTD profiles were obtained on this cruise. One mercury- in-glass and one electronic reversing thermometer were used to measure water temperature and samples were collected for later salinity analysis. In addition samples were taken for analysis of a standard range of nutrients and for suspended load measurements.
1. THERMOMETER DATA
Pairs of thermometer readings were available on 136 stations. Thirty-one were removed because the differences between them were too high (>0.03°C). The distribution of the remaining pairs is:
| Difference °C | No. | Cumulative % |
|---|---|---|
| 0.000-0.010 | 86 | 82 |
| 0.011-0.020 | 16 | 97 |
| 0.021-0.030 | 3 | 100 |
2. SALINITY DATA
Water samples were taken on all stations for later analysis. Twenty-nine pairs of duplicate samples were taken. The distribution of their differences is:
| Difference °C | No. | Cumulative % |
|---|---|---|
| 0.000 | 20 | 69 |
| 0.001-0.006 | 9 | 100 |
3. SENSOR CALIBRATION FOR GUILDLINE CTD
a) Pressure
The laboratory calibration of November 1994 with the sensor at 12°C was used to correct the pressure sensor: Pcor=Pctd - 1.6db
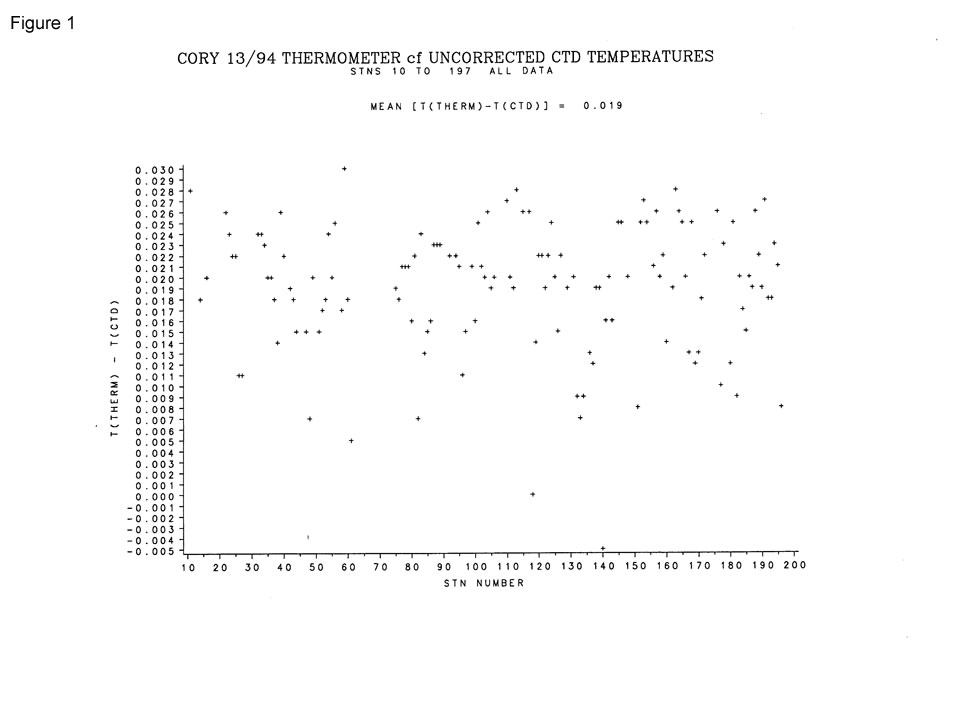
b) Temperature
Figure 1 shows the differences between the mean thermometer and uncorrected CTD temperatures. The 134 points plotted give a mean difference of 0.019°C. The sensor was corrected using the laboratory calibration coefficients of November 1994 where:
Tcor=Tctd+ 0.013
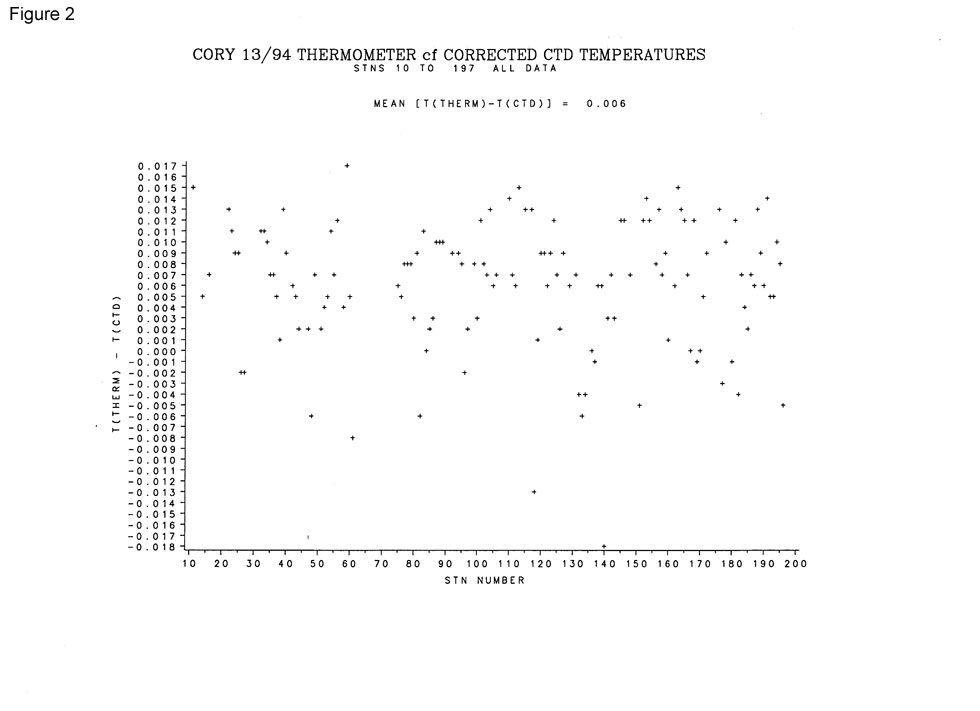
Figure 2 shows the differences between the means of pairs of thermometer readings and the CTD temperature data after the latter have been corrected. The mean difference is 0.006°C and all lie within 0.035°C.
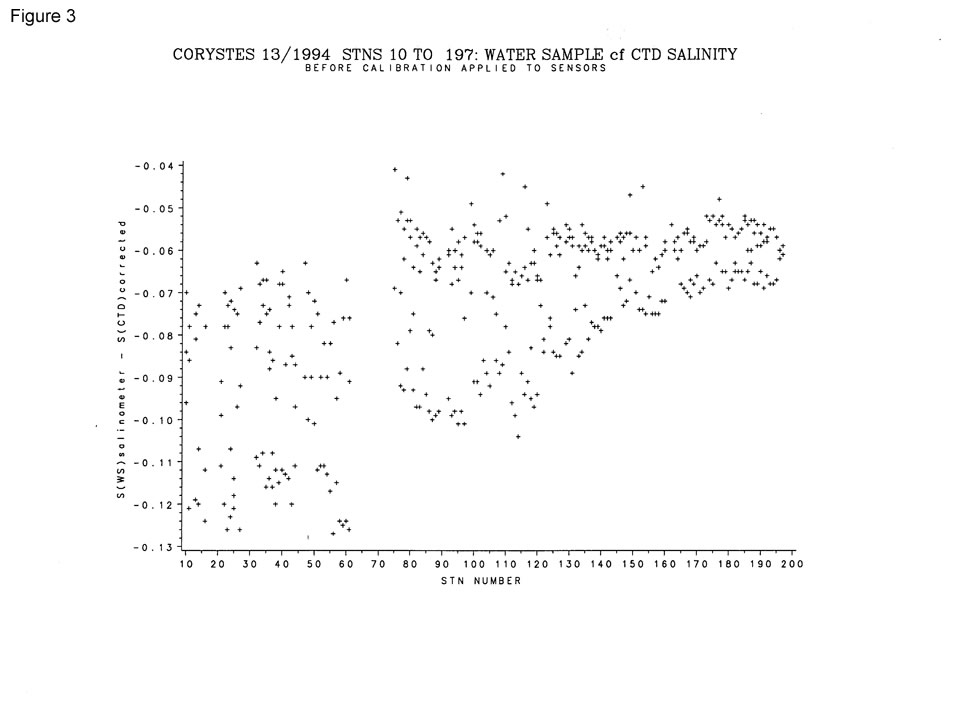
c) Salinity
Figure 3 shows the difference between the water sample salinity as measured with the salinometer and that derived from the CTD before any calibrations have been applied to the latter. It suggests that the data fall into two populations, from station 10 to 61 and from 75 to 197. For both data sets there is a tendency by the CTD to over estimate salinity.
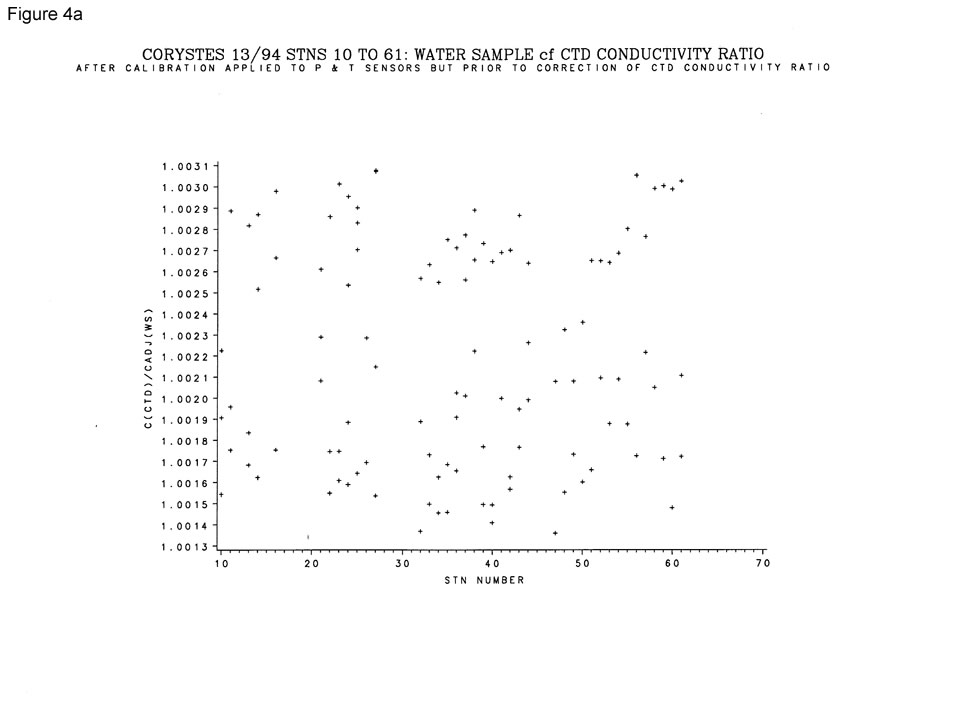
i) Stations 10 - 61
Figure 4a shows the ratio of CTD conductivity to water sample conductivity after the CTD pressure and temperature had been corrected using the coefficients in 3a) and 3b) above.
For these data coefficients have been derived to calibrate the CTD conductivity sensor using a least square fit between the ratio of water sample conductivity to CTD conductivity and the CTD temperature and pressure. CR(cor) = CR(ctd)*{a*T(cor) + b*P(cor) + c}
where T(cor) and P(cor) are the corrected CTD temperature and pressure and where:
a = -0.692935549E-04, b = 0.990463898E-05, c = 0.998276123E+00
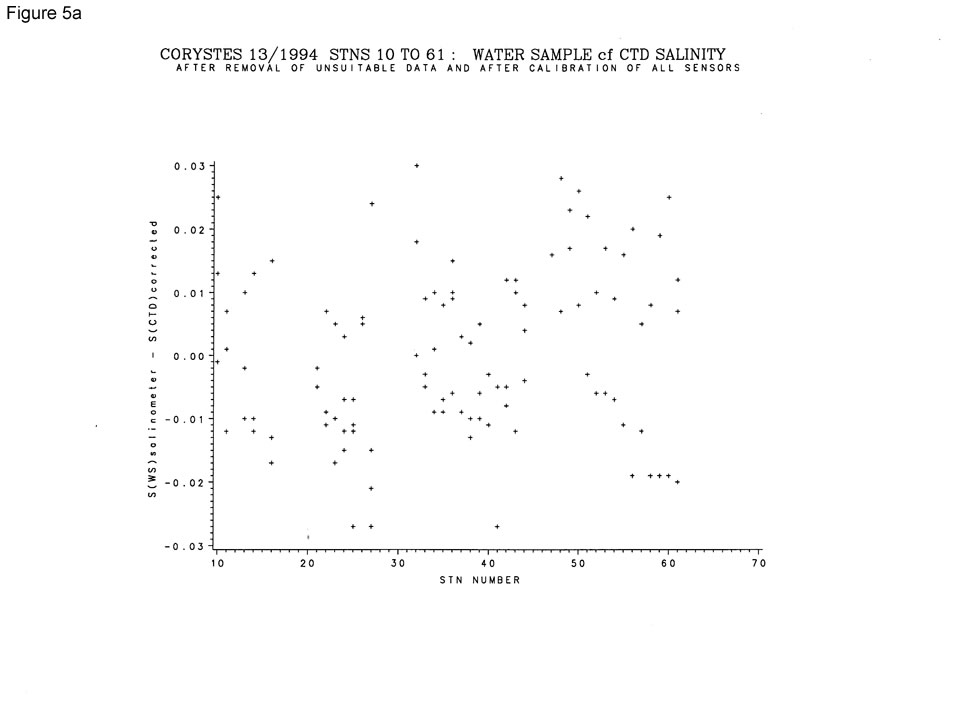
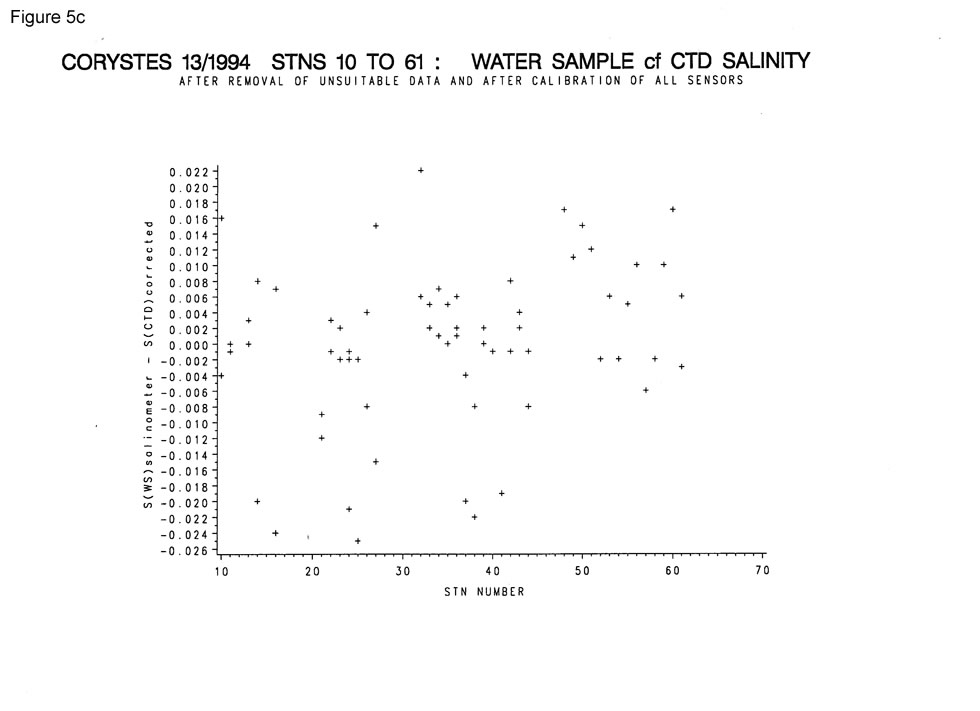
RMS salinity difference between water sample and corrected CTD = 0.013 for 106 observations.
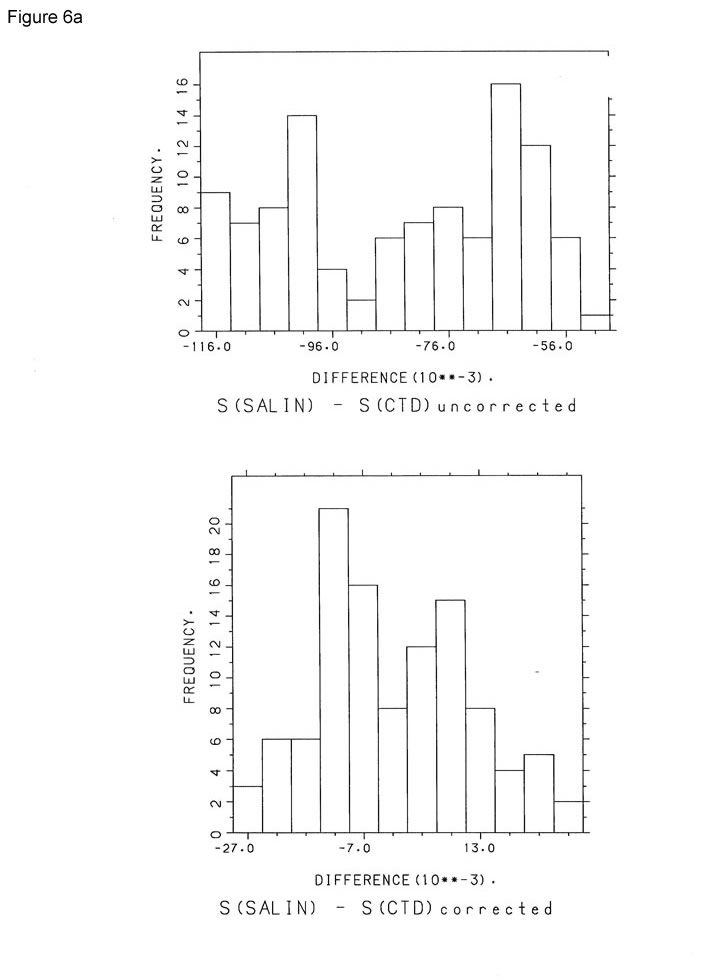
Figure 5a shows the differences between water sample salinity and CTD salinity after calibration of all sensors.
The histograms in Figure 6a show the differences between water sample salinity and CTD salinity, uncorrected (upper) and corrected (lower).
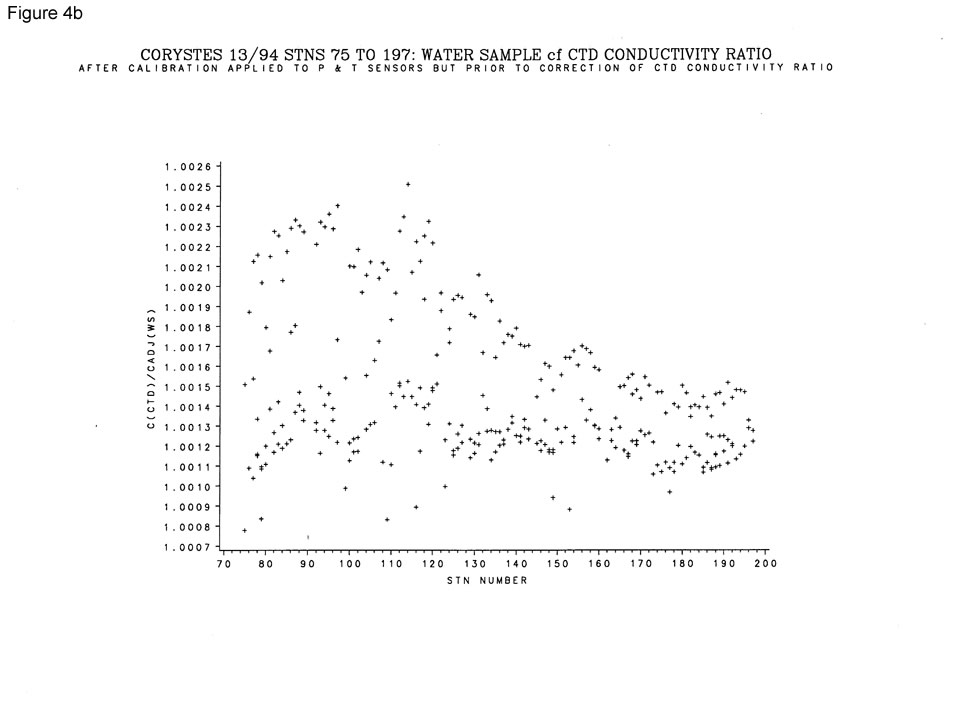
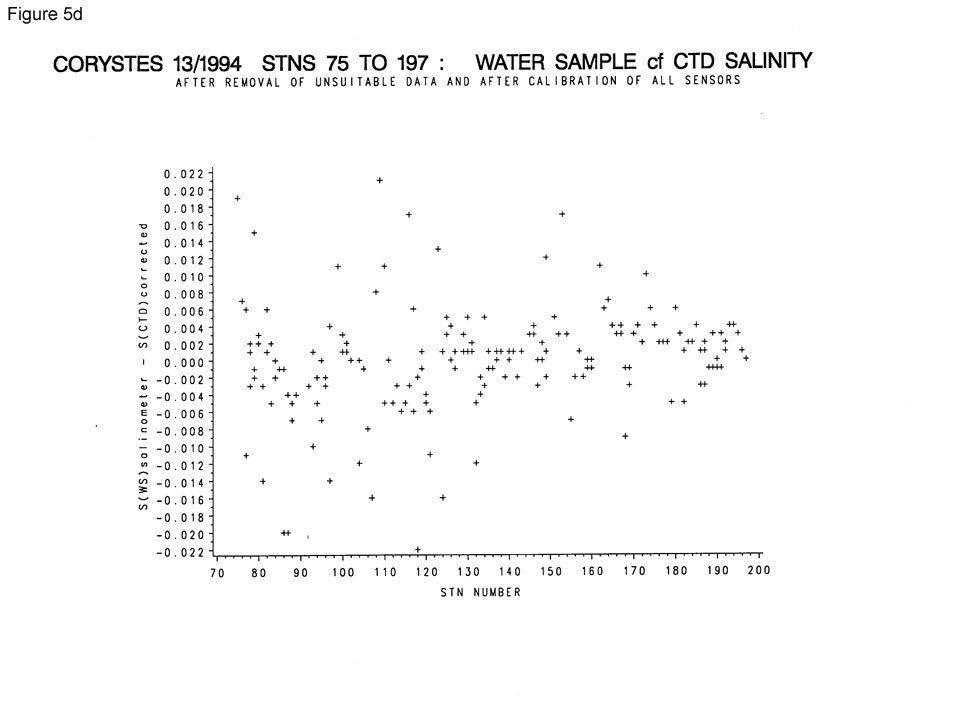
ii) Stations 75 - 197
Figure 4b shows the ratio of CTD conductivity to water sample conductivity after the CTD pressure and temperature had been corrected using the coefficients in 3a) and 3b) above.
For these data coefficients have been derived to calibrate the CTD conductivity sensor using a least square fit between the ratio of water sample conductivity to CTD conductivity and the CTD temperature and pressure.
CR(cor) = CR(ctd)*{a*T(cor) + b*P(cor) + c}
where T(cor) and P(cor) are the corrected CTD temperature and pressure and where:
a = 0.134749006E-03, b = 0.424225150E-05, c = 0.996775320E+00
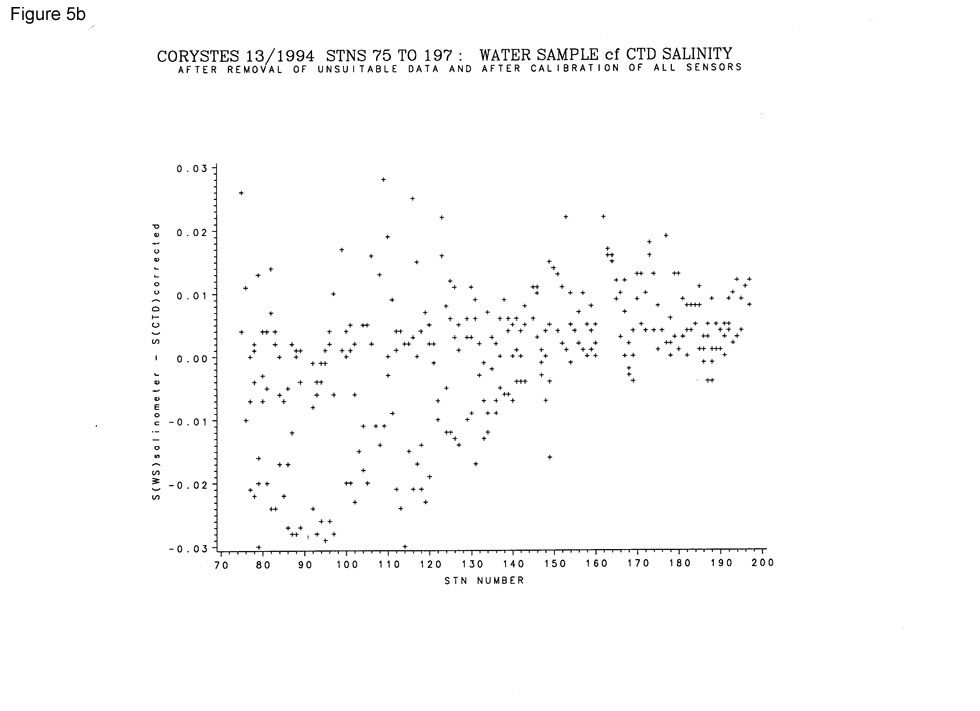
RMS salinity difference between water sample and corrected CTD = 0.011 for 301 observations.
Figure 5b shows the differences between water sample salinity and CTD salinity after calibration of all sensors.
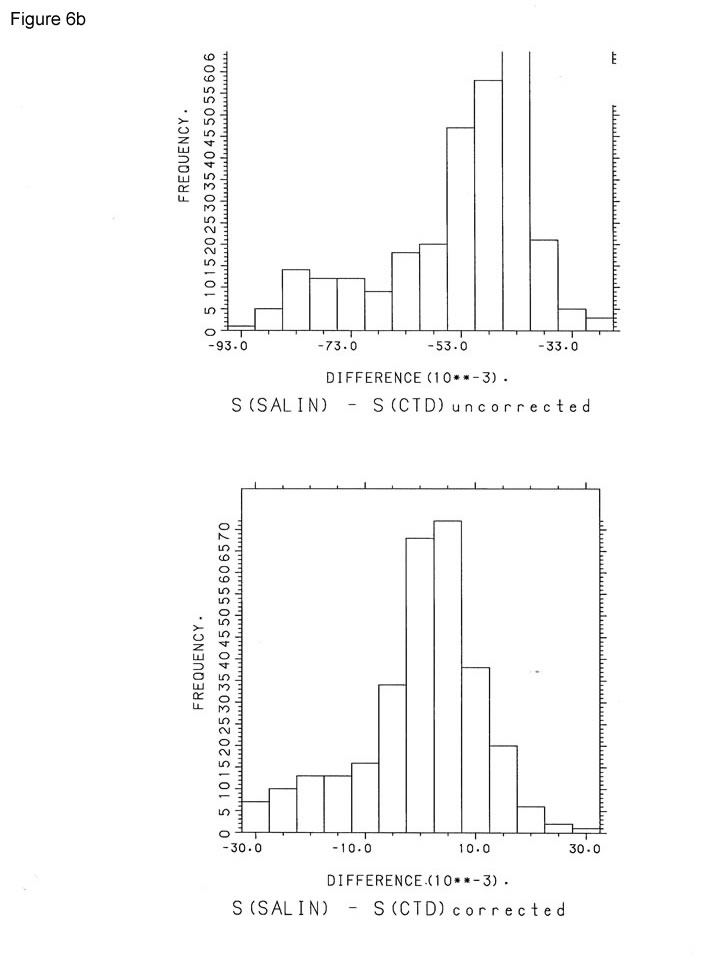
The histograms in figure 6b show the differences between water samples salinity and CTD salinity uncorrected (upper) and corrected (lower)
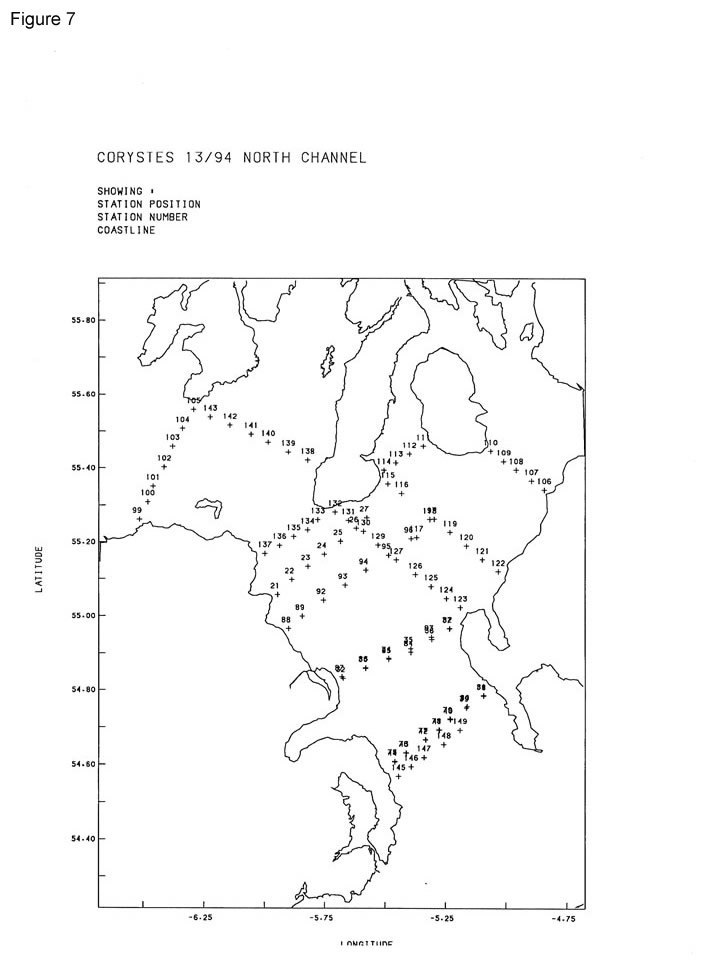
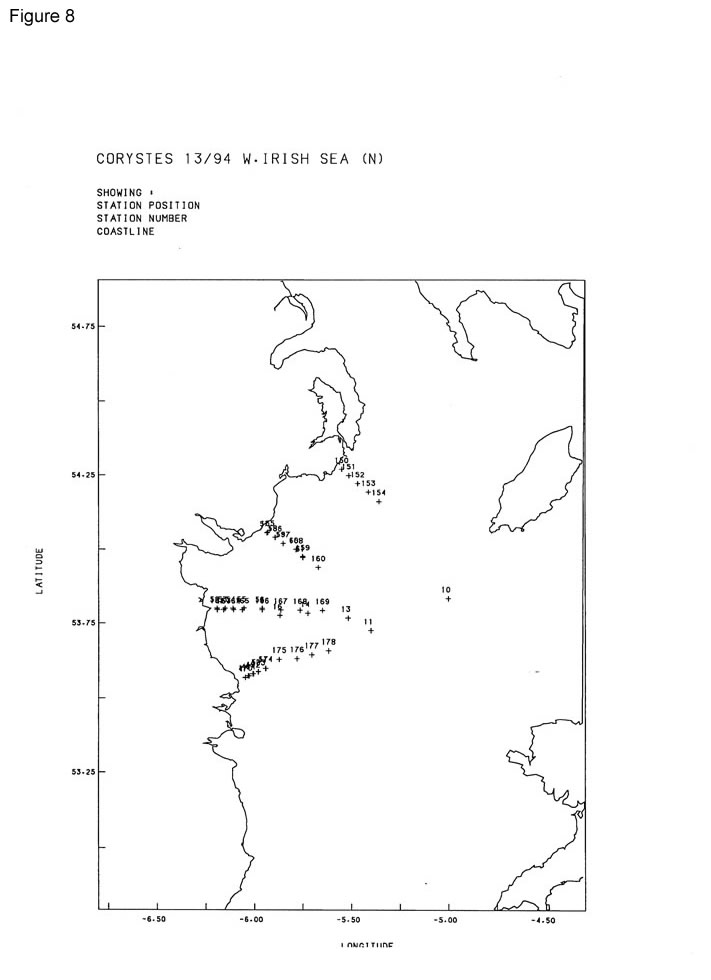
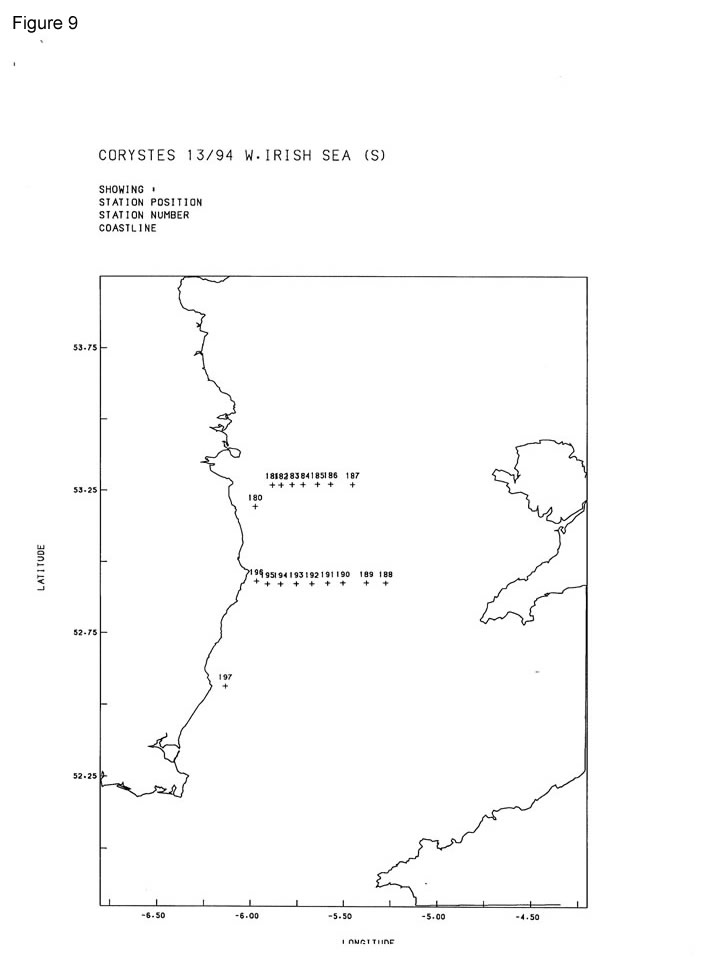
4. TRANSMISSION AND SUSPENDED LOAD
A 25cm transmissometer (s/n 198) was used throughout this cruise. Samples for suspended load determination were taken on all stations. The values from these samples have been used to calibrate the transmissometer in terms of suspended load.
The data were grouped into three areas for the purposes of obtaining a calibration. Figures 7 to 9 show the groupings
A regression was calculated in the form of:
Suspended load = b*loge(%transmission) + c
where for:
a) North Channel: b = -21.6, c = 78.62
b) Western Irish Sea (North): b = -8.51, c = 31.40
c) Western Irish Sea (South): b = -14.70, c = 55.15
S R Jones
March 1995
General Data Screening carried out by BODC
BODC screen both the series header qualifying information and the parameter values in the data cycles themselves.
Header information is inspected for:
- Irregularities such as unfeasible values
- Inconsistencies between related information, for example:
- Times for instrument deployment and for start/end of data series
- Length of record and the number of data cycles/cycle interval
- Parameters expected and the parameters actually present in the data cycles
- Originator's comments on meter/mooring performance and data quality
Documents are written by BODC highlighting irregularities which cannot be resolved.
Data cycles are inspected using time or depth series plots of all parameters. Currents are additionally inspected using vector scatter plots and time series plots of North and East velocity components. These presentations undergo intrinsic and extrinsic screening to detect infeasible values within the data cycles themselves and inconsistencies as seen when comparing characteristics of adjacent data sets displaced with respect to depth, position or time. Values suspected of being of non-oceanographic origin may be tagged with the BODC flag denoting suspect value; the data values will not be altered.
The following types of irregularity, each relying on visual detection in the plot, are amongst those which may be flagged as suspect:
- Spurious data at the start or end of the record.
- Obvious spikes occurring in periods free from meteorological disturbance.
- A sequence of constant values in consecutive data cycles.
If a large percentage of the data is affected by irregularities then a Problem Report will be written rather than flagging the individual suspect values. Problem Reports are also used to highlight irregularities seen in the graphical data presentations.
Inconsistencies between the characteristics of the data set and those of its neighbours are sought and, where necessary, documented. This covers inconsistencies such as the following:
- Maximum and minimum values of parameters (spikes excluded).
- The occurrence of meteorological events.
This intrinsic and extrinsic screening of the parameter values seeks to confirm the qualifying information and the source laboratory's comments on the series. In screening and collating information, every care is taken to ensure that errors of BODC making are not introduced.
Project Information
No Project Information held for the Series
Data Activity or Cruise Information
Cruise
| Cruise Name | COR13/94 |
| Departure Date | 1994-10-24 |
| Arrival Date | 1994-11-17 |
| Principal Scientist(s) | Juan Brown (Ministry of Agriculture, Fisheries and Food Lowestoft Fisheries Laboratory) |
| Ship | RV Corystes |
Complete Cruise Metadata Report is available here
Fixed Station Information
No Fixed Station Information held for the Series
BODC Quality Control Flags
The following single character qualifying flags may be associated with one or more individual parameters with a data cycle:
| Flag | Description |
|---|---|
| Blank | Unqualified |
| < | Below detection limit |
| > | In excess of quoted value |
| A | Taxonomic flag for affinis (aff.) |
| B | Beginning of CTD Down/Up Cast |
| C | Taxonomic flag for confer (cf.) |
| D | Thermometric depth |
| E | End of CTD Down/Up Cast |
| G | Non-taxonomic biological characteristic uncertainty |
| H | Extrapolated value |
| I | Taxonomic flag for single species (sp.) |
| K | Improbable value - unknown quality control source |
| L | Improbable value - originator's quality control |
| M | Improbable value - BODC quality control |
| N | Null value |
| O | Improbable value - user quality control |
| P | Trace/calm |
| Q | Indeterminate |
| R | Replacement value |
| S | Estimated value |
| T | Interpolated value |
| U | Uncalibrated |
| W | Control value |
| X | Excessive difference |
SeaDataNet Quality Control Flags
The following single character qualifying flags may be associated with one or more individual parameters with a data cycle:
| Flag | Description |
|---|---|
| 0 | no quality control |
| 1 | good value |
| 2 | probably good value |
| 3 | probably bad value |
| 4 | bad value |
| 5 | changed value |
| 6 | value below detection |
| 7 | value in excess |
| 8 | interpolated value |
| 9 | missing value |
| A | value phenomenon uncertain |
| B | nominal value |
| Q | value below limit of quantification |
