Metadata Report for BODC Series Reference Number 601937
Metadata Summary
Problem Reports
Data Access Policy
Narrative Documents
Project Information
Data Activity or Cruise Information
Fixed Station Information
BODC Quality Flags
SeaDataNet Quality Flags
Metadata Summary
Data Description |
|||||||||||||||||||||||||
|
|||||||||||||||||||||||||
Data Identifiers |
|||||||||||||||||||||||||
|
|||||||||||||||||||||||||
Time Co-ordinates(UT) |
|||||||||||||||||||||||||
|
|||||||||||||||||||||||||
Spatial Co-ordinates | |||||||||||||||||||||||||
|
|||||||||||||||||||||||||
Parameters |
|||||||||||||||||||||||||
|
|||||||||||||||||||||||||
|
|||||||||||||||||||||||||
Problem Reports
No Problem Report Found in the Database
Data Access Policy
Open Data
These data have no specific confidentiality restrictions for users. However, users must acknowledge data sources as it is not ethical to publish data without proper attribution. Any publication or other output resulting from usage of the data should include an acknowledgment.
If the Information Provider does not provide a specific attribution statement, or if you are using Information from several Information Providers and multiple attributions are not practical in your product or application, you may consider using the following:
"Contains public sector information licensed under the Open Government Licence v1.0."
Narrative Documents
Falmouth Scientific Integrated CTD (ICTD) Profiler
The FSI ICTD is designed to collect high precision conductivity, temperature and pressure data with self calibrating electronics. This instrument can support five primary sensors (including up to three temperature sensors) and can be coupled with a water bottle sampler. The ICTD is equipped with a titanium housing rated to 7000 m and has a sampling rate of 32 Hz.
Three temperature sensors are available: primary platinum, redundant platinum and exposed thermistor. Any combination of these can be used in the primary channels. The instrument also has multiple RS-232 serial inputs for a variety of sensors including: ADCP, Benthos PSA-916 Altimeter and WetLabs SAFire. There are an additional eight DC input channels that can support virtually any sensor that has a DC output.
Specifications:
| Parameter | Conductivity | Temperature | Pressure |
| Sensor | Inductive cell | Platinum thermometer | Precision-machined Silicon |
| Range | 0 to 70 mS cm-1 | -2 to 35°C | Customer specified |
| Accuracy | ±0.002 mS cm-1 | 0.002°C | ±0.01 % full scale |
| Resolution | 0.0001 mS cm-1 | 0.00005°C | 0.0004 % full scale |
| Response | 5.0 cm at 1 ms-1 | 150 ms Platinum 20 ms Thermistor* | 25 ms |
*Optional
Further details can be found in the manufacturer's specification sheet.
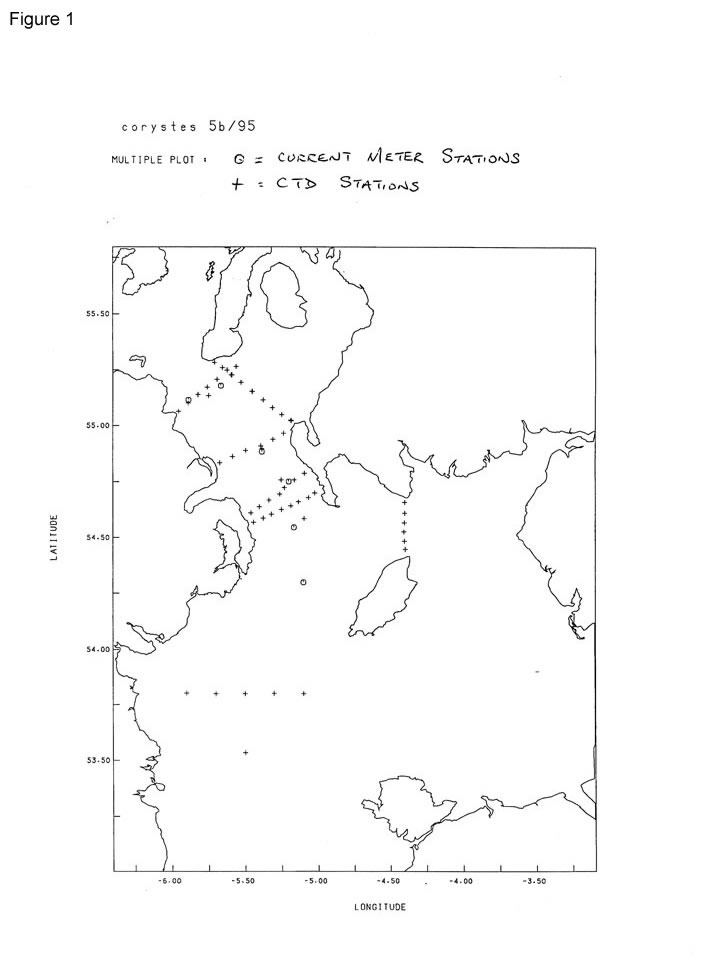
RV Corystes Cruise 5B/95 CTD Data Documentation
Fifty seven CTD profiles were obtained using a Falmouth Scientific Instruments ICTD (s/n 1322) during this cruise to the Irish Sea; see Figure 1.
A single digital electronic reversing thermometer was used to compare with temperatures recorded by the CTD and samples were collected for salinity analysis to derive a calibration for the instrument conductivity sensor.
A light scattering sensor was fitted to the niskin rosette at all stations. In addition a 25cm path length transmissometer and a multiple optical back scattering sensor were used at some stations. Samples were collected for suspended load analysis to calibrate these sensors. An altimeter was used to determine height of CTD above seabed.
Thermometer data
A comparison between temperatures recorded by the digital reversing thermometer and the CTD was made regularly during the cruise to identify any possible malfunction. Because only one thermometer with a valid calibration was available an assessment of thermometer differences is not possible.
Salinity data
Samples for salinity analysis on the Laboratory's Guildline salinometer were collected at every station. Duplicate samples were drawn on twelve occasions and their differences were as follows:
| Difference | No. | Cumulative % |
|---|---|---|
| 0.000 | 4 | 33 |
| 0.001 | 5 | 75 |
| 0.002 | 3 | 100 |
Sensor calibration for the CTD
(a) Pressure
The pressure sensor was calibrated using a dead-weight tester prior to the cruise on 26/04/1995 with the probe at room temperature and this was used to correct the recorded CTD pressure P(unc):
P(cor) =P(unc) + dP where dP = -0.00081P(unc) - 0.136
A check was made on this throughout the cruise by noting the 'offset' when the CTD was on deck.
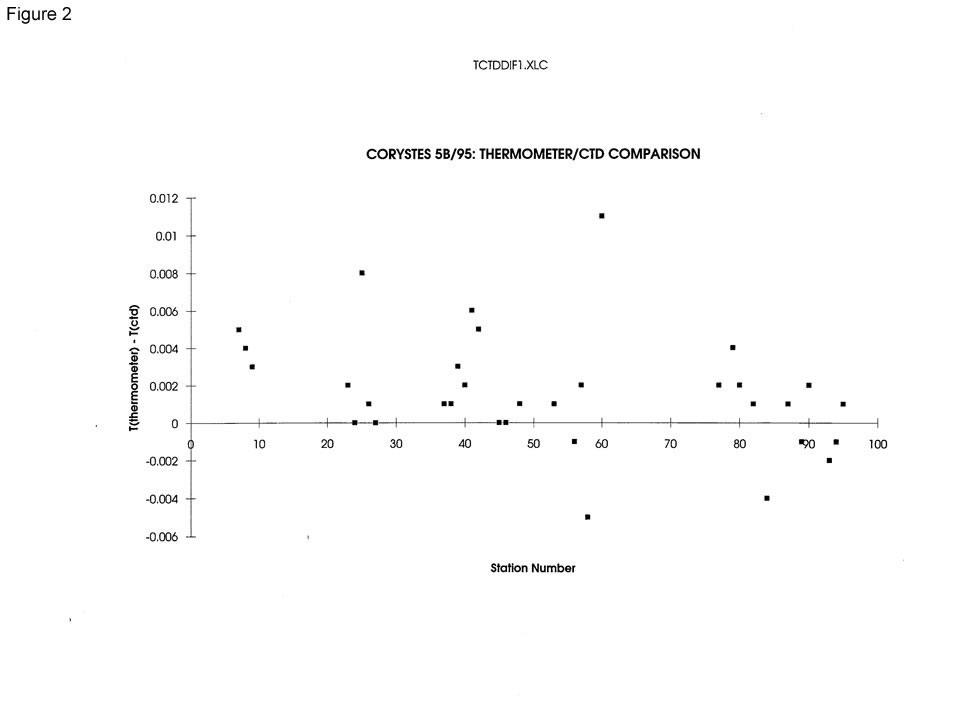
(b) Temperature
The temperature sensor was calibrated using PRT's on 23/03/1995. This indicated that for temperatures between 2 and 14 degC, which covered those encountered during the cruise, no correction was required.
i.e T(cor) = T(unc)
The differences between the thermometer and the corrected CTD temperatures at successive stations is plotted in Figure 2. The mean difference of 0.002 (std dev 0.003, 33 data values) is acceptable given the expected tolerances of the sensors.
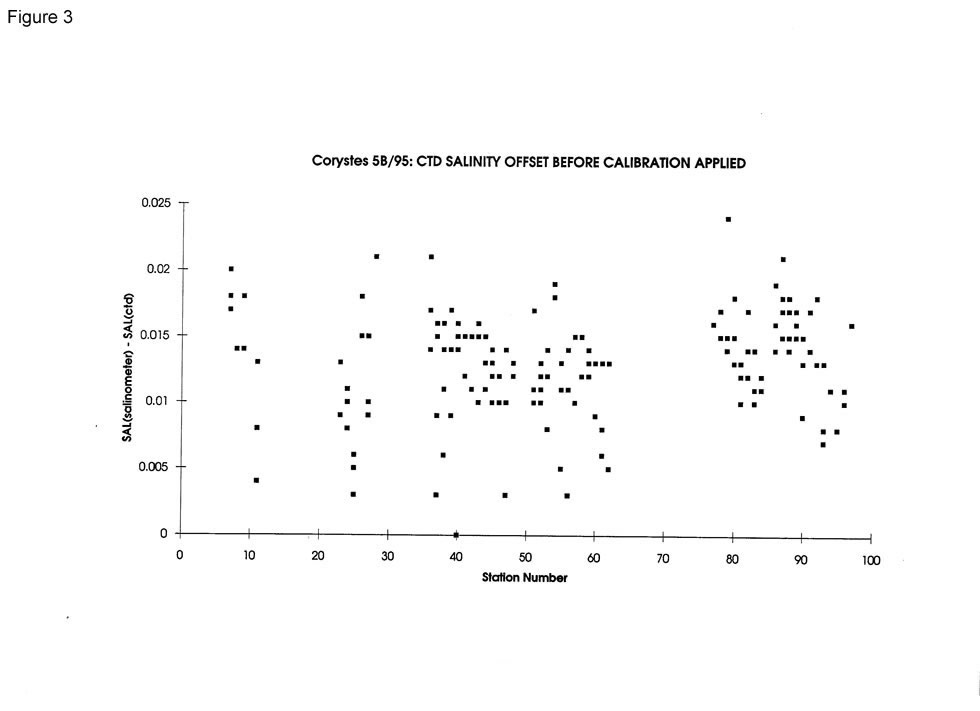
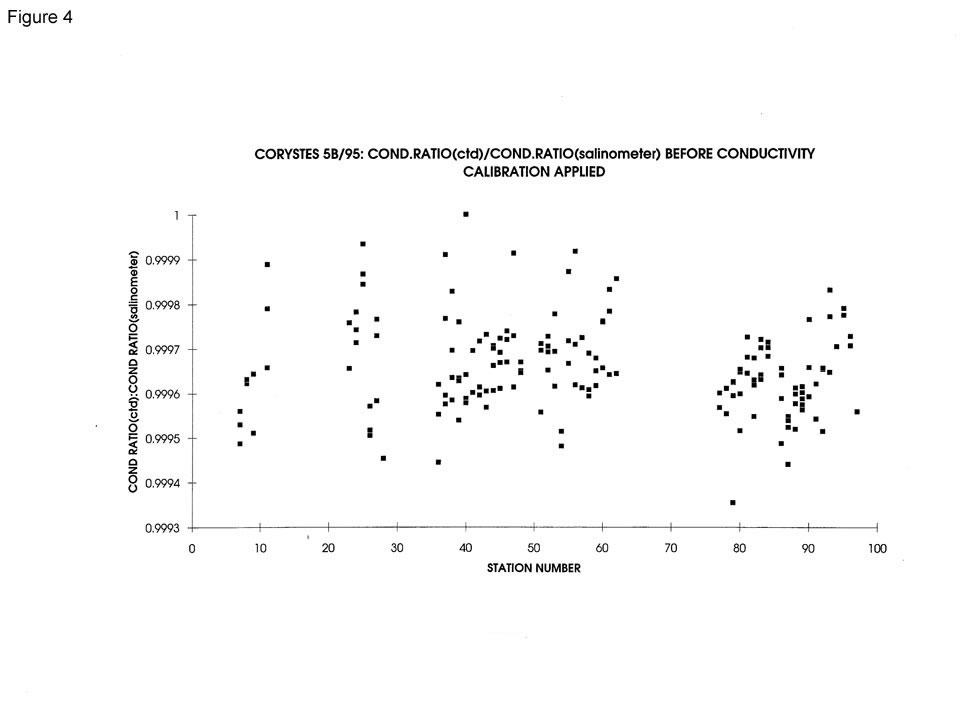
(c) Conductivity
The difference between salinometer and CTD salinity before the conductivity is corrected is plotted in Figure 3. The mean difference is 0.013 (std deviation 0.004, 164 data values). Figure 4 shows conductivity ratio(CTD): conductivity ratio(water samples), the water sample conductivity ratio being that from the salinometer salinity at the corrected pressure and temperature given by the CTD. There was no evidence of a pressure or temperature dependence.
To compensate for the remaining under-estimation of CTD conductivity a least square fit was used to determine appropriate calibration coefficients:
CR(cor) = CR(ctd) [a T(cor) + b P(cor) + c]
where T(cor) and P(cor) are the corrected CTD temperature and pressure and
a = 5.24584288e-5, b = 4.04625898e-7, c = 0.9998843
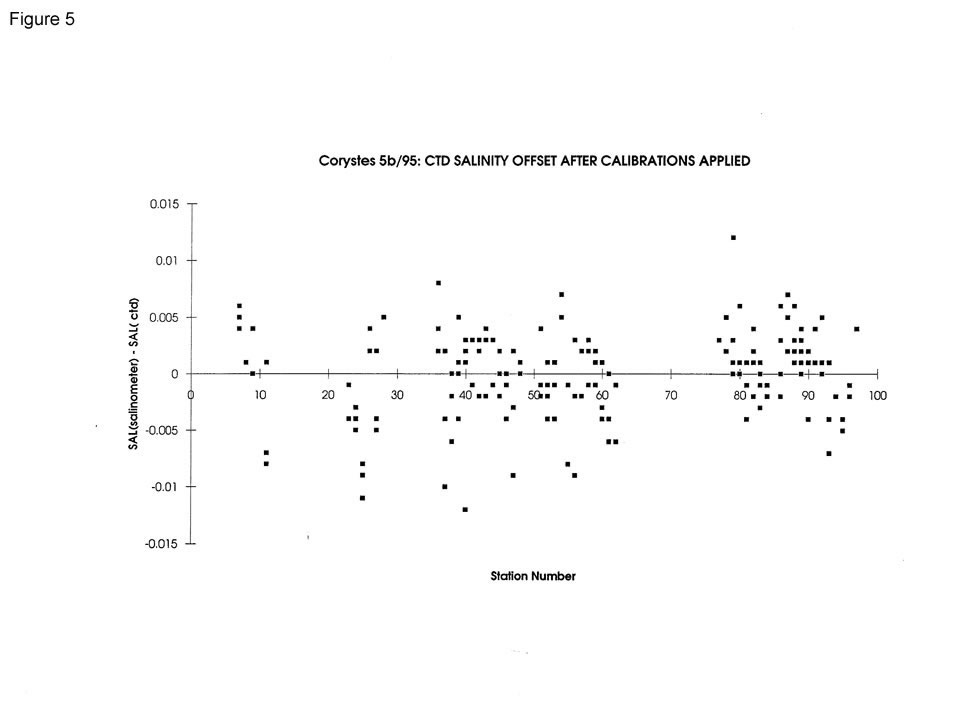
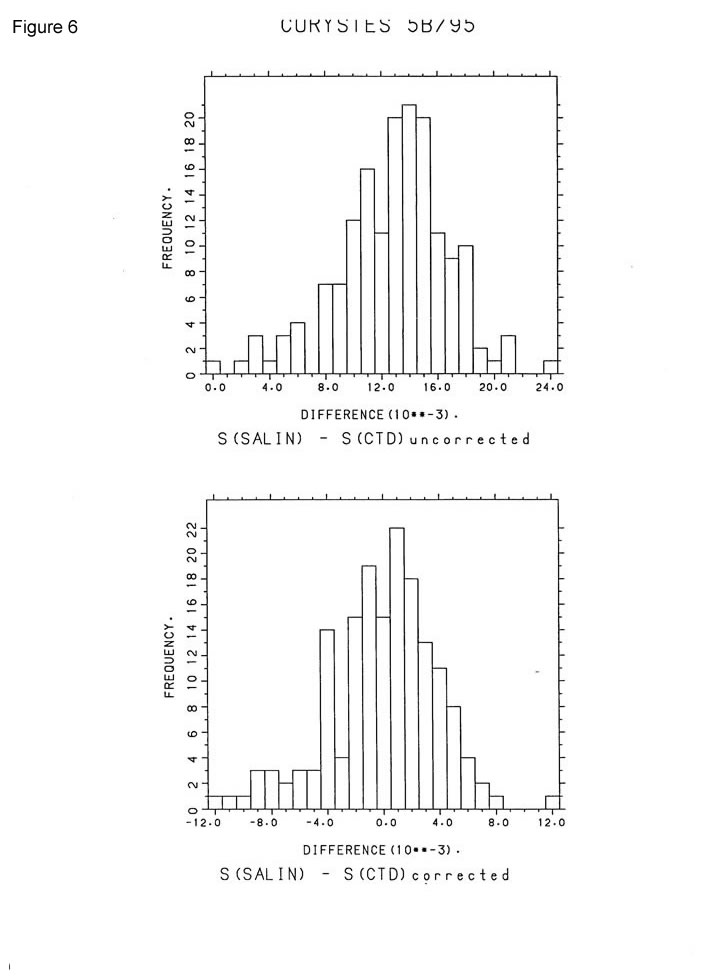
Using these coefficients the rms difference between water sample and corrected CTD salinity is 0.004 for 164 samples. Figures 5 and 6 show the differences after these coefficients have been applied. The upper histogram of Figure 6 shows the differences before the conductivity has been corrected; the bottom histogram after the conductivity calibration has been applied. If it assumed that the CTD is accurate to 0.01 and the salinometer to 0.003 then differences of +/-0.013 are acceptable. In this instance all differences are less than +/- 0.012, within this tolerance.
Suspended Load
The transmissometer and optical back scattering sensor were not used at all stations (the readings of the latter correlated well with the suspended load measurements) and the light scattering sensor, fitted throughout the cruise, was used to estimate suspended load for inclusion in the ctd profiles.
suspended load = a * loge( lss voltage) + b
where a and b are as follows:
| Stations | a | b | rmse | R | N |
|---|---|---|---|---|---|
| 7 to 11 | 1.660 | 4.180 | 0.43 | 0.96 | 19 |
| 23 to 28 | 1.247 | 3.274 | 0.17 | 0.95 | 17 |
| 36 to 42 | 1.645 | 4.241 | 0.79 | 0.80 | 58 |
| 43 to 62 | 1.628 | 3.809 | 0.50 | 0.84 | 54 |
| 77 to 87 | 1.975 | 4.671 | 0.67 | 0.88 | 35 |
| 88 to 97 | 2.575 | 5.645 | 1.02 | 0.85 | 29 |
| 168 | sensor not operative, protective cap not removed |
This division of stations reflects the geographical area from which the profiles were made.
Ken Medler
01/06/1995
General Data Screening carried out by BODC
BODC screen both the series header qualifying information and the parameter values in the data cycles themselves.
Header information is inspected for:
- Irregularities such as unfeasible values
- Inconsistencies between related information, for example:
- Times for instrument deployment and for start/end of data series
- Length of record and the number of data cycles/cycle interval
- Parameters expected and the parameters actually present in the data cycles
- Originator's comments on meter/mooring performance and data quality
Documents are written by BODC highlighting irregularities which cannot be resolved.
Data cycles are inspected using time or depth series plots of all parameters. Currents are additionally inspected using vector scatter plots and time series plots of North and East velocity components. These presentations undergo intrinsic and extrinsic screening to detect infeasible values within the data cycles themselves and inconsistencies as seen when comparing characteristics of adjacent data sets displaced with respect to depth, position or time. Values suspected of being of non-oceanographic origin may be tagged with the BODC flag denoting suspect value; the data values will not be altered.
The following types of irregularity, each relying on visual detection in the plot, are amongst those which may be flagged as suspect:
- Spurious data at the start or end of the record.
- Obvious spikes occurring in periods free from meteorological disturbance.
- A sequence of constant values in consecutive data cycles.
If a large percentage of the data is affected by irregularities then a Problem Report will be written rather than flagging the individual suspect values. Problem Reports are also used to highlight irregularities seen in the graphical data presentations.
Inconsistencies between the characteristics of the data set and those of its neighbours are sought and, where necessary, documented. This covers inconsistencies such as the following:
- Maximum and minimum values of parameters (spikes excluded).
- The occurrence of meteorological events.
This intrinsic and extrinsic screening of the parameter values seeks to confirm the qualifying information and the source laboratory's comments on the series. In screening and collating information, every care is taken to ensure that errors of BODC making are not introduced.
Project Information
No Project Information held for the Series
Data Activity or Cruise Information
Cruise
| Cruise Name | COR5B/95 |
| Departure Date | 1995-05-04 |
| Arrival Date | 1995-05-23 |
| Principal Scientist(s) | Juan Brown (Ministry of Agriculture, Fisheries and Food Lowestoft Fisheries Laboratory) |
| Ship | RV Corystes |
Complete Cruise Metadata Report is available here
Fixed Station Information
No Fixed Station Information held for the Series
BODC Quality Control Flags
The following single character qualifying flags may be associated with one or more individual parameters with a data cycle:
| Flag | Description |
|---|---|
| Blank | Unqualified |
| < | Below detection limit |
| > | In excess of quoted value |
| A | Taxonomic flag for affinis (aff.) |
| B | Beginning of CTD Down/Up Cast |
| C | Taxonomic flag for confer (cf.) |
| D | Thermometric depth |
| E | End of CTD Down/Up Cast |
| G | Non-taxonomic biological characteristic uncertainty |
| H | Extrapolated value |
| I | Taxonomic flag for single species (sp.) |
| K | Improbable value - unknown quality control source |
| L | Improbable value - originator's quality control |
| M | Improbable value - BODC quality control |
| N | Null value |
| O | Improbable value - user quality control |
| P | Trace/calm |
| Q | Indeterminate |
| R | Replacement value |
| S | Estimated value |
| T | Interpolated value |
| U | Uncalibrated |
| W | Control value |
| X | Excessive difference |
SeaDataNet Quality Control Flags
The following single character qualifying flags may be associated with one or more individual parameters with a data cycle:
| Flag | Description |
|---|---|
| 0 | no quality control |
| 1 | good value |
| 2 | probably good value |
| 3 | probably bad value |
| 4 | bad value |
| 5 | changed value |
| 6 | value below detection |
| 7 | value in excess |
| 8 | interpolated value |
| 9 | missing value |
| A | value phenomenon uncertain |
| B | nominal value |
| Q | value below limit of quantification |
