Metadata Report for BODC Series Reference Number 602209
Metadata Summary
Problem Reports
Data Access Policy
Narrative Documents
Project Information
Data Activity or Cruise Information
Fixed Station Information
BODC Quality Flags
SeaDataNet Quality Flags
Metadata Summary
Data Description |
|||||||||||||||||||||||||
|
|||||||||||||||||||||||||
Data Identifiers |
|||||||||||||||||||||||||
|
|||||||||||||||||||||||||
Time Co-ordinates(UT) |
|||||||||||||||||||||||||
|
|||||||||||||||||||||||||
Spatial Co-ordinates | |||||||||||||||||||||||||
|
|||||||||||||||||||||||||
Parameters |
|||||||||||||||||||||||||
|
|||||||||||||||||||||||||
|
|||||||||||||||||||||||||
Problem Reports
No Problem Report Found in the Database
Data Access Policy
Open Data
These data have no specific confidentiality restrictions for users. However, users must acknowledge data sources as it is not ethical to publish data without proper attribution. Any publication or other output resulting from usage of the data should include an acknowledgment.
If the Information Provider does not provide a specific attribution statement, or if you are using Information from several Information Providers and multiple attributions are not practical in your product or application, you may consider using the following:
"Contains public sector information licensed under the Open Government Licence v1.0."
Narrative Documents
Falmouth Scientific Integrated CTD (ICTD) Profiler
The FSI ICTD is designed to collect high precision conductivity, temperature and pressure data with self calibrating electronics. This instrument can support five primary sensors (including up to three temperature sensors) and can be coupled with a water bottle sampler. The ICTD is equipped with a titanium housing rated to 7000 m and has a sampling rate of 32 Hz.
Three temperature sensors are available: primary platinum, redundant platinum and exposed thermistor. Any combination of these can be used in the primary channels. The instrument also has multiple RS-232 serial inputs for a variety of sensors including: ADCP, Benthos PSA-916 Altimeter and WetLabs SAFire. There are an additional eight DC input channels that can support virtually any sensor that has a DC output.
Specifications:
| Parameter | Conductivity | Temperature | Pressure |
| Sensor | Inductive cell | Platinum thermometer | Precision-machined Silicon |
| Range | 0 to 70 mS cm-1 | -2 to 35°C | Customer specified |
| Accuracy | ±0.002 mS cm-1 | 0.002°C | ±0.01 % full scale |
| Resolution | 0.0001 mS cm-1 | 0.00005°C | 0.0004 % full scale |
| Response | 5.0 cm at 1 ms-1 | 150 ms Platinum 20 ms Thermistor* | 25 ms |
*Optional
Further details can be found in the manufacturer's specification sheet.
RV Corystes Cruise 07/94 CTD Data Documentation
Stations 18-238
For this cruise the FSI CTD (s/n 1322) was used. The following is a presentation of the data from all stations.
Ninety-one CTD profiles were obtained on this cruise, electronic reversing thermometers were used to measure water temperature and samples were collected for salinity analysis on board using the Guildline 'Portasal' salinometer. In addition samples were taken for analysis for a standard range of nutrients and for suspended load measurements.
1. THERMOMETER DATA
Pairs of thermometer readings were available on 82 stations. Seventeen were removed because the differences between them were too high (>0.03°C). The distribution of the remaining pairs is:
| Difference °C | No. | Cumulative % |
|---|---|---|
| 0.000 - 0.010 | 39 | 60 |
| 0.011 - 0.020 | 22 | 94 |
| 0.021 - 0.030 | 4 | 100 |
2. SALINITY DATA
Water samples were taken on all stations for analysis on board by the Guildline 'Portasal' salinometer. Eighteen pairs of duplicate samples were taken. The distribution of their differences is:
| Difference | No. | Cumulative % |
|---|---|---|
| 0.000 | 8 | 44 |
| 0.001 - 0.006 | 10 | 100 |
3. SENSOR CALIBRATION FOR FSI CTD
a) Pressure
The laboratory calibration of June 1994 with the sensor at 18°C was used to correct the pressure sensor:
Pcor=Pctd+0.3db
It should be noted that this calibration was only carried out to 100db equivalent. Some stations on this cruise were over 300db pressure.
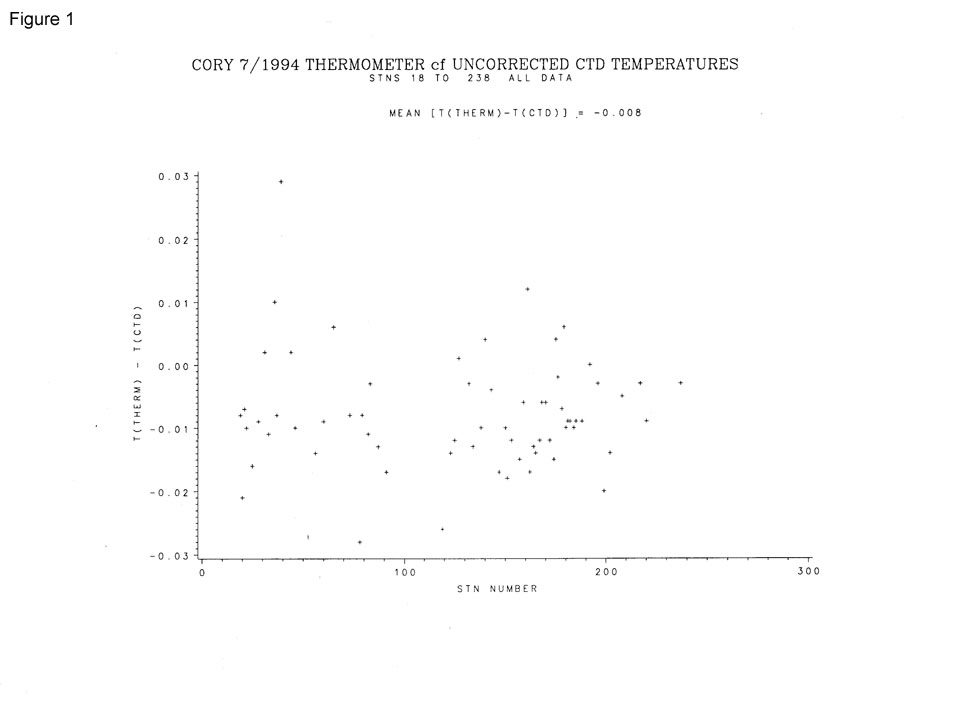
b) Temperature
Figure 1 shows the differences between the mean thermometer and uncorrected CTD temperatures. The 65 points plotted give a mean difference of -0.008°C.
The sensor was corrected using the laboratory calibration coefficients:
Tcor = Tctd + dT
where dT = a*T(ctd)*T(ctd) + b*T(ctd) + c
and a = -5.36414E-05, b = 6.376027E-04, c = 3.052559E-04
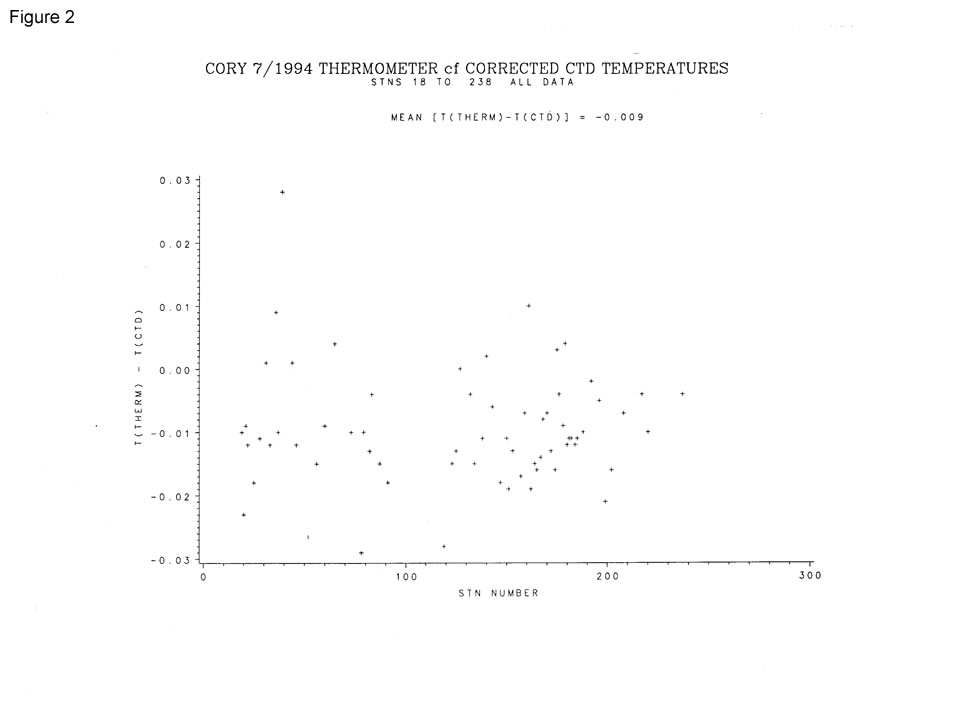
Figure 2 shows the differences between the means of pairs of thermometer readings and the CTD temperature data after the latter have been corrected.
The mean difference is -0.009°C and all lie within 0.03°C.
This cruise saw the first extensive use of electronic reversing thermometers by DFR. The differences between them appear to be not as good as we have had from mercury- in-glass instruments; 17 pairs have a difference of >0.0120C. It may be that when we have used them more and they have been calibrated in-house the results will be better. An over-riding advantage is, of course, that no special skill is needed to read them.
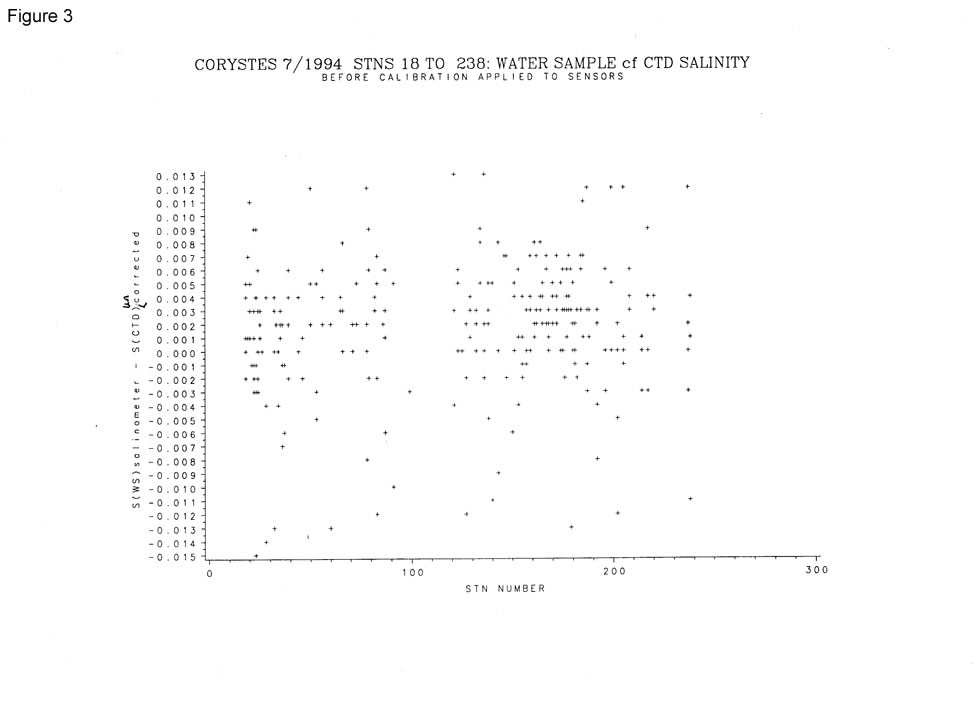
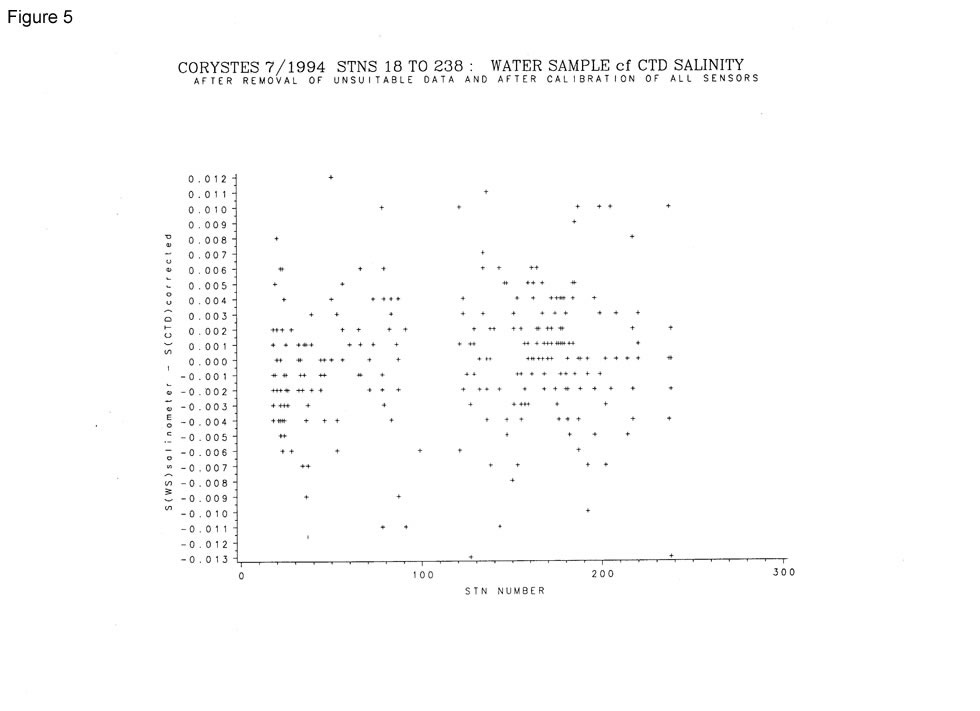
c) Salinity
Figure 3 shows the difference between the water sample salinity as measured with the salinometer and that derived from the CTD before any calibrations have been applied to the latter. It suggests that the CTD has a tendency to under-estimate salinity. Note that 40 values were removed because the differences were large suggesting erroneous CTD values or water sample salinities.
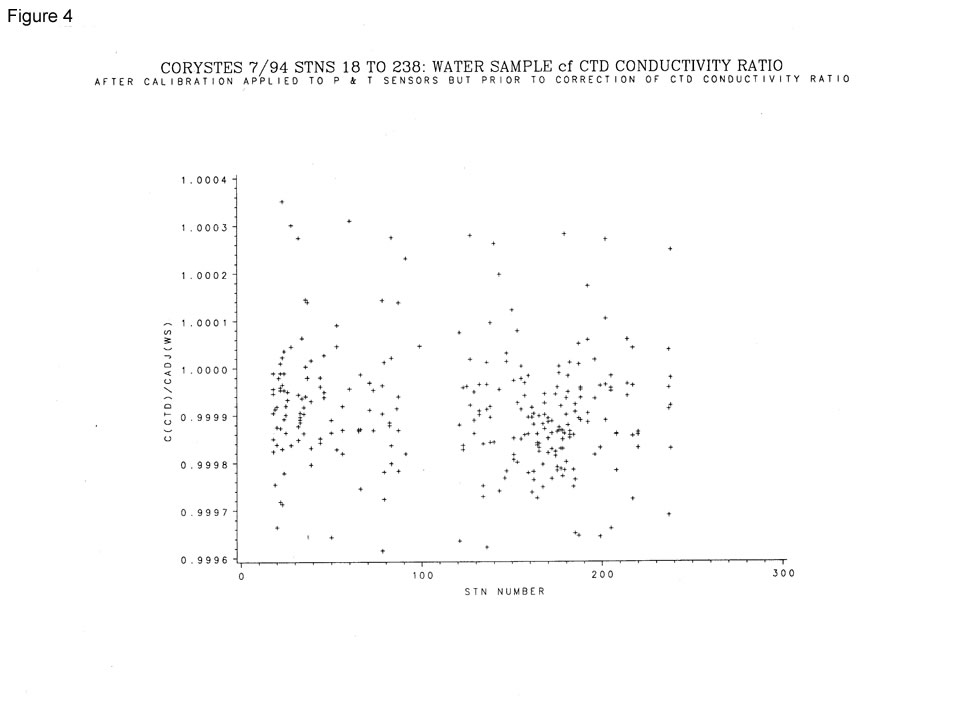
Figure 4 shows the ratio of CTD conductivity to water sample conductivity after the CTD pressure and temperature had been corrected using the coefficients in a) and b) above.
For the data from this cruise coefficients have been derived to calibrate the CTD conductivity sensor using a least square fit between the ratio of water sample conductivity to CTD conductivity and the CTD temperature and pressure.
CR(cor) = CR(ctd)* { a*T(cor) + b*P(cor) + c }
where T(cor) and P(cor) are the corrected CTD temperature and pressure and where
a = -0.318061201E-04, b = -0.777284441E-07, c = 0.1000412990E+01
RMS salinity difference between water sample and corrected CTD = 0.004 for 272 observations.
Figure 5 shows that the tendency for the CTD to under-estimate salinity has been removed.
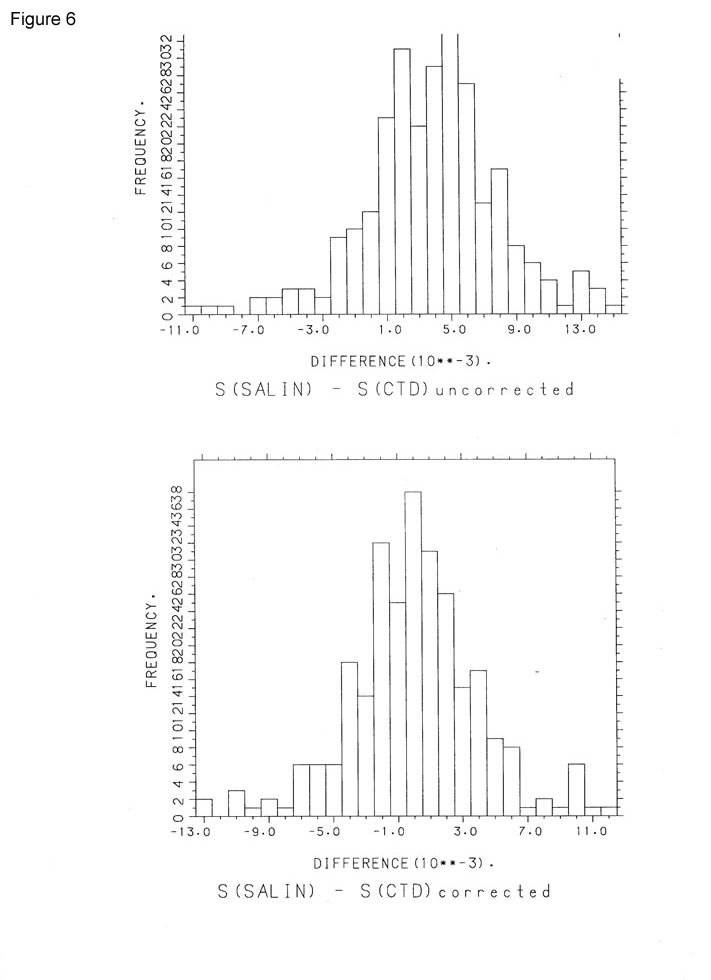
The histograms in Figure 6 show how well the CTD conductivities are corrected since the upper panel was derived after the C temperature and pressure had been corrected and before the CTD conductivity calibration was applied. The lower panel gives the final corrected version.
If it assumed that the salinometer is accurate to 0.003 and the CTD salinity to 0.013, then differences between ± 0.016 will be acceptable. For this date set all values lie within these limits.
4. TRANSMISSION AND SUSPENDED LOAD
A 25cm transmissometer (s/n 198) was used throughout this cruise. Samples for suspended load determination were taken on all stations. The values from these samples have been used to calibrate the transmissometer in terms of suspended load.
The data were grouped into two areas after discussion with the SIC. The Western Irish Sea Group comprised the following stations:
36, 37, 39, 41, 44, 50, 53, 60, 65, 66, 73, 78, 79, 87, 192, 196, 199, 202, 205, 208, 214, 217, 220, 237 and 238.
A linear regression was calculated in the form of:
a = bx + c
where,
a = suspended load, x = loge (% transmission), b=-6.18, c = 27.23
The remaining stations comprised the North Channel Group. The same linear regression was calculated with the following coefficients:
a = suspended load, x = loge (% transmission), b=-17.7, c=77.27
S R Jones
September 1994
General Data Screening carried out by BODC
BODC screen both the series header qualifying information and the parameter values in the data cycles themselves.
Header information is inspected for:
- Irregularities such as unfeasible values
- Inconsistencies between related information, for example:
- Times for instrument deployment and for start/end of data series
- Length of record and the number of data cycles/cycle interval
- Parameters expected and the parameters actually present in the data cycles
- Originator's comments on meter/mooring performance and data quality
Documents are written by BODC highlighting irregularities which cannot be resolved.
Data cycles are inspected using time or depth series plots of all parameters. Currents are additionally inspected using vector scatter plots and time series plots of North and East velocity components. These presentations undergo intrinsic and extrinsic screening to detect infeasible values within the data cycles themselves and inconsistencies as seen when comparing characteristics of adjacent data sets displaced with respect to depth, position or time. Values suspected of being of non-oceanographic origin may be tagged with the BODC flag denoting suspect value; the data values will not be altered.
The following types of irregularity, each relying on visual detection in the plot, are amongst those which may be flagged as suspect:
- Spurious data at the start or end of the record.
- Obvious spikes occurring in periods free from meteorological disturbance.
- A sequence of constant values in consecutive data cycles.
If a large percentage of the data is affected by irregularities then a Problem Report will be written rather than flagging the individual suspect values. Problem Reports are also used to highlight irregularities seen in the graphical data presentations.
Inconsistencies between the characteristics of the data set and those of its neighbours are sought and, where necessary, documented. This covers inconsistencies such as the following:
- Maximum and minimum values of parameters (spikes excluded).
- The occurrence of meteorological events.
This intrinsic and extrinsic screening of the parameter values seeks to confirm the qualifying information and the source laboratory's comments on the series. In screening and collating information, every care is taken to ensure that errors of BODC making are not introduced.
Project Information
No Project Information held for the Series
Data Activity or Cruise Information
Cruise
| Cruise Name | COR7/94 |
| Departure Date | 1994-06-10 |
| Arrival Date | 1994-07-06 |
| Principal Scientist(s) | Juan Brown (Ministry of Agriculture, Fisheries and Food Lowestoft Fisheries Laboratory) |
| Ship | RV Corystes |
Complete Cruise Metadata Report is available here
Fixed Station Information
No Fixed Station Information held for the Series
BODC Quality Control Flags
The following single character qualifying flags may be associated with one or more individual parameters with a data cycle:
| Flag | Description |
|---|---|
| Blank | Unqualified |
| < | Below detection limit |
| > | In excess of quoted value |
| A | Taxonomic flag for affinis (aff.) |
| B | Beginning of CTD Down/Up Cast |
| C | Taxonomic flag for confer (cf.) |
| D | Thermometric depth |
| E | End of CTD Down/Up Cast |
| G | Non-taxonomic biological characteristic uncertainty |
| H | Extrapolated value |
| I | Taxonomic flag for single species (sp.) |
| K | Improbable value - unknown quality control source |
| L | Improbable value - originator's quality control |
| M | Improbable value - BODC quality control |
| N | Null value |
| O | Improbable value - user quality control |
| P | Trace/calm |
| Q | Indeterminate |
| R | Replacement value |
| S | Estimated value |
| T | Interpolated value |
| U | Uncalibrated |
| W | Control value |
| X | Excessive difference |
SeaDataNet Quality Control Flags
The following single character qualifying flags may be associated with one or more individual parameters with a data cycle:
| Flag | Description |
|---|---|
| 0 | no quality control |
| 1 | good value |
| 2 | probably good value |
| 3 | probably bad value |
| 4 | bad value |
| 5 | changed value |
| 6 | value below detection |
| 7 | value in excess |
| 8 | interpolated value |
| 9 | missing value |
| A | value phenomenon uncertain |
| B | nominal value |
| Q | value below limit of quantification |
