Metadata Report for BODC Series Reference Number 610098
Metadata Summary
Problem Reports
Data Access Policy
Narrative Documents
Project Information
Data Activity or Cruise Information
Fixed Station Information
BODC Quality Flags
SeaDataNet Quality Flags
Metadata Summary
Data Description |
|||||||||||||||||||||||||||||||||||||||||||||||||||||||||||||||||||||||||||||
|
|||||||||||||||||||||||||||||||||||||||||||||||||||||||||||||||||||||||||||||
Data Identifiers |
|||||||||||||||||||||||||||||||||||||||||||||||||||||||||||||||||||||||||||||
|
|||||||||||||||||||||||||||||||||||||||||||||||||||||||||||||||||||||||||||||
Time Co-ordinates(UT) |
|||||||||||||||||||||||||||||||||||||||||||||||||||||||||||||||||||||||||||||
|
|||||||||||||||||||||||||||||||||||||||||||||||||||||||||||||||||||||||||||||
Spatial Co-ordinates | |||||||||||||||||||||||||||||||||||||||||||||||||||||||||||||||||||||||||||||
|
|||||||||||||||||||||||||||||||||||||||||||||||||||||||||||||||||||||||||||||
Parameters |
|||||||||||||||||||||||||||||||||||||||||||||||||||||||||||||||||||||||||||||
|
|||||||||||||||||||||||||||||||||||||||||||||||||||||||||||||||||||||||||||||
|
|||||||||||||||||||||||||||||||||||||||||||||||||||||||||||||||||||||||||||||
Problem Reports
No Problem Report Found in the Database
Data Access Policy
Public domain data
These data have no specific confidentiality restrictions for users. However, users must acknowledge data sources as it is not ethical to publish data without proper attribution. Any publication or other output resulting from usage of the data should include an acknowledgment.
The recommended acknowledgment is
"This study uses data from the data source/organisation/programme, provided by the British Oceanographic Data Centre and funded by the funding body."
Narrative Documents
Aquatracka fluorometer
The Chelsea Instruments Aquatracka is a logarithmic response fluorometer. It uses a pulsed (5.5 Hz) xenon light source discharging between 320 and 800 nm through a blue filter with a peak transmission of 420 nm and a bandwidth at half maximum of 100 nm. A red filter with sharp cut off, 10% transmission at 664 nm and 678 nm, is used to pass chlorophyll-a fluorescence to the sample photodiode.
The instrument may be deployed either in a through-flow tank, on a CTD frame or moored with a data logging package.
Further details can be found in the manufacturer's specification sheet.
Kipp and Zonen Pyranometer Model CM6B
The CM6B pyranometer is intended for routine global solar radiation measurement research on a level surface. The CM6B features a sixty-four thermocouple junction (series connected) sensing element. The sensing element is coated with a highly stable carbon based non-organic coating, which delivers excellent spectral absorption and long term stability characteristics. The sensing element is housed under two concentric fitting Schott K5 glass domes.
Specifications
| Dimensions (W x H) | 150.0 mm x 91.5 mm |
|---|---|
| Weight | 850 grams |
| Operating Temperature | -40°C to +80°C |
| Spectral Range | 305 - 2800 nm (50% points) |
| Sensitivity | 9 -15 µV/W/m2 |
| Impedance (nominal) | 70 - 100 ohm |
| Response Time (95%) | 30 sec |
| Non-linearity | < ± 1.2% (<1000 W/m2) |
| Temperature dependence of sensitivity | < ± 2% (-10 to +40°C) |
| Zero-offset due to temperature changes | < ± 4 W/m2 at 5 K/h temperature change |
SeaTech Transmissometer
Introduction
The transmissometer is designed to accurately measure the the amount of light transmitted by a modulated Light Emitting Diode (LED) through a fixed-length in-situ water column to a synchronous detector.
Specifications
- Water path length: 5 cm (for use in turbid waters) to 1 m (for use in clear ocean waters).
- Beam diameter: 15 mm
- Transmitted beam collimation: <3 milliradians
- Receiver acceptance angle (in water): <18 milliradians
- Light source wavelength: usually (but not exclusively) 660 nm (red light)
Notes
The instrument can be interfaced to Aanderaa RCM7 current meters. This is achieved by fitting the transmissometer in a slot cut into a customized RCM4-type vane.
A red LED (660 nm) is used for general applications looking at water column sediment load. However, green or blue LEDs can be fitted for specilised optics applications. The light source used is identified by the BODC parameter code.
Further details can be found in the manufacturer's Manual.
Falmouth Scientific Instruments (FSI) Thermosalinograph
FSI's Excell* Thermosalinograph uses FSI's patented internal field conductivity sensor (NXIC cell) and two precision platinum thermometers to provide salinity. Dual temperature sensors are used at the inlet and outlet of the thermosalinograph to assure an integrated temperature across the conductivity sensor. The system is cast in a urethane mold and the electronics are housed in an integral sealed (moisture-proof) housing. Flow through the system is via 3/4" hose pipe barbs.
Features
- Salinity Range 2 to 42 PSU
- Salinity Accuracy to ± 0.030 PSU
- Patented NXIC Internal-Field Inductive Conductivity Sensor
- Standards-Grade Platinum Resistance Thermometers
- Internal Reference and Self-Calibrating Electronics
- Standard Digital Output for Direct Computer Connection
*Copyright 2001, Falmouth Scientific, Inc. All rights reserved.
RRS Challenger CH129/96 Underway Instrumentation
Navigation
- GPS
- Ships gyro
- Electro Magnetic log
- Echo sounder
Meteorology
- Port and Starboard solar radiation meters
- Port and Starboard PAR radiance sensors
- Aneroid barometer
- Port and Starboard psychrometers
- Conventional cup and vane anemometer
Physics
- Thermosalinograph
- Transmissometer
Biology
- Fluorometer
- Oxygen sensor
Data Acquisition
Data logging and initial processing was handled by the RVS ABC system. The Level A sampling microcomputer digitises an input voltage, applies a time stamp and transfers the data via the Level B disk buffer onto the Level C where the data records are assembled into files. Sampling rates vary from 5 seconds to several minutes.
The level C included a suite of calibration software which was used to apply initial calibrations to convert raw ADC counts into engineering units. At the end of the cruise, the Level C disk base was transferred to BODC for further processing.
BODC Underway Data Processing Procedures
All underway data files are merged into a common file using time (GMT) as the primary linking key. Data logged as voltages (e.g. PAR irradiance, fluorometer and transmissometer) are converted to engineering units, wind velocity is corrected for ship's motion and heading and any additional calibrations are applied as appropriate. These are discussed in the individual instrument documentation.
Each data channel is visually inspected on a graphics workstation and any spikes or periods of dubious data are flagged as suspect. The capabilities of workstation screening software allows all possible comparative screening checks between channels (e.g. to ensure corrected wind velocity data have not been influenced by changes in ship's heading). The system also has the facility of simultaneously displaying the data and the ship's position on a map to enable data screening to take oceanographic climatology into account.
Bathymetry Processing notes
A SimRad EA500 deep echo sounder was operated throughout the cruise using a hull transducer. The data were sampled at 30 seconds intervals and were corrected for the sensor depth below sea surface (4 m) and for variation of sound velocity in sea water (Carter's Tables Corrections). The resulting channel was visually examined on a graphics workstation and suspect values were flagged.
Chlorophyll Processing Notes
Chlorophyll was measured by a Chelsea Instruments Mk2 Aquatracka fluorometer (Serial No. 246), mounted in a plastic bath continuously flushed by the non-toxic supply. The data were logged as voltages every 30 seconds. The data were examined graphically and any suspect data flagged.
A data set of 26 fluorometrically assayed extracted chlorophyll samples analysed onboard by SOC were made available for the fluorometer calibration. Calibration was achieved by regression of the log of the extracted chlorophyll value against the raw fluorometer voltage. The cruise data were treated as a single population.
- Chlorophyll (mg/m3) = exp (-1.97141 + 1.070103 * raw_voltage)
The adjusted R2 for this regression was 68 %. The mean error was zero with a standard deviation of 0.11.
Dissolved Oxygen Processing Notes
A YSI 6000 oxygen sensor (Serial No. 94E18708) was operated by SOC. A visual inspection of the data on a graphics workstation indicated a progressive decrease in the dissolved oxygen concentration during the cruise which was thought surprising as the water was cooling. An initial comparison of the data with determinations by Winkler titration revealed no significant correlation (R2<1%).
Consequently, instrumental drift was suspected and a drift calibration equation was obtained by multiple regression of the Winkler values against the YSI data and the time elapsed since the start of the cruise.
The resulting equation was:
- Winkler = YSI*0.383296 + time*1.961894 + 174.0658 (n=19; R2=41%)
This has been applied to the data. A check on the data after the calibration showed that for all points the Winkler and calibrated YSI values were within 10 µM and that the calibrated oxygen increased systematically during the cruise.
Meteorology - Air Temperature Processing Notes
The vector instrument psychrometers were mounted to the port and starboard sides of the foremast. The output voltages were logged at 5 second intervals, which were later reduced by averaging over 30 seconds, at BODC. The voltages were converted to temperatures using the following manufacturers calibrations:
| Instrument | Calibration |
|---|---|
| Port (Serial No. 2003) | Dry Bulb = 7.648506E-11(mV)3 + 1.839413E-6(mV)2 + 0.0384022(mV) - 10.36550 |
| Wet bulb = 1.303252E-10(mV)3 + 1.630955E-6(mV)2 + 0.0386373(mV) - 10.19036 | |
| Starboard (Serial No. 2004) | Dry bulb = 1.305221E-10(mV)3 + 1.721910E-6(mV)2 + 0.0384830(mV) - 10.39138 |
| Wet bulb = 2.793227E-10(mV)3 + 1.400990E-6(mV)2 + 0.0387425(mV) - 10.19036 |
The resulting data were visually inspected. Any obvious problems affecting one of the psychrometers but not the other was marked as suspect. In general, the agreement between the temperature sensors was very good, usually within 0.1°C.
Combined dry and wet bulb channels were then generated by averaging data from the port and starboard instruments. These combined data were again visually inspected on a graphics workstation and any dubious values were marked as suspect.
Data quality report
A number of noisy high temperature events affecting all sensors were identified in the record. Where these correlated with wind on the stern (relative wind direction between 45 and 135 for the way the conventional anemometer was mounted on Challenger) or changes in ship's course. These were attributed to stack thermal pollution and flagged suspect.
Meteorology - Barometric Pressure Processing Notes
The meteorological package included a Vaisala aneroid barometer mounted on the foremast platform. The data were sampled at 5 second intervals, which was later were reduced by averaging over 30 second intervals, at BODC. The data were visually inspected for 'spikes' and dubious values using a graphics workstation. No flagging was required.
No correction has been applied for the height of the instrument above sea level.
Meteorology - Photosynthetically Available Radiation (PAR) Processing Notes
The planar PAR radiance sensors were mounted on the meteorological package platform on the port and starboard sides of the foremast. The sensors were logged every 5 seconds as a voltage. The voltages were converted to W m-2 from volts by BODC using the following manufacturers calibrations:
| Sensor | Calibration |
|---|---|
| Port (Serial number 2273) | W m -2 = (V*1000*1000)/16.30 |
| Starboard (Serial Number 2274) | W m -2 = (V*1000*1000)/16.75 |
The data were reduced to 30 second sampling at BODC by averaging. The data were visually inspected on a graphics workstation and any 'spikes' found in the port and starboard channels were flagged suspect. A merged PAR channel was then produced by taking the maximum port and starboard values to eliminate sensor shading effects.
Meteorology - Total Solar Radiation Processing Notes
Kipp and Zonen solar radiation meters were mounted in gimballed housings on the port and starboard side of the 'Monkey Island' above the scientific plot. The starboard meter location was far from ideal as it was frequently shaded by a large satellite communication radome. The instruments were connected to a data integrator which converted the instrument voltages to W m-2and integrated the values producing 10 minute and running total integrations in kJ m-2.
At BODC, the ten minute integrations were merged into the underway file using custom software which divided the integrated energy by the integration interval thus producing an average irradiance value. The time stamp was also adjusted to the mid-point of the averaging interval by subtracting five minutes.
The resulting channels were visually examined on a graphics workstation. The inspection showed them to be much lower than expected, a problem first noticed on Challenger Cruise 128, for which no explanation or cure has been obtained. An empirical calibration using data from bright sunny days on Challenger Cruises 127 and 133 (cruises at similar latitudes and times of year) resulted in a scaling factor of 4, this scaling factor has been applied to the data from this cruise.
A merged solar irradiance channel was generated by taking the maximum of the port and starboard readings to minimise shading artefacts.
Meteorology - Wind Velocity Processing Notes
A Vaisala conventional cup and vane anemometer were mounted on the meteorological platform on the foremast with the cup to port and the vane to starboard. The cup anemometer generated relative wind speed (m/s) and direction (degrees). These were logged every 5 seconds but were later reduced, at BODC, to 30 second sampling by averaging wind speed and obtaining spot wind direction values from the 5 second stream. The wind speed was converted to knots by multiplying by 1.94, and the data were visually examined using a graphics workstation, any suspect values were flagged.
The data were corrected for ship speed and direction using the following method. Ship's heading and velocity were visually inspected on and graphics workstation and suspect values were flagged. The ship's heading was added to the relative wind direction and 260 degrees was subtracted to correct for the vane orientation. The resulting value was constrained to the range 0 - 359 by adding or subtracting 360 as appropriate. The ship's velocity over the ground was subtracted from the relative wind velocity to give absolute wind velocity. (Note that as the two velocities have opposite sign conventions, this is effectively an addition of the velocities when converted to uniform sign convention).
The data were again visually examined on a graphics workstation, comparative screening checks were made to ensure that the absolute wind velocity was truly independent of the ship's velocity and heading. Finally, the data were checked against entries in the ship's bridge log.
Optical Attenuance / Total Suspended Matter Processing Notes
Optical attenuance was measured using a SeaTech 660 nm (red) 25 cm pathlength transmissometer (Serial No. 116D) contained in a plastic water bath continuously flushed by the non-toxic supply. The data were logged as voltages every 30 seconds.
The data were corrected for light source decay by multiplying the voltages by a factor of 1.0111. This was based on an air reading of 4.756V taken on 16/10/1996 and the manufacturers air reading of 4.810 (23/07/1991) and blocked path readings of 0.000V and 0.0001V respectively.
Voltages were converted to percentage transmission by multiplying by 20. Any values outside the operational limits of the instrument (1-91.3%) were automatically flagged suspect.
The percentage transmission was converted to attenuance using the equation:
- Attenuance = -4.0 log(% Transmission/100)
Inspection of the data using a graphics workstation showed the data set to be extremely noisy at times due to bubbles forming in the non-toxic system during rough weather. These have been flagged out.
Attenuance was regressed against total suspended matter determinations to derive the equation below to allow attenuance to be expressed as suspended matter.
- Total Suspended Matter = (Attenuance + 1.0256) / 0.401906
The R2 for the regression was 97.7 % with a standard error of 0.84. The calibration covered the range 0 to 59 mg/l, values above this were automatically flagged.
Position Processing notes
Global Positioning System (GPS) was the primary navigation system used. When GPS fixes were unavailable the ship's position was determined by dead reckoning based upon the ship's gyro and EM log. Once a fix was obtained the surface drift velocity was computed. If this exceeded four knots the data were automatically flagged suspect, else a correction for the positional error due to surface drift was retrospectively applied over the period of dead reckoning.
Null values in the latitude and longitude channels were also identified and checked to ensure that the ship's speed over the ground did not exceed 15 knots.
Thermosalinograph Processing Notes
Temperature and salinity were measured using Falmouth Scientific Instruments thermosalinograph, incorporating a remote temperature sensor (thermolinear thermistor) and an inductive type conductivity cell mounted next to a second thermistor.
The ship is fitted with a non-toxic pumped sea water supply with water drawn from an inlet approximately 4 m below the surface. All ships discharges are to port to minimise risk of contamination. The thermosalinograph was fed from the non-toxic supply via a small header tank to remove bubbles. Tests on previous Challenger cruises have shown that the residence time from the inlet to the instrument housing is of the order of 50 seconds.
The remote temperature sensor was supplied by water from the intake side of the non-toxic supply (i.e. the sea surface temperature was measured at near-ambient temperature free from any warming effects induced by the pumping system). The conductivity cell and housing temperature thermistor were supplied from a flow-through system from the non-toxic supply.
The raw counts were calibrated to give conductivity and two temperature channels based on laboratory calibrations undertaken by RVS. Salinity was computed from the housing temperature and conductivity using UNESCO 1978 Practical Salinity Scale (Fofonoff and Millard, 1982). The data were sampled every 30 seconds.
The temperature and salinity channels were visually inspected on a graphic workstation and all suspect values were flagged.
Salinity
Salinity was back calibrated using a set of discrete salinity measurements taken from the non-toxic supply. Samples were collected in glass bottles to just below the neck and sealed with plastic stoppers. Batches of samples were left for at least 24 hours to reach thermal equilibrium in the constant temperature laboratory containing the salinometer before analysis.
Thirty-one samples collected between 16/10/1996 and 24/10/1996 were analysed during the cruise on a Guildline Autosal bench salinometer. Due to a problem with the Autosal onboard, the remaining 31 samples (covering the period 24/10/96 to 31/10/1996) were stored for later analysis, but subsequently no data have been provided to BODC on these samples. In order to supplement the calibration data set, calibrated surface (4 m) CTD data have been used (37 salinities).
Analysis of the differences between thermosalinograph and bottle salinities / CTD salinities revealed that the instrument drifted at the start of the cruise. This was complicated by additional jumps in the signal where segments of the signal appear offset from adjacent segments.
The salinity calibration was modelled by the equation:
- Corrected salinity = Raw salinity + (Cycle_number * Slope) + Offset
This correction model has been applied to the data with the following coefficients:
| Start date | End date | Slope | Offset |
|---|---|---|---|
| 16/10/1996 16:00 | 17/10/1996 21:56 | -0.00013 | 0.494 |
| 17/10/1996 21:57 | 28/10/1996 10:31 | 0.00000 | 0.027 |
| 28/10/1996 10:32 | 31/10/1996 17:46 | 0.00000 | 0.117 |
After calibration, the period before 17/10/1996 02:20 was still thought to be low for the English Channel. In the absence of further calibration data this could not be corrected and the data have therefore been flagged as suspect
Temperature
The remote (i.e. sea surface) temperature was back calibrated against readings from the Neil Brown Mk3B CTD which was held at the non-toxic inlet depth on each cast whilst the thermosalinograph was being logged. This showed that the thermosalinograph temperature was a function of temperature and was further complicated by jumps and drops in the signal where segments of the signal appear offset from adjacent segments.
The temperature calibration was modelled by the following equation:
- Corrected temperature = (Raw temperature * Slope) + Offset
This correction model has been applied to the data with the following coefficients:
| Start date | End date | Slope | Offset |
|---|---|---|---|
| 16/10/1996 16:00 | 20/10/1996 12:35 | 0.7087 | 2.9308 |
| 20/10/1996 12:36 | 20/10/1996 17:20 | 0.7087 | 3.0308 |
| 20/10/1996 17:21 | 20/10/1996 17:38 | 0.7087 | 3.0008 |
| 20/10/1996 17:39 | 24/10/1996 07:11 | 0.7087 | 2.9308 |
| 24/10/1996 07:12 | 25/10/1996 07:26 | 0.7087 | 2.8108 |
| 25/10/1996 07:27 | 25/10/1996 12:31 | 0.7087 | 2.8308 |
| 25/10/1996 12:32 | 31/10/1996 17:46 | 0.6448 | 0.117 |
Reference
Fofonoff, N.P., Millard Jr., R.C. (1983). Algorithms for computation of fundamental properties of seawater. UNESCO Technical Papers in Marine Science 44.
Project Information
ACSOE Marine Aerosol and Gas Exchange (MAGE)
Marine Aerosol and Gas Exchange (MAGE) was a component of the NERC Atmospheric Chemistry Studies in the Oceanic Environment (ACSOE) project aimed at studying chemical exchange across the air-sea interface.
The component included two experiments that were purely a part of ACSOE:
- Eastern Atlantic Experiment (spring 1996 and 1997)
- North Atlantic Experiment (June 1998)
In addition, MAGE contributed ship time in October 1996 to the EU ASGAMAGE project and this was included as an experiment within the organisational structure of MAGE.
Atmospheric Chemistry Studies in the Oceanic Environment (ACSOE)
Introduction
ACSOE was a NERC Thematic Research Programme which investigated the chemistry of the lower atmosphere (0-12 km) over the oceans. The studies aimed to bring about a clearer understanding of natural processes in the remote marine atmosphere, and how these processes are affected by atmospheric pollution originating from the continents. This information is vital to help understand regional and global-scale changes in atmospheric chemistry and climate.
Aims and Objectives
The £3.9 million NERC-funded programme was instigated as a major UK contribution to this international scientific effort between 1995 and 2000. The overarching aim of ACSOE was to investigate the processes that control the production and fate of trace gases and particles (condensation nuclei and aerosols) in the atmosphere over the oceans. For convenience it was divided into three separate but linked activities:
- MAGE, Marine Aerosol and Gas Exchange - to study air-sea exchange especially of atmospherically-important gases produced by marine microorganisms, such as dimethyl sulphide (DMS) and carbon dioxide (CO2)
- OXICOA, Oxidising Capacity of the Ocean Atmosphere - a study of the tropospheric ozone budget and underlying chemistry
- ACE, Aerosol Characterisation Experiment - to investigate the development of aerosols and clouds in European air spreading out into the Atlantic Ocean
The project had several objectives including:
- To determine the ozone budget of the background lower atmosphere (i.e. the troposphere)
- To study the sunlight-initiated chemistry of gases and particles (aerosol) in the background atmosphere
- To determine the importance of night-time chemistry
- To seek evidence for extensive halogen atom chemistry
- To measure air-sea gas transfer rates
- To assess the role of coastal and open ocean waters as sources of reactive gases
- To observe the effects of atmospheric deposition on oceanic biogeochemistry
- To investigate how clouds are affected by the chemistry of the inflowing air
- To identify within-cloud processes affecting particle size and chemistry
Project Co-ordination:
The programme was led by Professor Stuart Penkett of the University of East Anglia and involved over 100 scientists from leading British and International universities and institutes. Atmospheric data are held at BADC and data collected in the marine environment for the MAGE component of the programme are held at BODC.
Fieldwork description:
Fieldwork was carried out in 1996, 1997 and 1998 and involved air-, land- and sea-based measurements, coupled with modelling studies. Measurements were made at remote field sites (Mace Head, Ireland; Weybourne, Norfolk; Tenerife), from the NERC research vessels Challenger and Discovery and aboard the Meteorological Research Flight C-130 and the Cranfield Jetstream aircraft.
ASGAMAGE
Air Sea GAs Marine Aerosol and Gas Exchange (ASGAMAGE) was an EU MAST-3 project with ship time contributed by the NERC ACSOE project as part of its MAGE component.
The objectives of ASGAMAGE were:
- To find relationships between the transport coefficients for the gas fluxes and any relevant geophysical parameters.
- To test new methods and new equipment for the measurement of air-sea fluxes of CO2, DMS and other gases.
- To intercompare different methods and systems to measure the transfer velocity of trace gases over the sea.
- To find out whether and, if at all, under what conditions there can be a significant vertical gradients in the carbon dioxide concentration in the upper metres of the water column
The field experiments were carried out in May and October 1996 at and around the Meetpost Noordwijk research platform (9 km off the Dutch coast). During the second period the UK research vessel RRS Challenger operated in the vicinity of the platform. The instrument platform was heavily instrumented collecting oceanographic, atmospheric and meteorological parameters thus:
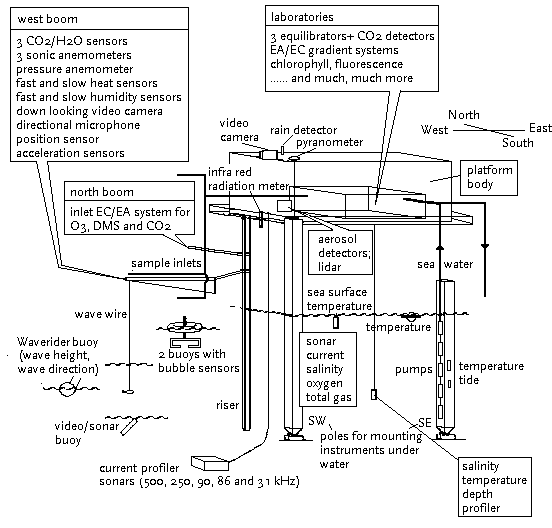
The instruments on the west boom were concerned with the measurement of gas transfer velocities using the eddy correlation technique.
The Challenger cruise was primarily concerned with the field measurement of air-sea gas transfer velocities using double (SF6/3He) and triple (SF6/3He/bacterial spores) tracers and the collection of basic oceanographic and meteorological data.
Data Activity or Cruise Information
Cruise
| Cruise Name | CH129 |
| Departure Date | 1996-10-16 |
| Arrival Date | 1996-10-31 |
| Principal Scientist(s) | Robert Upstill-Goddard (Newcastle University Department of Marine Science and Coastal Management) |
| Ship | RRS Challenger |
Complete Cruise Metadata Report is available here
Fixed Station Information
No Fixed Station Information held for the Series
BODC Quality Control Flags
The following single character qualifying flags may be associated with one or more individual parameters with a data cycle:
| Flag | Description |
|---|---|
| Blank | Unqualified |
| < | Below detection limit |
| > | In excess of quoted value |
| A | Taxonomic flag for affinis (aff.) |
| B | Beginning of CTD Down/Up Cast |
| C | Taxonomic flag for confer (cf.) |
| D | Thermometric depth |
| E | End of CTD Down/Up Cast |
| G | Non-taxonomic biological characteristic uncertainty |
| H | Extrapolated value |
| I | Taxonomic flag for single species (sp.) |
| K | Improbable value - unknown quality control source |
| L | Improbable value - originator's quality control |
| M | Improbable value - BODC quality control |
| N | Null value |
| O | Improbable value - user quality control |
| P | Trace/calm |
| Q | Indeterminate |
| R | Replacement value |
| S | Estimated value |
| T | Interpolated value |
| U | Uncalibrated |
| W | Control value |
| X | Excessive difference |
SeaDataNet Quality Control Flags
The following single character qualifying flags may be associated with one or more individual parameters with a data cycle:
| Flag | Description |
|---|---|
| 0 | no quality control |
| 1 | good value |
| 2 | probably good value |
| 3 | probably bad value |
| 4 | bad value |
| 5 | changed value |
| 6 | value below detection |
| 7 | value in excess |
| 8 | interpolated value |
| 9 | missing value |
| A | value phenomenon uncertain |
| B | nominal value |
| Q | value below limit of quantification |
