Metadata Report for BODC Series Reference Number 625859
Metadata Summary
Problem Reports
Data Access Policy
Narrative Documents
Project Information
Data Activity or Cruise Information
Fixed Station Information
BODC Quality Flags
SeaDataNet Quality Flags
Metadata Summary
Data Description |
|||||||||||||||||||||||||
|
|||||||||||||||||||||||||
Data Identifiers |
|||||||||||||||||||||||||
|
|||||||||||||||||||||||||
Time Co-ordinates(UT) |
|||||||||||||||||||||||||
|
|||||||||||||||||||||||||
Spatial Co-ordinates | |||||||||||||||||||||||||
|
|||||||||||||||||||||||||
Parameters |
|||||||||||||||||||||||||
|
|||||||||||||||||||||||||
|
|||||||||||||||||||||||||
Problem Reports
No Problem Report Found in the Database
Data Access Policy
Public domain data
These data have no specific confidentiality restrictions for users. However, users must acknowledge data sources as it is not ethical to publish data without proper attribution. Any publication or other output resulting from usage of the data should include an acknowledgment.
The recommended acknowledgment is
"This study uses data from the data source/organisation/programme, provided by the British Oceanographic Data Centre and funded by the funding body."
Narrative Documents
DATARING Datalogger Tide Gauge
The DATARING logger takes signals from Digiquartz pressure transducers and pressure operated gauges which are connected to the tidal pressure by a bubbler system. Float operated gauges can also supply a sea level signal to the datalogger. A number of sites also collect wind speed and direction data. The signals are processed to take account of water density, datum offset and calibration factors.
The data are averaged over a 15 minute period, with the centre points being o'clock, quarter past, half past, and quarter to. These readings are stored in internal memory and approximately 14 days can elapse before data are likely to be overwritten. The data can be accessed by POL and the Storm Tide Forecasting Service either locally or remotely over the telephone line. The data are retrieved on a weekly basis and appended onto the existing database, giving a continous record for each site.
Full and Mid Tide Bubbler Tide Gauge Systems
Full Tide Bubbler
The full tide bubbler system normally consists of two independent measuring points, unless a float gauge already exists, when this would form the second measuring system. The pressure points which are mounted underwater are similar in appearence to an inverted bucket with a copper nozzle mounted on the side. This nozzle is the actual measuring point.
A low flow of dry air (normally 7cm per min) is fed down an air tube to the top of the pressure point. When the air pressure in the line equals the pressure exerted by the column of water above it, then the excess air is released as bubbles through the copper nozzle. This means that the pressure in the air line is proportional to the weight of the water column.
Mid Tide Bubbler
The operation of the mid tide bubbler is similar to that of the full tide system (described above), except that the measuring point is mounted at the mid tide height. This means that the pressure point is only immersed for half of the tidal cycle. When the measuring point is exposed it can be accurately levelled into the geodetic network. Once this is accomplished the full tide pressure points can be fitted to match the tidal curve produced by the mid tide pressure point, thereby connecting them to the geodetic network.
Project Information
UK Tide Gauge Network
The national network of 'Class A' sea level gauges are deployed at 47 sites around the coast of the U.K.
The network was established after the serious flooding of the Thames estuary in 1953, which resulted from a violent storm in the North Sea.
The network sets out to obtain high quality tidal information through telemetry and provide warning of any possible flooding of coastal locations around the British Isles.
Data Activity or Cruise Information
No Data Activity or Cruise Information held for the Series
Fixed Station Information
Fixed Station Information
| Station Name | Barmouth |
| Category | Coastal location |
| Latitude | 52° 43.14' N |
| Longitude | 4° 2.71' W |
| Water depth below MSL |
Barmouth (Wales) Site History
History Summary
| Station name | Barmouth |
|---|---|
| Country | Wales U.K. |
| Latitude of measuring point | 52° 43' 09.4"N |
| Longitude of measuring point | 04° 02' 41.9"W |
| OS grid ref. of measuring point | SH 6197 1548 |
| Datum reference | All data refer to Admiralty Chart Datum (ACD) |
| Time reference | GMT (hours 00-23) |
| Contributor | Tide Gauge Inspectorate (TGI), Proudman Oceanographic Laboratory, Joseph Proudman Building, 6 Brownlow Street, Liverpool, L3 5DA, U.K. |
| Instrument type | 1991 - Dataring system with two full tide pressure points installed. 2005 - Mid tide installed. 18/11/2011 - SWANTEL S500 logger (includes static head correction) installed. |
| Site of measuring point | The measuring points are attached to the first leg of the railway bridge in the deep channel. |
| Position of tide gauge building | SH 6197 1548 - The Tide Gauge is located in the toll booth on the North end of Barmouth railway bridge which crosses river Mawddach. |
| Observational period | 1991 - 2003, 2005 - 2011 |
Benchmark descriptions
| Benchmark | OS grid ref. | Description | Height above ODN (m) |
|---|---|---|---|
| TGBM | SH 6197 1548 | NBM rivet concrete 2.9M NE wall junction | 7.923 |
| Aux1 | SH 6173 1558 | Rivet step NE side of road NW entrance path | 8.911 |
| Aux2 | SH 6186 1556 | Rivet wall SE side road 17.6M E steps | 15.333 |
| Aux3 | SH 6196 1550 | Rivet step E side lifeboat station | 7.738 |
ODN = Ordnance Datum Newlyn
Datum information
Please see document 83051
Quality Assessment
All data have been compared with the current Harmonic Constants library, and residuals checked. Records have been visually inspected for spikes, datum shifts and timing errors.
The original processing for 1992 has left the file with some interpolated points.
Please Note: where multiple channels are available, ASLVBG02 is the primary channel. Completeness index has been calculated for the primary channel only.
| Period | Parameter | Missing data | Suspect data | Completeness index (%) | Sample interval |
|---|---|---|---|---|---|
| 1991 | ASLVBG02 | 001-283 | 316 | 22 | 15 minutes |
| 1992 | ASLVBG01,ASLVBG02 | 048, 160-165, 168-181, 209-218, 223-231, 251-255, 258-262, 266-267 | None | 88 | 15 minutes |
| 1993 | ASLVBG01,ASLVBG02 | 137-141 | None | 99 | 15 minutes |
| 1994 | ASLVBG01,ASLVBG02 | None | None | 100 | 15 minutes |
| 1995 | ASLVBG01,ASLVBG02 | None | 110-117 | 100 | 15 minutes |
| 1996 | ASLVBG01,ASLVBG02 | None | None | 100 | 15 minutes |
| 1997 | ASLVBG01,ASLVBG02 | None | None | 100 | 15 minutes |
| 1998 | ASLVBG01,ASLVBG02 | None | None | 100 | 15 minutes |
| 1999 | ASLVBG01,ASLVBG02 | 173-252, 257-258 | None | 78 | 15 minutes |
| 2000 | ASLVBG01,ASLVBG02 | 060 | None | 99 | 15 minutes |
| 2001 | ASLVBG01,ASLVBG02 | None | None | 100 | 15 minutes |
| 2002 | ASLVBG01,ASLVBG02 | None | None | 100 | 15 minutes |
| 2003 | ASLVBG01,ASLVBG02 | 168-182, 196-365 | 136-168, 182-196 | 50 | 15 minutes |
| 2004 | Off Network | ||||
| 2005 | ASLVBG01 | 001-069, 081 | 069-081, 176-187 | ||
| ASLVBG02 | 001-069, 081 | 069, 176-187 | 81 | 15 minutes | |
| ASLVBH01 | 001-069, 081 | 069-081 | |||
| 2006 | ASLVBG01 | 060-064, 071-073, 102, 214-216 | 333-337, 345-365 | ||
| ASLVBG02 | 060-064, 071-073, 102, 214-216 | 149-151 | 98 | 15 minutes | |
| ASLVBH01 | 060-064, 071-073, 102, 214-216 | None | |||
| 2007 | ASLVBG01 | 199-205,304-306,346-365 | 001-003,005 | ||
| ASLVBG02 | 199-205,304-306,346-365 | 073-079,082-184 | 93 | 15 minutes | |
| ASLVBH01 | 199-205,304-306,346-365 | None | |||
| 2008 | ASLVBG01 | 001-011 | 240-243 | ||
| ASLVBG02 | 001-011 | 030-038,040-041,072-078,086-128,306-309 | 97 | 15 minutes | |
| ASLVBH01 | 001-011 | None | |||
| 2009 | ASLVBG01 | 076,189 | 090-130,132-133,161-165,297-304,308-311,318-322,325-327,329-337 | ||
| ASLVBG02 | 076,189 | 024-077,150-189,189-218,247-265 | 99 | 15 minutes | |
| ASLVBH01 | 076,189 | None | |||
| 2010 | ASLVBG01, ASLVBH01 | None | None | ||
| ASLVBG02 | None | 149-152,163-166,267-269,280-309,329-365 | 100 | 15 minutes | |
| 2011 | ASLVBG01, ASLVBH01 | 321,322 | 322 | ||
| ASLVBG02 | 321,322 | 001-107,143-146,148,152-154,186-198,201-202,214-241,243-244,246-256,259-270,276-281,300-316,322,323-365 | 99 | 15 minutes |
Barmouth (Wales) Datum Information 1991-
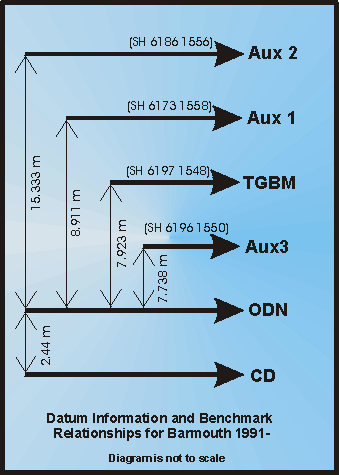
Benchmark Relationships
- TGZ = Chart Datum = 2.44m below ODN
- TGZ = Chart Datum = 10.363m below TGBM
- TGZ = Chart Datum = 11.351m below Aux 1
- TGZ = Chart Datum = 17.773m below Aux 2
- TGZ = Chart Datum = 10.178m below Aux 3
Glossary
- TGZ = Tide Gauge Zero
- TGBM = Tide Gauge Benchmark
- AUX = Auxiliary Benchmark
- ODN = Ordnance Datum Newlyn
- CD = Chart Datum
Related Fixed Station activities are detailed in Appendix 1
BODC Quality Control Flags
The following single character qualifying flags may be associated with one or more individual parameters with a data cycle:
| Flag | Description |
|---|---|
| Blank | Unqualified |
| < | Below detection limit |
| > | In excess of quoted value |
| A | Taxonomic flag for affinis (aff.) |
| B | Beginning of CTD Down/Up Cast |
| C | Taxonomic flag for confer (cf.) |
| D | Thermometric depth |
| E | End of CTD Down/Up Cast |
| G | Non-taxonomic biological characteristic uncertainty |
| H | Extrapolated value |
| I | Taxonomic flag for single species (sp.) |
| K | Improbable value - unknown quality control source |
| L | Improbable value - originator's quality control |
| M | Improbable value - BODC quality control |
| N | Null value |
| O | Improbable value - user quality control |
| P | Trace/calm |
| Q | Indeterminate |
| R | Replacement value |
| S | Estimated value |
| T | Interpolated value |
| U | Uncalibrated |
| W | Control value |
| X | Excessive difference |
SeaDataNet Quality Control Flags
The following single character qualifying flags may be associated with one or more individual parameters with a data cycle:
| Flag | Description |
|---|---|
| 0 | no quality control |
| 1 | good value |
| 2 | probably good value |
| 3 | probably bad value |
| 4 | bad value |
| 5 | changed value |
| 6 | value below detection |
| 7 | value in excess |
| 8 | interpolated value |
| 9 | missing value |
| A | value phenomenon uncertain |
| B | nominal value |
| Q | value below limit of quantification |
Appendix 1: Barmouth
Related series for this Fixed Station are presented in the table below. Further information can be found by following the appropriate links.
If you are interested in these series, please be aware we offer a multiple file download service. Should your credentials be insufficient for automatic download, the service also offers a referral to our Enquiries Officer who may be able to negotiate access.
| Series Identifier | Data Category | Start date/time | Start position | Cruise |
|---|---|---|---|---|
| 310280 | Sea surface elevation -unspecified | 1991-10-10 23:00:00 | 52.71906 N, 4.04517 W | Not applicable |
| 303314 | Sea surface elevation -unspecified | 1992-01-01 00:00:00 | 52.71906 N, 4.04517 W | Not applicable |
| 537571 | Sea surface elevation -unspecified | 1993-01-01 00:14:59 | 52.71906 N, 4.04517 W | Not applicable |
| 537583 | Sea surface elevation -unspecified | 1994-01-01 00:14:59 | 52.71906 N, 4.04517 W | Not applicable |
| 537595 | Sea surface elevation -unspecified | 1995-01-01 00:14:59 | 52.71906 N, 4.04517 W | Not applicable |
| 537602 | Sea surface elevation -unspecified | 1996-01-01 00:14:59 | 52.71906 N, 4.04517 W | Not applicable |
| 537614 | Sea surface elevation -unspecified | 1997-01-01 00:14:59 | 52.71906 N, 4.04517 W | Not applicable |
| 537626 | Sea surface elevation -unspecified | 1998-01-01 00:14:59 | 52.71906 N, 4.04517 W | Not applicable |
| 537638 | Sea surface elevation -unspecified | 1999-01-01 00:14:59 | 52.71906 N, 4.04517 W | Not applicable |
| 564741 | Sea surface elevation -unspecified | 2000-01-01 00:00:00 | 52.71906 N, 4.04517 W | Not applicable |
| 578146 | Sea surface elevation -unspecified | 2001-01-01 00:14:59 | 52.71906 N, 4.04517 W | Not applicable |
| 593272 | Sea surface elevation -unspecified | 2002-01-01 00:00:00 | 52.71906 N, 4.04517 W | Not applicable |
| 662993 | Sea surface elevation -unspecified | 2005-03-10 14:30:00 | 52.71906 N, 4.04517 W | Not applicable |
| 697409 | Sea surface elevation -unspecified | 2006-01-01 00:00:00 | 52.71906 N, 4.04517 W | Not applicable |
| 846288 | Sea surface elevation -unspecified | 2007-01-01 00:00:00 | 52.71906 N, 4.04517 W | Not applicable |
| 846774 | Sea surface elevation -unspecified | 2008-01-11 11:15:00 | 52.71906 N, 4.04517 W | Not applicable |
| 1110644 | Sea surface elevation -unspecified | 2009-01-01 00:00:00 | 52.71906 N, 4.04517 W | Not applicable |
| 1110656 | Sea surface elevation -unspecified | 2010-01-01 00:00:00 | 52.71906 N, 4.04517 W | Not applicable |
| 1110668 | Sea surface elevation -unspecified | 2011-01-01 00:00:00 | 52.71906 N, 4.04517 W | Not applicable |
