Metadata Report for BODC Series Reference Number 681966
Metadata Summary
Problem Reports
Data Access Policy
Narrative Documents
Project Information
Data Activity or Cruise Information
Fixed Station Information
BODC Quality Flags
SeaDataNet Quality Flags
Metadata Summary
Data Description |
|||||||||||||||||||||||||||||||||||||||||||||||||||||||||
|
|||||||||||||||||||||||||||||||||||||||||||||||||||||||||
Data Identifiers |
|||||||||||||||||||||||||||||||||||||||||||||||||||||||||
|
|||||||||||||||||||||||||||||||||||||||||||||||||||||||||
Time Co-ordinates(UT) |
|||||||||||||||||||||||||||||||||||||||||||||||||||||||||
|
|||||||||||||||||||||||||||||||||||||||||||||||||||||||||
Spatial Co-ordinates | |||||||||||||||||||||||||||||||||||||||||||||||||||||||||
|
|||||||||||||||||||||||||||||||||||||||||||||||||||||||||
Parameters |
|||||||||||||||||||||||||||||||||||||||||||||||||||||||||
|
|||||||||||||||||||||||||||||||||||||||||||||||||||||||||
|
|||||||||||||||||||||||||||||||||||||||||||||||||||||||||
Problem Reports
No Problem Report Found in the Database
Data Quality Report
There were gaps in the dataset due to computer failures as follows -
| Data Gap | Duration |
|---|---|
| 30/04/05 17:10:51 to 30/04/05 17:45:27 | 34.5 minutes |
| 24/05/05 15:13:21 to 24/05/05 17:57:59 | 165 minutes |
| 28/05/05 15:27:59 to 28/05/05 16:14:39 | 40.7 minutes |
| 30/05/05 09:11:27 to 30/05/05 09:32:35 | 21.1 minutes |
| 30/05/05 09:32:35 to 30/05/05 09:46:42 | 14.1 minutes |
| 01/06/05 20:16:29 to 01/06/05 21:04:05 | 47.5 minutes |
| 03/06/05 22:44:41 to 04/06/05 01:04:31 | 138 minutes |
| 06/06/05 19:30:31 to 06/06/05 20:03:30 | 33 minutes |
| 08/06/05 10:35:29 to 08/06/05 10:52:59 | 17.5 minutes |
| 09/06/05 05:10:59 to 09/06/05 05:22:32 | 11.5 minutes |
Data Access Policy
Open Data
These data have no specific confidentiality restrictions for users. However, users must acknowledge data sources as it is not ethical to publish data without proper attribution. Any publication or other output resulting from usage of the data should include an acknowledgment.
If the Information Provider does not provide a specific attribution statement, or if you are using Information from several Information Providers and multiple attributions are not practical in your product or application, you may consider using the following:
"Contains public sector information licensed under the Open Government Licence v1.0."
Narrative Documents
RD Instruments 150kHz Narrow Band Acoustic Doppler Current Profiler
Specifications
| Water velocity measurements relative to the ADCP | |
|---|---|
| Accuracy (long term) | 0.5 % of measured velocity ± 0.5 cm/s |
| Statistical uncertainty for one ping (cm/s) | Depth cell length of 4, 8, 16 m = 26, 13, 6.5 respectively (for horizontal velocities using the standard transducer) |
| Ping rate (pings per second) | 2 (100 pings averaged in ADCP) |
| Maximum profiling range (meters) | 290 |
| Minimum range to start of first depth cell (meters) | 4 |
| Number of depth cells | 8 to 128 |
| Velocity range | ± 0.01 to 9.5 m/s (horizontal) |
| Velocity resolution (cm/s) | 0.25 or 0.125 |
| Velocity measurements relative to the bottom and measurement of bottom depth | |
| Accuracy | 0.5% of measured velocity ± 0.5 cm/s |
| Statistical uncertainty of one ping (percent of measured velocity) | 3.5 (for horizontal velocities using the standard transducer) |
| Ping rate (pings per second) | 0.9 (100 pings averaged in ADCP) |
| Depth range | 290 (the maximum depth range can be up to 1.5 times greater than specified) |
| Bottom depth resolution (meters) | 4 |
| Velocity range | ± 0.01 to 9.5 m/s (horizontal) |
| Velocity resolution (cm/s) | 0.25 or 0.125 |
| Measurement of echo intensity | |
| Accuracy (with temperature correction) | Before calibration : ± 8 dB, After calibration: ± 3 dB |
| Statistical uncertainty for one ping | Approximately ± 5 dB |
| Ping rate (pings per second) | 2 (100 pings averaged in ADCP) |
| Profiling range (meters less than for water velocity measurement) | 64 |
| Number of depth cells | 8 to 128 |
| Dynamic range | 80 dB |
| Resolution | 0.45 dB typical (temperature/system dependent) |
| Data communication | |
| Interface | Modified RS-232/422 serial at baud rates of 300-19,200 |
| Data format | Binary (8-bit) or ASCII (76-character) lines separated by a carriage return/line feed. |
| Data storage capacity | 2 MB (standard); expandable to 40 MB in 1 and/or 2 MB increments |
| Power requirements | |
| ADCP electronics | Voltage range (VDC) 6-12; Standby current (amps) 0.0002; Operate current (amps) 0.24; Peak current (amps) 0.5 |
| transmit and EPROM recorder | Voltage range (VDC) 20-40; Standby current (amps) 0.0001; Operate current (amps) 0.10; Peak current (amps) 2.0 |
| CTD sensors | Voltage range (VDC) 12-20; Standby current (amps) 0.0001; Operate current (amps) 0.022; Peak current (amps) 0.05 |
| Temperature sensor | |
| Accuracy | ± 0.2°C |
| Time constant | Approximately 2 minutes |
| Range | -5° to 45°C |
| Resolution | 0.012°C |
| Environmental | |
| Operating temperature | -5°C to 40°C |
| Humidity | Must be non-condensing |
| Depth capability | 35 meters (transducer only) |
| Physical characteristics | |
| Weight in air | 67.6 kg |
| Weight in water | 25.0 |
| Diameter | 45.9 cm |
| Length | 141.4 cm |
CD171 VMADCP BODC Processing
The data were received in Pstar format in 48 171adpNNN.abs files (where NNN = Julian Day), one for each day of the cruise. The first two data series were taken when the ship was alongside in port before the cruise began. These data are therefore not presented in the final dataset.
The files were transferred (using transfer trn339) to QXF format, a BODC-defined subset of NetCDF and BODC's format for 2-dimensional data storage. Null data were set to the appropriate absent data values for the code in the BODC parameter dictionary and flagged 'N', data outside parameter dictionary range flagged 'M' and already flagged data given an 'L' flag.
Transfer Mapping
The following table shows a summary of the variables transferred.
| Original Parameter | Units | Description | BODC Parameter | BODC Units | Comments |
|---|---|---|---|---|---|
| time | s | Dummy variable | ZZZZZZ01 | None | Requirement of transfer |
| lat | o | Latitude North | ALATZZ01 | o | None |
| lon | o | Longitude East | ALONZZ01 | o | None |
| bindepth | m | Depth below sea surface (ADCP bin) | DBINAA01 | m | None |
| evelcal | cm/s | Eastward current velocity (relative to moving platform) in the water column by shipbourne acoustic doppler current profiler (ADCP) | LREWAS01 | cm/s | Transferred for BODC screening purposes, however dropped from final data set. |
| nvelcal | cm/s | Northward current velocity (relative to moving platform) in the water column by shipbourne acoustic doppler current profiler (ADCP) | LRNSAS01 | cm/s | Transferred for BODC screening purposes, however dropped from in final data set. |
| abvse | cm/s | Eastward current velocity (Eulerian) in the water column by shipbourne acoustic doppler current profiler (ADCP) | LCEWAS01 | cm/s | None |
| abvsn | cm/s | Northward current velocity (Eulerian) in the water column by shipbourne acoustic doppler current profiler (ADCP) | LCNSAS01 | cm/s | None |
| velvert | cm/s | Upward current velocity (Eulerian) in the water column by shipbourne acoustic doppler current profiler (ADCP) | LRZAAS01 | cm/s | None |
| velerr | cm/s | Current velocity error in the water column by shipbourne acoustic current doppler profiler (ADCP) | LERRAS01 | cm/s | None |
| ampl | db | Signal return amplitude in the water column by shipbourne acoustic doppler current profiler (ADCP) | ASAMAS01 | cm/s | None |
| good | % | Acceptable proportion of signal returns by shipbourne acoustic doppler current profiler (ADCP) | PCGDAP01 | % | None |
| ve | cm/s | Eastward velocity (over ground) of measurement platform by unspecified GPS system | APEWGP01 | cm/s | Originally transferred for BODC screening purposes and would normally be dropped before archive. However due to the problems associated with the data these have been retained. |
| vn | cm/s | Northward velocity (over ground) of measurement platform by unspecified GPS system | APNSGP01 | cm/s | Originally transferred for BODC screening purposes and would normally be dropped before archive. However due to the problems associated with the data these have been retained. |
Time and date were received as time, njday, hh, mm, ss, hhmmss and jday. These were converted to the following variables.
| Original Parameter | Units | Description | BODC Parameter Code | BODC Units | Comments |
|---|---|---|---|---|---|
| njday, jday | Days, days | Date (time from 00:00 01/01/1760 to 00:00 UT on day) | AADYAA01 | Days | None |
| hh, mm, ss | Hours, minutes, seconds | Date (time from 00:00 01/01/1760 to 00:00 UT on day) | AAFDZZ01 | Time (time between 00:00 UT and timestamp) | None |
Distance travelled (originator's identifier distrun) was not loaded.
Quality Control and Screening
The reformatted data were visualised using the in house EDSERPLO software.
Originator's Data Processing
Sampling Strategy
The vessel mounted ADCP was run constantly throughout the cruise, however several gaps occur in the dataset due to computer crashes and for reconfiguration.
Data Processing
VMADCP data were processed in daily segments using Pstar software. Full details of the ship board processing are available in the cruise report (see below). Processing included the following steps -
- Reading in navigation data from the RVS data stream to Pstar format, calculating the ship's velocity and appending it to the master cruise file.
- Reading in heading data from RVS gyro data stream to Pstar format, performing a nominal check on data control and appending to the master cruise file.
- Reading in data from the RVS data stream for the Ashtech GPS receiver. Performing preliminary quality control checks.
- Merging the Ashtec GPS data with the gyro heading data and calculating the difference in headings.
- Edited the merged Ashtech file and averaged the data to 2 minutes.
- Manually picking out any remaining spikes and linearly interpolating between missing data values to create a smooth data stream and appended to a master file for merging with ADCP data.
- Reading in the ADCP data stream into Pstar. Data split into gridded depth dependent data and non-gridded independent Velocities and amplitude were scaled and the time stamp moved to the centre of each bin.
- Depth of each bin determined from user supplied data.
- East/North velocities converted to speed and direction, heading added to the direction and velocities converted back to East/North.
- Calibrated for any offset between the ADCP unit and the forward axis of the ship.
- Data merged with navigation file, ship velocity calculated and from this the absolute water velocities are calculated.
Cruise Report
Further information is available from the cruise report
VMADCP Calibration
The following is adapted from the cruise report.
Bottom Track Data
The misalignment angle between the fore/aft directions of the vessel mounted ADCP and the ship is given by subtracting the observed ADCP bottom track data from the direction of motion of the ship, calculated from the north and eastward components of the ship's velocity.
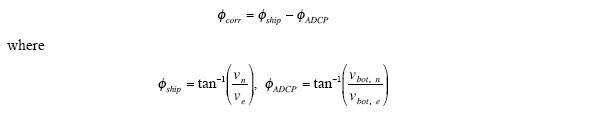
The speed correction was calculated from the ratio of the, known, vessel speed and the measured ADCP speed.
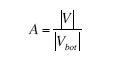
Using the bottom track data the following corrections were calculated : φ = 3.5o, A = 1.0002
Post calibration the remaining residuals were : φ = 0.1007o ±0.3293 and A = 1.000 ±0.0056
Water Track Data
In addition to the standard vessel mounted ADCP calibration technique described above, a comparison calibration was done using water track data. This was restricted to periods where absolute water velocity was small in comparison to the ships velocity. The angle of motion of the water was assumed to be random when considered over the period of the calibration.
Data were considered for both the entire cruise and in 10 day sections. The originators comment that the early data from shallow western shelf regions compare favourably with those from the bottom track data, while this comparison deteriorated in later periods as the ship steamed into deeper water.
PHINS (Inertial Navigation System)
The PHINS fibre optic gyro system was trialled during the cruise. A heading dataset was produced alongside that taken from the Ashtech GPS system and used to carry out another calibration for comparison with that outlined above. PHINS provided a higher resolution, more complete and less noisy heading dataset yielding values of : φ = 3.0o, A = 1.0002
Remaining residuals were : φ = -0.654o ±0.333 and A = 1.000 ±0.0056
Chernikeeff E-M Log Calibration
Data from the ship's speed log were compared with a near surface bin of the ADCP. The log was found to be displaying higher values relative to the ADCP, with a positive offset at low speed.
The log had been calibrated with data from a calibration carried out on an earlier cruise (CD160), so a new calibration was prepared using the engine revs/E-M log speed from one leg of the CD160 calibration. A calibration table mapping E-M log speed (a) into true speed through the water (s), details of which can be found in the cruise report (see below). The first calibration was reviewed and found to be producing speeds lower than the true speed as the cruise progressed. A new calibration table was prepared accordingly. Subsequently it was discovered that beam 3 on the VMADCP was faulty and had been for some time and was switched to 3-beam solutions. The conclusion of all of these events was that the E-M log data aquired during the cruise should not be used for scientific purposes, due to the time-varying drift of calibration.
Cruise Report
Further information is available from the cruise report
Project Information
36 North Project
Project Overview
The 36 North project aims to investigate and understand the influences on global climate regulation, with a focus on the current role of the North Atlantic subtropical gyre.
It will seek to further understand the mechanisms which control the heat transport, nutrient and carbon budgets of the North Atlantic Ocean. This will impact on our understanding of how the ocean is warming, phytoplankton growth and how oceans uptake CO2.
This project brings together scientists from the National Oceanography Centre, Southampton (NOCS), the University of Liverpool, the Plymouth Marine Laboratory (PML) and the University of East Anglia (UEA). It will run from 1 October 2004 to 30 September 2008 and is funded by a Natural Environment Research Council consortium grant.
Aims
The main aims include:
- To examine how nitrogen, phosphorous and carbon bugets are closed.
- To examine how nutrient and carbon budgets are controlled.
- To assess the heat flux across the 36 N section (and poleward using World Climate Circulation Experiment (WOCE) data).
Methods
This will be achieved by:
- A detailed, hydrographic survey along 36N with a complete biogeochemical analysis of data collected during RRS Charles Darwin cruise 1 May - 15 June 2005 (CD171).
- The development and application of inverse and coupled biogeochemical, isopycnic circulation models.
- Comparison with historical data collected by RRS Discovery during 4 April - 10 May 2004 (D279).
- Comparison with three additional North Atlantic cruises undertaken in 2004/2005, funded under the Rapid Climate Change (RAPID) and Atlantic Meridional Transect (AMT) programmes.
Data Activity or Cruise Information
Cruise
| Cruise Name | CD171 |
| Departure Date | 2005-05-01 |
| Arrival Date | 2005-06-15 |
| Principal Scientist(s) | Elaine McDonagh (National Oceanography Centre, Southampton) |
| Ship | RRS Charles Darwin |
Complete Cruise Metadata Report is available here
Fixed Station Information
No Fixed Station Information held for the Series
BODC Quality Control Flags
The following single character qualifying flags may be associated with one or more individual parameters with a data cycle:
| Flag | Description |
|---|---|
| Blank | Unqualified |
| < | Below detection limit |
| > | In excess of quoted value |
| A | Taxonomic flag for affinis (aff.) |
| B | Beginning of CTD Down/Up Cast |
| C | Taxonomic flag for confer (cf.) |
| D | Thermometric depth |
| E | End of CTD Down/Up Cast |
| G | Non-taxonomic biological characteristic uncertainty |
| H | Extrapolated value |
| I | Taxonomic flag for single species (sp.) |
| K | Improbable value - unknown quality control source |
| L | Improbable value - originator's quality control |
| M | Improbable value - BODC quality control |
| N | Null value |
| O | Improbable value - user quality control |
| P | Trace/calm |
| Q | Indeterminate |
| R | Replacement value |
| S | Estimated value |
| T | Interpolated value |
| U | Uncalibrated |
| W | Control value |
| X | Excessive difference |
SeaDataNet Quality Control Flags
The following single character qualifying flags may be associated with one or more individual parameters with a data cycle:
| Flag | Description |
|---|---|
| 0 | no quality control |
| 1 | good value |
| 2 | probably good value |
| 3 | probably bad value |
| 4 | bad value |
| 5 | changed value |
| 6 | value below detection |
| 7 | value in excess |
| 8 | interpolated value |
| 9 | missing value |
| A | value phenomenon uncertain |
| B | nominal value |
| Q | value below limit of quantification |
