Metadata Report for BODC Series Reference Number 972155
Metadata Summary
Problem Reports
Data Access Policy
Narrative Documents
Project Information
Data Activity or Cruise Information
Fixed Station Information
BODC Quality Flags
SeaDataNet Quality Flags
Metadata Summary
Data Description |
|||||||||||||||||||||||||
|
|||||||||||||||||||||||||
Data Identifiers |
|||||||||||||||||||||||||
|
|||||||||||||||||||||||||
Time Co-ordinates(UT) |
|||||||||||||||||||||||||
|
|||||||||||||||||||||||||
Spatial Co-ordinates | |||||||||||||||||||||||||
|
|||||||||||||||||||||||||
Parameters |
|||||||||||||||||||||||||
|
|||||||||||||||||||||||||
|
|||||||||||||||||||||||||
Problem Reports
No Problem Report Found in the Database
Data Access Policy
Open Data
These data have no specific confidentiality restrictions for users. However, users must acknowledge data sources as it is not ethical to publish data without proper attribution. Any publication or other output resulting from usage of the data should include an acknowledgment.
If the Information Provider does not provide a specific attribution statement, or if you are using Information from several Information Providers and multiple attributions are not practical in your product or application, you may consider using the following:
"Contains public sector information licensed under the Open Government Licence v1.0."
Narrative Documents
Neil Brown MK3 CTD
The Neil Brown MK3 conductivity-temperature-depth (CTD) profiler consists of an integral unit containing pressure, temperature and conductivity sensors with an optional dissolved oxygen sensor in a pressure-hardened casing. The most widely used variant in the 1980s and 1990s was the MK3B. An upgrade to this, the MK3C, was developed to meet the requirements of the WOCE project.
The MK3C includes a low hysteresis, titanium strain gauge pressure transducer. The transducer temperature is measured separately, allowing correction for the effects of temperature on pressure measurements. The MK3C conductivity cell features a free flow, internal field design that eliminates ducted pumping and is not affected by external metallic objects such as guard cages and external sensors.
Additional optional sensors include pH and a pressure-temperature fluorometer. The instrument is no longer in production, but is supported (repair and calibration) by General Oceanics.
Specifications
These specification apply to the MK3C version.
| Pressure | Temperature | Conductivity | |
| Range | 6500 m 3200 m (optional) | -3 to 32°C | 1 to 6.5 S cm-1 |
| Accuracy | 0.0015% FS 0.03% FS < 1 msec | 0.0005°C 0.003°C < 30 msec | 0.0001 S cm-1 0.0003 S cm-1 < 30 msec |
Further details can be found in the specification sheet.
RRS Charles Darwin 62A CTD Data Documentation
Introduction
CTD profile data are presented from the ERS-1 validation cruise Charles Darwin 62A, as reported by Srokosz et al. (1992). The data collection and calibration procedures have been described by Tokmakian et al. (1992).
Instrumentation and Methodology
Instrumentation Summary
The CTD profiles were taken with a Neil Brown Systems MkIIIb CTD mounted beneath a bottle rosette. The CTD was fitted with a pressure sensor, conductivity cell, platinum resistance thermometer, a dissolved oxygen sensor, an Aquatracka fluorometer, a Sea Tech 25cm path transmissometer and an IOS 10kHz pinger.
Data Acquisition
Lowering rates for the CTD package were generally in the range 0.5-1.0ms-1 but could be up to 1.5ms-1. CTD data were logged at 16 frames per second. The CTD deck unit passes raw data to a dedicated Level A microcomputer where 1 second averages are assembled. During this process the Level A calculates the rate of change of temperature and a median sorting routine detects and removes pressure spikes. These data are sent to the Level B for archival. The data are then passed to a Level C workstation for conversion to Pstar format and calibration.
A total of 27 stations (01 - 29) were occupied. Station 01 was a test dip and station 10 a failure. Station 11 was a repeat of station 10. The reversing thermometer T260 was only used at station 02.
Data Processing
The 1 second data passed to the Level C were converted to Pstar format and initially calibrated with coefficients from laboratory calibrations. The up cast data were extracted for merging with the bottle firing codes, on time, thus the CTD variables were reconciled with the bottle samples. Final calibrations were applied using the sample bottle data.
The data were worked up to WOCE standards by the data originators before being supplied to BODC. The oxygen, fluorometer and transmissometer data cannot be used because of problems with the calibration coefficients supplied by RVS.
BODC Data Processing
No further calibrations were applied to the data received by BODC. BODC were mainly concerned with the screening and banking of the data.
The CTD data were received as 2db averaged pressure sorted down cast data. Parameters were pressure (dbar), temperature (°c), and salinity (psu). The oxygen, fluorescence and attenuance data were ignored.
The data were converted into the BODC internal format (PXF) to allow the use of in-house software tools, notably the graphics editor. During this process all the oxygen, fluorometer and transmissometer data were set null. Spikes in the data were manually flagged 'suspect' by modification of the associated quality control flag. In this way none of the original data values were edited or deleted during quality control. These data from cruise CD62A required little flagging and just a few points were set suspect.
Once screened, the CTD data were loaded into a database under the Oracle relational database management system. The start time stored in the database is the CTD deployment time, and the end time is the time the CTD reached the bottom. The start time is more precisely the start of data logging. Latitude and longitude are the mean positions between the start and end times calculated from the master navigation in the binary merged file.
References
Srokosz, M.A. et al. (1992). RRS Charles Darwin Cruise 62A. Institute of Oceanographic Sciences Deacon Laboratory, Cruise Report No. 229, 49pp.
Tokmakian, R.T. et al. (1992). CTD and XBT collected on ERS-1 validation cruise RRS Charles Darwin Cruise 62A, Iceland-Faeroes region. Institute of Oceanographic Sciences Deacon Laboratory, Report No. 294, 86pp.
Project Information
World Ocean Circulation Experiment (WOCE)
The World Ocean Circulation Experiment (WOCE) was a major international experiment which made measurements and undertook modelling studies of the deep oceans in order to provide a much improved understanding of the role of ocean circulation in changing and ameliorating the Earth's climate.
WOCE had two major goals:
-
Goal 1. To develop models to predict climate and to collect the data necessary to test them.
-
Goal 2. To determine the representativeness of the Goal 1 observations and to deduce cost effective means of determining long-term changes in ocean circulation.
UK WOCE
The UK made a substantial contribution to the international World Ocean Circulation Experiment (WOCE) project by focusing on two important regions:
- Southern Ocean - links all the worlds oceans, controlling global climate.
- North Atlantic - directly affects the climate of Europe.
A major part of the UK effort was in the Southern Ocean and work included:
- Two surveys, in the South Atlantic as part of the WOCE Hydrographic Programme.
- SWINDEX, a year long study of the Antarctic Circumpolar Current (ACC) where it crosses major topography south of Africa.
- ADOX, a study of deep water flow from the Atlantic to the Indian Ocean.
- ACCLAIM, a study of the ACC by altimetry and island measurements.
In the North Atlantic the UK undertook:
- NATRE, a purposeful tracer experiment to look at cross isopycnic processes.
- CONVEX, a study of the deep ocean circulation and its changes.
- VIVALDI, a seven year programme of seasonally repeated surveys to study the upper ocean.
- Long-term observations of ocean climate in the North West Approaches.
Satellite ocean surface topography, temperature and wind data were merged with in situ observations and models to create a complete description of ocean circulation, eddy motion and the way the ocean is driven by the atmosphere.
The surveys were forerunners to the international Global Ocean Observing System (GOOS). GOOS was later established to monitor annual to decadal changes in ocean circulation and heat storage which are vital in the prediction of climate change.
Data Activity or Cruise Information
Cruise
| Cruise Name | CD62A |
| Departure Date | 1991-09-06 |
| Arrival Date | 1991-09-28 |
| Principal Scientist(s) | Meric Srokosz (James Rennell Centre for Ocean Circulation) |
| Ship | RRS Charles Darwin |
Complete Cruise Metadata Report is available here
Fixed Station Information
Fixed Station Information
| Station Name | WOCE-AR18 |
| Category | Offshore area |
| Latitude | 65° 0.00' N |
| Longitude | 9° 0.00' W |
| Water depth below MSL |
World Ocean Circulation Experiment (WOCE) Atlantic Area 18 (AR18)
WOCE was a major international experiment which made measurements and undertook modelling studies of the deep oceans in order to provide a much improved understanding of the role of ocean circulation in changing and ameliorating the Earth's climate. WOCE established numerous areas and repeat sections in the Atlantic Ocean as illustrated in the map below.
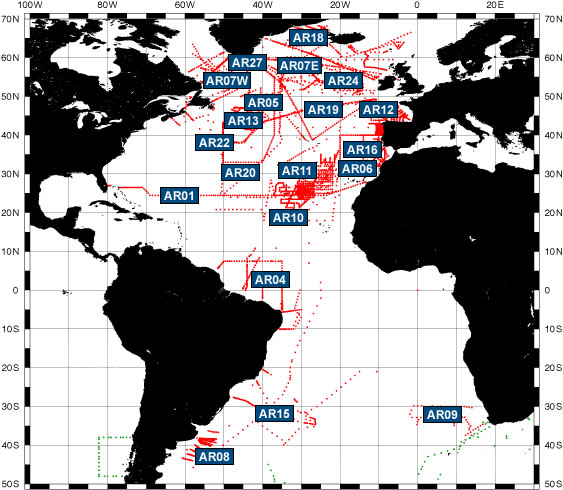
AR18 encompasses the Norwegian Sea basin and stations lie within a box bounded by 69°N, 38°W at the northwest corner and 60°N, 16°E at the southeast corner. The area was occupied between September 1991 to September 1997. A table of all AR18 cruises is presented below:
| Cruise | Cruise dates | Country |
|---|---|---|
| Charles Darwin 62A | 1991-09-06 to 1991-09-28 | UK |
| Johan Hjort 1092 | 1992-07-12 to 1992-07-28 | Norway |
| Aranda 1993 | 1993-08-23 to 1993-09-24 | Finland |
| Johan Hjort 0894 | 1994-07-23 to 1994-08-16 | Norway |
| Johan Hjort 19941029 | 1994-10-29 to 1994-11-23 | Norway |
| Bjarni Saemundsson 1495 | 1995-09-05 to 1995-09-14 | Iceland |
| Aranda 1997 | 1997-08-05 to 1997-09-25 | Finland |
Related Fixed Station activities are detailed in Appendix 1
BODC Quality Control Flags
The following single character qualifying flags may be associated with one or more individual parameters with a data cycle:
| Flag | Description |
|---|---|
| Blank | Unqualified |
| < | Below detection limit |
| > | In excess of quoted value |
| A | Taxonomic flag for affinis (aff.) |
| B | Beginning of CTD Down/Up Cast |
| C | Taxonomic flag for confer (cf.) |
| D | Thermometric depth |
| E | End of CTD Down/Up Cast |
| G | Non-taxonomic biological characteristic uncertainty |
| H | Extrapolated value |
| I | Taxonomic flag for single species (sp.) |
| K | Improbable value - unknown quality control source |
| L | Improbable value - originator's quality control |
| M | Improbable value - BODC quality control |
| N | Null value |
| O | Improbable value - user quality control |
| P | Trace/calm |
| Q | Indeterminate |
| R | Replacement value |
| S | Estimated value |
| T | Interpolated value |
| U | Uncalibrated |
| W | Control value |
| X | Excessive difference |
SeaDataNet Quality Control Flags
The following single character qualifying flags may be associated with one or more individual parameters with a data cycle:
| Flag | Description |
|---|---|
| 0 | no quality control |
| 1 | good value |
| 2 | probably good value |
| 3 | probably bad value |
| 4 | bad value |
| 5 | changed value |
| 6 | value below detection |
| 7 | value in excess |
| 8 | interpolated value |
| 9 | missing value |
| A | value phenomenon uncertain |
| B | nominal value |
| Q | value below limit of quantification |
Appendix 1: WOCE-AR18
Related series for this Fixed Station are presented in the table below. Further information can be found by following the appropriate links.
If you are interested in these series, please be aware we offer a multiple file download service. Should your credentials be insufficient for automatic download, the service also offers a referral to our Enquiries Officer who may be able to negotiate access.
| Series Identifier | Data Category | Start date/time | Start position | Cruise |
|---|---|---|---|---|
| 971883 | CTD or STD cast | 1991-09-12 06:28:00 | 63.94767 N, 6.201 W | RRS Charles Darwin CD62A |
| 971895 | CTD or STD cast | 1991-09-12 11:29:00 | 63.9665 N, 5.38917 W | RRS Charles Darwin CD62A |
| 971902 | CTD or STD cast | 1991-09-12 16:52:00 | 63.95767 N, 4.45267 W | RRS Charles Darwin CD62A |
| 971914 | CTD or STD cast | 1991-09-12 21:55:00 | 63.96267 N, 3.53583 W | RRS Charles Darwin CD62A |
| 971926 | CTD or STD cast | 1991-09-13 02:36:00 | 63.63667 N, 3.84733 W | RRS Charles Darwin CD62A |
| 971938 | CTD or STD cast | 1991-09-13 06:55:00 | 63.31167 N, 4.08617 W | RRS Charles Darwin CD62A |
| 971951 | CTD or STD cast | 1991-09-13 11:32:00 | 62.983 N, 4.35867 W | RRS Charles Darwin CD62A |
| 971963 | CTD or STD cast | 1991-09-13 15:51:00 | 62.6465 N, 4.6325 W | RRS Charles Darwin CD62A |
| 971975 | CTD or STD cast | 1991-09-13 20:02:00 | 62.28967 N, 4.95317 W | RRS Charles Darwin CD62A |
| 971987 | CTD or STD cast | 1991-09-13 23:13:00 | 62.64433 N, 5.216 W | RRS Charles Darwin CD62A |
| 971999 | CTD or STD cast | 1991-09-14 02:15:00 | 62.977 N, 5.44533 W | RRS Charles Darwin CD62A |
| 972002 | CTD or STD cast | 1991-09-14 06:21:00 | 63.3155 N, 5.75783 W | RRS Charles Darwin CD62A |
| 972014 | CTD or STD cast | 1991-09-14 10:26:00 | 63.63333 N, 6.0055 W | RRS Charles Darwin CD62A |
| 972026 | CTD or STD cast | 1991-09-19 12:08:00 | 62.265 N, 5.01783 W | RRS Charles Darwin CD62A |
| 972038 | CTD or STD cast | 1991-09-19 15:52:00 | 62.64833 N, 5.20983 W | RRS Charles Darwin CD62A |
| 972051 | CTD or STD cast | 1991-09-19 19:20:00 | 62.9755 N, 5.46667 W | RRS Charles Darwin CD62A |
| 972063 | CTD or STD cast | 1991-09-20 00:02:00 | 63.31067 N, 5.76 W | RRS Charles Darwin CD62A |
| 972075 | CTD or STD cast | 1991-09-20 04:31:00 | 63.63967 N, 5.99967 W | RRS Charles Darwin CD62A |
| 972087 | CTD or STD cast | 1991-09-20 13:40:00 | 63.94217 N, 6.2985 W | RRS Charles Darwin CD62A |
| 972099 | CTD or STD cast | 1991-09-20 18:57:00 | 63.96283 N, 5.38483 W | RRS Charles Darwin CD62A |
| 972106 | CTD or STD cast | 1991-09-21 06:09:00 | 63.636 N, 3.84417 W | RRS Charles Darwin CD62A |
| 972118 | CTD or STD cast | 1991-09-21 23:29:00 | 62.97733 N, 4.36467 W | RRS Charles Darwin CD62A |
| 972131 | CTD or STD cast | 1991-09-22 05:58:00 | 62.64867 N, 4.63083 W | RRS Charles Darwin CD62A |
| 972143 | CTD or STD cast | 1991-09-22 10:48:00 | 62.289 N, 4.92733 W | RRS Charles Darwin CD62A |
| 972167 | CTD or STD cast | 1991-09-23 06:25:00 | 63.307 N, 4.93883 W | RRS Charles Darwin CD62A |
| 972179 | CTD or STD cast | 1991-09-23 10:28:00 | 63.30883 N, 4.1025 W | RRS Charles Darwin CD62A |
