Metadata Report for BODC Series Reference Number 1132375
Metadata Summary
Problem Reports
Data Access Policy
Narrative Documents
Project Information
Data Activity or Cruise Information
Fixed Station Information
BODC Quality Flags
SeaDataNet Quality Flags
Metadata Summary
Data Description |
|||||||||||||||||||||||||||||||||||||||||||||
|
|||||||||||||||||||||||||||||||||||||||||||||
Data Identifiers |
|||||||||||||||||||||||||||||||||||||||||||||
|
|||||||||||||||||||||||||||||||||||||||||||||
Time Co-ordinates(UT) |
|||||||||||||||||||||||||||||||||||||||||||||
|
|||||||||||||||||||||||||||||||||||||||||||||
Spatial Co-ordinates | |||||||||||||||||||||||||||||||||||||||||||||
|
|||||||||||||||||||||||||||||||||||||||||||||
Parameters |
|||||||||||||||||||||||||||||||||||||||||||||
|
|||||||||||||||||||||||||||||||||||||||||||||
|
|||||||||||||||||||||||||||||||||||||||||||||
Problem Reports
No Problem Report Found in the Database
Data Access Policy
Open Data
These data have no specific confidentiality restrictions for users. However, users must acknowledge data sources as it is not ethical to publish data without proper attribution. Any publication or other output resulting from usage of the data should include an acknowledgment.
If the Information Provider does not provide a specific attribution statement, or if you are using Information from several Information Providers and multiple attributions are not practical in your product or application, you may consider using the following:
"Contains public sector information licensed under the Open Government Licence v1.0."
Narrative Documents
Sea-Bird Dissolved Oxygen Sensor SBE 43 and SBE 43F
The SBE 43 is a dissolved oxygen sensor designed for marine applications. It incorporates a high-performance Clark polarographic membrane with a pump that continuously plumbs water through it, preventing algal growth and the development of anoxic conditions when the sensor is taking measurements.
Two configurations are available: SBE 43 produces a voltage output and can be incorporated with any Sea-Bird CTD that accepts input from a 0-5 volt auxiliary sensor, while the SBE 43F produces a frequency output and can be integrated with an SBE 52-MP (Moored Profiler CTD) or used for OEM applications. The specifications below are common to both.
Specifications
| Housing | Plastic or titanium |
| Membrane | 0.5 mil- fast response, typical for profile applications 1 mil- slower response, typical for moored applications |
| Depth rating | 600 m (plastic) or 7000 m (titanium) 10500 m titanium housing available on request |
| Measurement range | 120% of surface saturation |
| Initial accuracy | 2% of saturation |
| Typical stability | 0.5% per 1000 h |
Further details can be found in the manufacturer's specification sheet.
Sea-Bird Electronics SBE 911 and SBE 917 series CTD profilers
The SBE 911 and SBE 917 series of conductivity-temperature-depth (CTD) units are used to collect hydrographic profiles, including temperature, conductivity and pressure as standard. Each profiler consists of an underwater unit and deck unit or SEARAM. Auxiliary sensors, such as fluorometers, dissolved oxygen sensors and transmissometers, and carousel water samplers are commonly added to the underwater unit.
Underwater unit
The CTD underwater unit (SBE 9 or SBE 9 plus) comprises a protective cage (usually with a carousel water sampler), including a main pressure housing containing power supplies, acquisition electronics, telemetry circuitry, and a suite of modular sensors. The original SBE 9 incorporated Sea-Bird's standard modular SBE 3 temperature sensor and SBE 4 conductivity sensor, and a Paroscientific Digiquartz pressure sensor. The conductivity cell was connected to a pump-fed plastic tubing circuit that could include auxiliary sensors. Each SBE 9 unit was custom built to individual specification. The SBE 9 was replaced in 1997 by an off-the-shelf version, termed the SBE 9 plus, that incorporated the SBE 3 plus (or SBE 3P) temperature sensor, SBE 4C conductivity sensor and a Paroscientific Digiquartz pressure sensor. Sensors could be connected to a pump-fed plastic tubing circuit or stand-alone.
Temperature, conductivity and pressure sensors
The conductivity, temperature, and pressure sensors supplied with Sea-Bird CTD systems have outputs in the form of variable frequencies, which are measured using high-speed parallel counters. The resulting count totals are converted to numeric representations of the original frequencies, which bear a direct relationship to temperature, conductivity or pressure. Sampling frequencies for these sensors are typically set at 24 Hz.
The temperature sensing element is a glass-coated thermistor bead, pressure-protected inside a stainless steel tube, while the conductivity sensing element is a cylindrical, flow-through, borosilicate glass cell with three internal platinum electrodes. Thermistor resistance or conductivity cell resistance, respectively, is the controlling element in an optimized Wien Bridge oscillator circuit, which produces a frequency output that can be converted to a temperature or conductivity reading. These sensors are available with depth ratings of 6800 m (aluminium housing) or 10500 m (titanium housing). The Paroscientific Digiquartz pressure sensor comprises a quartz crystal resonator that responds to pressure-induced stress, and temperature is measured for thermal compensation of the calculated pressure.
Additional sensors
Optional sensors for dissolved oxygen, pH, light transmission, fluorescence and others do not require the very high levels of resolution needed in the primary CTD channels, nor do these sensors generally offer variable frequency outputs. Accordingly, signals from the auxiliary sensors are acquired using a conventional voltage-input multiplexed A/D converter (optional). Some Sea-Bird CTDs use a strain gauge pressure sensor (Senso-Metrics) in which case their pressure output data is in the same form as that from the auxiliary sensors as described above.
Deck unit or SEARAM
Each underwater unit is connected to a power supply and data logging system: the SBE 11 (or SBE 11 plus) deck unit allows real-time interfacing between the deck and the underwater unit via a conductive wire, while the submersible SBE 17 (or SBE 17 plus) SEARAM plugs directly into the underwater unit and data are downloaded on recovery of the CTD. The combination of SBE 9 and SBE 17 or SBE 11 are termed SBE 917 or SBE 911, respectively, while the combinations of SBE 9 plus and SBE 17 plus or SBE 11 plus are termed SBE 917 plus or SBE 911 plus.
Specifications
Specifications for the SBE 9 plus underwater unit are listed below:
| Parameter | Range | Initial accuracy | Resolution at 24 Hz | Response time |
|---|---|---|---|---|
| Temperature | -5 to 35°C | 0.001°C | 0.0002°C | 0.065 sec |
| Conductivity | 0 to 7 S m-1 | 0.0003 S m-1 | 0.00004 S m-1 | 0.065 sec (pumped) |
| Pressure | 0 to full scale (1400, 2000, 4200, 6800 or 10500 m) | 0.015% of full scale | 0.001% of full scale | 0.015 sec |
Further details can be found in the manufacturer's specification sheet.
Ti CTD Instrument Descriptions JC068
Titanium CTD Unit and Auxiliary Sensors JC068
The CTD unit was a Sea-Bird 9/11 plus (SN 09P-0803) with fin-mounted secondary temperature and conductivity sensors. All other instruments were attached to a Sea-Bird 24 position Carousel (s/n: 32- 60380-0805). The titanium frame was deployed on the synthetic and non-conducting synthetic rope. Two Sea-Bird 17 plus SeaRAM (s/n's 17p-59976-0326(T) and 17p-59976-0327(T), Titanium battery) units were used to power the system, log the data and fire the bottles. Bottle stops were programmed into the SeaRAM using SeatermAF software prior to each cast, and data downloaded afterwards.
The table below lists detailed information about the various sensors.
| Sensor | Model | Serial Number | Calibration (UT) | Comments |
|---|---|---|---|---|
| Pressure transducer | Digiquartz Pressure Sensor | 93896 | 12/5/2011 | - |
| Conductivity sensor | SBE 4C | 04C- 3873 | 14/09/2011 | Primary sensor |
| Conductivity sensor | SBE 4C | 04C-3272 | 29/04/2011 | Secondary sensor |
| Temperature sensor | SBE 3 | 03P- 5277 | 19/08/2010 | Primary sensor |
| Temperature sensor | SBE 3 | 03P - 4593 | 29/04/2011 | Secondary sensor |
| Dissolved oxygen | SBE 43 | 43-2055 | 15/03/2011 | - |
| Fluorometer | Chelsea MKIII Aquatracka fluorometer | 088244 | 11/02/2010 | - |
| Transmissometer | Chelsea MKII 25cm path Alphatracka transmissometer | 161047 | 18/03/2008 | - |
| Backscatter meter | Wetlabs BBRTD turbidity sensor | BBRTD-182 | 17/08/2010 | - |
Chelsea Technologies Group Aquatracka MKIII fluorometer
The Chelsea Technologies Group Aquatracka MKIII is a logarithmic response fluorometer. Filters are available to enable the instrument to measure chlorophyll, rhodamine, fluorescein and turbidity.
It uses a pulsed (5.5 Hz) xenon light source discharging along two signal paths to eliminate variations in the flashlamp intensity. The reference path measures the intensity of the light source whilst the signal path measures the intensity of the light emitted from the specimen under test. The reference signal and the emitted light signals are then applied to a ratiometric circuit. In this circuit, the ratio of returned signal to reference signal is computed and scaled logarithmically to achieve a wide dynamic range. The logarithmic conversion accuracy is maintained at better than one percent of the reading over the full output range of the instrument.
Two variants of the instrument are available, both manufactured in titanium, capable of operating in depths from shallow water down to 2000 m and 6000 m respectively. The optical characteristics of the instrument in its different detection modes are visible below:
| Excitation | Chlorophyll a | Rhodamine | Fluorescein | Turbidity |
|---|---|---|---|---|
| Wavelength (nm) | 430 | 500 | 485 | 440* |
| Bandwidth (nm) | 105 | 70 | 22 | 80* |
| Emission | Chlorophyll a | Rhodamine | Fluorescein | Turbidity |
| Wavelength (nm) | 685 | 590 | 530 | 440* |
| Bandwidth (nm) | 30 | 45 | 30 | 80* |
* The wavelengths for the turbidity filters are customer selectable but must be in the range 400 to 700 nm. The same wavelength is used in the excitation path and the emission path.
The instrument measures chlorophyll a, rhodamine and fluorescein with a concentration range of 0.01 µg l-1 to 100 µg l-1. The concentration range for turbidity is 0.01 to 100 FTU (other wavelengths are available on request).
The instrument accuracy is ± 0.02 µg l-1 (or ± 3% of the reading, whichever is greater) for chlorophyll a, rhodamine and fluorescein. The accuracy for turbidity, over a 0 - 10 FTU range, is ± 0.02 FTU (or ± 3% of the reading, whichever is greater).
Further details are available from the Aquatracka MKIII specification sheet.
Chelsea Technologies Group ALPHAtracka and ALPHAtracka II transmissometers
The Chelsea Technologies Group ALPHAtracka (the Mark I) and its successor, the ALPHAtracka II (the Mark II), are both accurate (< 0.3 % fullscale) transmissometers that measure the beam attenuation coefficient at 660 nm. Green (565 nm), yellow (590 nm) and blue (470 nm) wavelength variants are available on special order.
The instrument consists of a Transmitter/Reference Assembly and a Detector Assembly aligned and spaced apart by an open support frame. The housing and frame are both manufactured in titanium and are pressure rated to 6000 m depth.
The Transmitter/Reference housing is sealed by an end cap. Inside the housing an LED light source emits a collimated beam through a sealed window. The Detector housing is also sealed by an end cap. A signal photodiode is placed behind a sealed window to receive the collimated beam from the Transmitter.
The primary difference between the ALPHAtracka and ALPHAtracka II is that the Alphatracka II is implemented with surface-mount technology; this has enabled a much smaller diameter pressure housing to be used while retaining exactly the same optical train as in the Mark I. Data from the Mark II version are thus fully compatible with that already obtained with the Mark I. The performance of the Mark II is further enhanced by two electronic developments from Chelsea Technologies Group - firstly, all items are locked in a signal nulling loop of near infinite gain and, secondly, the signal output linearity is inherently defined by digital circuitry only.
Among other advantages noted above, these features ensure that the optical intensity of the Mark II, indicated by the output voltage, is accurately represented by a straight line interpolation between a reading near full-scale under known conditions and a zero reading when blanked off.
For optimum measurements in a wide range of environmental conditions, the Mark I and Mark II are available in 5 cm, 10 cm and 25 cm path length versions. Output is default factory set to 2.5 volts but can be adjusted to 5 volts on request.
Further details about the Mark II instrument are available from the Chelsea Technologies Group ALPHAtrackaII specification sheet.
BODC CTD Processing JC068
Reformatting
The data arrived at BODC as mstar format files representing all of the CTD casts taken during the cruise JC068. The data contained in the files were the downcast data averaged to a 2db pressure grid. The following table shows how the variables within the mstar files were mapped to the appropriate BODC parameter codes. Only the primary data channels were transferred.
| Originator's Parameter Name | Units | Description | BODC Parameter Code | Units | Comments |
|---|---|---|---|---|---|
| press | dbar | Pressure of water body on profiling pressure sensor | PRESPR01 | dbar | Manufacturer's calibration applied. |
| temp | °C | Temperature of water column by CTD | TEMPCU01 | °C | This parameter represents the first choice sensor data. |
| temp1 | °C | Temperature of water column by CTD (primary sensor) | Not transferred | - | Data available on request. |
| temp2 | °C | Temperature of the water column by CTD (secondary sensor) | Not transferred | - | Data available on request. |
| psal | Dimensionless | Practical salinity of the water body by CTD | PSALCC01 | Dimensionless | Generated by data originator using primary CTD temperature and calibrated conductivity data. |
| psal1 | - | Practical salinity of the water body by CTD | Not transferred | - | Uncalibrated primary salinity data, available on request. |
| psal2 | - | Practical salinity of the water body by CTD | Not transferred | - | Uncalibrated secondary salinity data, available on request. |
| oxygen | µmol/Kg | Dissolved oxygen concentration per unit mass of the water body, uncalibrated | DOXMZZXX | µmol/Kg | All oxygen data has been left uncalibrated due to large differences in residuals. Discrete O2 sample data is available collected from the stainless steel CTD. |
| fluor | ug/l | Concentration of chlorophyll-a from an in-situ chlorophyll fluorometer | CPHLPM01 | Milligrams per cubic metre | Manufacturer's calibration applied. No unit conversion is necessary as µg/l are equivalent to mg/m |
| transmittance | percent | Transmittance (red light wavelength- 660nm) per 25cm of the water body by CTD | POPTDR01 | percent | - |
| depth | M | Depth of the water column | Not transferred | - | - |
| potemp | °C | Potential temperature of the water body | POTMCV01 | °C | Calculated by BODC |
| Sigma-theta | Kilograms per cubic metre | Sigma-theta of the water body by CTD and computation from salinity and potential temperature | SIGTPR01 | Kilograms per cubic metre | Calculated by BODC |
| cond | mS/cm | Electrical conductivity of the water body by CTD | CNCLCCI1 | Siemens per metre | Calibration against independent measurement. Units conversion applied at BODC |
| cond1 and cond2 | mS/cm | Uncalibrated conductivity from the primary and secondary sensors. | Not transferred | - | Data available on request |
| Par | Number | Instrument output (voltage) by cosine-collector downwelling PAR radiometer | LVLTLD01 | Volts | - |
Screening
Reformatted CTD data were visualised using the in-house graphical editor EDSERPLO. No data values were edited or deleted. Quality control flags were applied to data as necessary.
References
Fofonoff, NP and Millard, RC (1983). Algorithms for computations of fundamental properties of seawater. UNESCO Technical Papers in Marine Science No. 44, 53pp.
UNESCO, 1981. Background papers and supporting data on the International Equation of State of Seawater 1980. UNESCO Technical Papers in Marine Science No. 38, 192pp
Originator's Data Processing JC068
Sampling Strategy
Two CTD frames were used during JC068, a stainless steel frame and a trace-metal clean titanium frame. The titanium frame was deployed using a non-conducting cable with an auto-fire unit to trigger the niskin bottles at pre-programmed depths. In total 62 successful casts were made during the cruise. Of the successful casts, 38 were made using the stainless steel frame and 24 using the trace-metal clean titanium frame (full water column). Water was sampled from all successful casts.
Data Processing
Initial SeaBird Processing
The files output by Seasave have the appendices: .hex, .HDR, .bl and .CON. The .CON files for each cast contain the calibration coefficients for the instrument. The .HDR files contain the information in the header of each cast file. The .hex files are the data files for each cast and are in hex format. The .bl files contain CTD scans that were collected while the water bottle was being closed. Files produced by the autonomous titanium frame unit and the conventional stainless steel frame unit were processed in exactly the same way.
Initial data processing was performed using SeaBird processing software SBE Data Processing version 7.21b. The following options were used in the given order :
- Data Conversion: turns the raw data into physical units.
- ALIGN CTD was run to advance the oxygen sensor relative to the pressure by 8 seconds
- The Cell Thermal Mass (CellTM) program was used to compensate for the effect of thermal 'inertia' on the conductivity cells. The thermal anomaly amplitude was set to 0.03 and the thermal anomaly time constant to 1/7.
- Bottle_Summary: generates an ASCII summary .bl file of the bottle firing data from the cast .ros file.
Mstar Processing
The main points are summarised here;
- First choice sensor data was stored in the variables temp and cond (which are used to calculate variables potemp and psal).
- Highest pressure point is taken as the bottom of the downcast.
- The surface soak data was removed and the start of the downcast was chosen when the salinity and oxygen data shows reasonable values.
- Data averaged to 2db resolution
Field Calibrations
Discrete salinity and oxygen samples were collected from each cast and used to calibrate the CTD sensor data
Calibration of the oxygen sensor
Residuals for bottle - CTD oxygen was not stable over time. Bottle oxygen and CTD oxygen did not show a clear linear relationship. As a result the oxygen data was left uncalibrated.
Salinity calibration
Upcast salinity from the first choice sensors present at bottle depths was calibrated against salinity derived from bottle samples.
Salinity data was calibrated at NOC by Brian King no calibration information was provided.
Project Information
GEOTRACES
Introduction
GEOTRACES is an international programme sponsored by SCOR which aims to improve our understanding of biogeochemical cycles and large-scale distribution of trace elements and their isotopes (TEIs) in the marine environment. The global field programme started in 2009 and will run for at least a decade. Before the official launch of GEOTRACES, fieldwork was carried out as part of the International Polar Year (IPY)(2007-2009) where 14 cruises were connected to GEOTRACES.
GEOTRACES is expected to become the largest programme to focus on the chemistry of the oceans and will improve our understanding of past, present and future distributions of TEIs and their relationships to important global processes.
This initiative was prompted by the increasing recognition that TEIs are playing a crucial role as regulators and recorders of important biogeochemical and physical processes that control the structure and productivity of marine ecosystems, the dispersion of contaminants in the marine environment, the level of greenhouse gases in the atmosphere, and global climate.
Scientific Objectives
GEOTRACES mission is: To identify processes and quantify fluxes that control the distribution of key trace elements and isotopes in the ocean, and to establish the sensitivity of these distributions to changing environmental conditions.
Three overriding goals support the GEOTRACES mission
- Determine ocean distributions of selected TEIs at all major ocean basins
- Evaluate the sources, sinks, and internal cycling of these TEIs and thereby characterize more completely their global biogeochemical cycles
- Provide a baseline distribution in the Polar Regions as reference for assessing past and future changes.
These goals will be pursued through complementary research strategies, including observations, experiments and modelling.
Fieldwork
The central component of GEOTRACES fieldwork will be a series of cruises spanning all Ocean basins see map below.
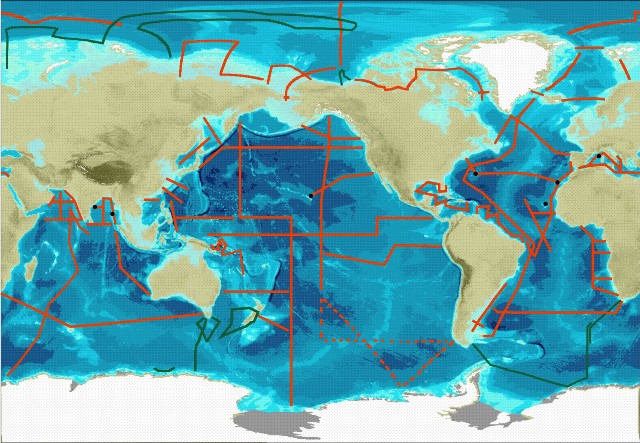
Three types of cruise are required to meet the goals set out by GEOTRACES. These are
- Section cruises - These will measure all the key parameters (see below) over the full depth of the water column. The sections were discussed and approved by the International GEOTRACES Scientific Steering Committee at the basin workshops.
- Process Studies - These will investigate a particular process relevant to the cycling of trace metal and isotopes. They must follow the "Criteria for Establishing GEOTRACES Process Studies" and be approved by the International GEOTRACES Scientific Steering Committee.
- Cruises collecting GEOTRACES compliant data - These will collect some trace element or isotope data. They must follow the GEOTRACES Intercalibration and Data Management protocols
IPY-GEOTRACES
The IPY-GEOTRACES programme comprised of 14 research cruises on ships from 7 nations; Australia, Canada, France, Germany, New Zealand, Japan and Russia. The cruises will not be classified in the same way as the full GEOTRACES programme since the intercalibration protocols and data management protocols had not been established before the start of the IPY. But IPY-GEOTRACES data will still be quality controlled by GDAC and in the majority of cases verified versus Intercalibration standards or protocols.
Key parameters
The key parameters as set out by the GEOTRACES science plan are as follows: Fe, Al, Zn, Mn, Cd, Cu; 15N, 13C; 230Th, 231Pa; Pb isotopes, Nd isotopes; stored sample, particles, aerosols.
Weblink:
http://www.bodc.ac.uk/geotraces/
http://www.geotraces.org/
Data Activity or Cruise Information
Cruise
| Cruise Name | JC068 (GA10) |
| Departure Date | 2011-12-24 |
| Arrival Date | 2012-01-27 |
| Principal Scientist(s) | Gideon Henderson (University of Oxford Department of Earth Sciences) |
| Ship | RRS James Cook |
Complete Cruise Metadata Report is available here
Fixed Station Information
No Fixed Station Information held for the Series
BODC Quality Control Flags
The following single character qualifying flags may be associated with one or more individual parameters with a data cycle:
| Flag | Description |
|---|---|
| Blank | Unqualified |
| < | Below detection limit |
| > | In excess of quoted value |
| A | Taxonomic flag for affinis (aff.) |
| B | Beginning of CTD Down/Up Cast |
| C | Taxonomic flag for confer (cf.) |
| D | Thermometric depth |
| E | End of CTD Down/Up Cast |
| G | Non-taxonomic biological characteristic uncertainty |
| H | Extrapolated value |
| I | Taxonomic flag for single species (sp.) |
| K | Improbable value - unknown quality control source |
| L | Improbable value - originator's quality control |
| M | Improbable value - BODC quality control |
| N | Null value |
| O | Improbable value - user quality control |
| P | Trace/calm |
| Q | Indeterminate |
| R | Replacement value |
| S | Estimated value |
| T | Interpolated value |
| U | Uncalibrated |
| W | Control value |
| X | Excessive difference |
SeaDataNet Quality Control Flags
The following single character qualifying flags may be associated with one or more individual parameters with a data cycle:
| Flag | Description |
|---|---|
| 0 | no quality control |
| 1 | good value |
| 2 | probably good value |
| 3 | probably bad value |
| 4 | bad value |
| 5 | changed value |
| 6 | value below detection |
| 7 | value in excess |
| 8 | interpolated value |
| 9 | missing value |
| A | value phenomenon uncertain |
| B | nominal value |
| Q | value below limit of quantification |
