Metadata Report for BODC Series Reference Number 1228629
Metadata Summary
Problem Reports
Data Access Policy
Narrative Documents
Project Information
Data Activity or Cruise Information
Fixed Station Information
BODC Quality Flags
SeaDataNet Quality Flags
Metadata Summary
Data Description |
|||||||||||||||||||||||||||||||||||||||||||||||||||||
|
|||||||||||||||||||||||||||||||||||||||||||||||||||||
Data Identifiers |
|||||||||||||||||||||||||||||||||||||||||||||||||||||
|
|||||||||||||||||||||||||||||||||||||||||||||||||||||
Time Co-ordinates(UT) |
|||||||||||||||||||||||||||||||||||||||||||||||||||||
|
|||||||||||||||||||||||||||||||||||||||||||||||||||||
Spatial Co-ordinates | |||||||||||||||||||||||||||||||||||||||||||||||||||||
|
|||||||||||||||||||||||||||||||||||||||||||||||||||||
Parameters |
|||||||||||||||||||||||||||||||||||||||||||||||||||||
|
|||||||||||||||||||||||||||||||||||||||||||||||||||||
|
|||||||||||||||||||||||||||||||||||||||||||||||||||||
Problem Reports
No Problem Report Found in the Database
Quality report for Backscatter from RRS Discovery D354 titanium CTD
BODC warns of quality concerns regarding the backscatter channel in all data files. All profiles were found to be offset towards low values which often fell below the permitted range. The whole channel was flagged in all files as all data points were deemed untrustworthy in this context.
It was agreed that the offsets cannot be corrected,and that the cause of inaccuracy is likely to be an outdated calibration. It follows that even though the single data values are not to be considered accurate, the relative change of backscatter with depth still holds scientific value.
Data Access Policy
Open Data
These data have no specific confidentiality restrictions for users. However, users must acknowledge data sources as it is not ethical to publish data without proper attribution. Any publication or other output resulting from usage of the data should include an acknowledgment.
If the Information Provider does not provide a specific attribution statement, or if you are using Information from several Information Providers and multiple attributions are not practical in your product or application, you may consider using the following:
"Contains public sector information licensed under the Open Government Licence v1.0."
Narrative Documents
Sea-Bird Dissolved Oxygen Sensor SBE 43 and SBE 43F
The SBE 43 is a dissolved oxygen sensor designed for marine applications. It incorporates a high-performance Clark polarographic membrane with a pump that continuously plumbs water through it, preventing algal growth and the development of anoxic conditions when the sensor is taking measurements.
Two configurations are available: SBE 43 produces a voltage output and can be incorporated with any Sea-Bird CTD that accepts input from a 0-5 volt auxiliary sensor, while the SBE 43F produces a frequency output and can be integrated with an SBE 52-MP (Moored Profiler CTD) or used for OEM applications. The specifications below are common to both.
Specifications
| Housing | Plastic or titanium |
| Membrane | 0.5 mil- fast response, typical for profile applications 1 mil- slower response, typical for moored applications |
| Depth rating | 600 m (plastic) or 7000 m (titanium) 10500 m titanium housing available on request |
| Measurement range | 120% of surface saturation |
| Initial accuracy | 2% of saturation |
| Typical stability | 0.5% per 1000 h |
Further details can be found in the manufacturer's specification sheet.
Instrumentation on cruise D354
Titanium framed CTD unit and attached sensors
A Sea-Bird Electronics 911+ CTD system was used, composed by an SBE11+ deck unit (serial number 11P-19817-0495) and an SBE9+ underwater unit (serial number 09P-24680-0637), the latter of which had last been serviced on 22 September 2008. The attached sensors are listed in the table below:
| Sensor | Make / Model | Calibration Dates | Serial Number | Comments |
|---|---|---|---|---|
| Temperature | SBE 3P | 2010-02-10 | 2729 | Primary sensor |
| Temperature 2 | SBE 3P | 2010-02-13 | 4593 | Secondary sensor |
| Conductivity | SBE 4C | 2010-03-03 | 2858 | Primary sensor |
| Conductivity 2 | SBE 4C | 2010-02-25 | 3272 | Secondary sensor |
| Pressure | Digiquartz | 2008-09-22 | 79501 | - |
| Oxygen | SBE 43 | 2010-03-20 | 0621 | - |
| Fluorometer | CTG MKIII Aquatracka | 2010-02-11 | 088244 | - |
| Transmissometer | CTG MKII Alphatracka | 2008-05-28 | 161048 | 25cm path |
| Light scatter | WETLabs BBRTD | 2010-04-14 | 169 | - |
Sea-Bird Electronics SBE 911 and SBE 917 series CTD profilers
The SBE 911 and SBE 917 series of conductivity-temperature-depth (CTD) units are used to collect hydrographic profiles, including temperature, conductivity and pressure as standard. Each profiler consists of an underwater unit and deck unit or SEARAM. Auxiliary sensors, such as fluorometers, dissolved oxygen sensors and transmissometers, and carousel water samplers are commonly added to the underwater unit.
Underwater unit
The CTD underwater unit (SBE 9 or SBE 9 plus) comprises a protective cage (usually with a carousel water sampler), including a main pressure housing containing power supplies, acquisition electronics, telemetry circuitry, and a suite of modular sensors. The original SBE 9 incorporated Sea-Bird's standard modular SBE 3 temperature sensor and SBE 4 conductivity sensor, and a Paroscientific Digiquartz pressure sensor. The conductivity cell was connected to a pump-fed plastic tubing circuit that could include auxiliary sensors. Each SBE 9 unit was custom built to individual specification. The SBE 9 was replaced in 1997 by an off-the-shelf version, termed the SBE 9 plus, that incorporated the SBE 3 plus (or SBE 3P) temperature sensor, SBE 4C conductivity sensor and a Paroscientific Digiquartz pressure sensor. Sensors could be connected to a pump-fed plastic tubing circuit or stand-alone.
Temperature, conductivity and pressure sensors
The conductivity, temperature, and pressure sensors supplied with Sea-Bird CTD systems have outputs in the form of variable frequencies, which are measured using high-speed parallel counters. The resulting count totals are converted to numeric representations of the original frequencies, which bear a direct relationship to temperature, conductivity or pressure. Sampling frequencies for these sensors are typically set at 24 Hz.
The temperature sensing element is a glass-coated thermistor bead, pressure-protected inside a stainless steel tube, while the conductivity sensing element is a cylindrical, flow-through, borosilicate glass cell with three internal platinum electrodes. Thermistor resistance or conductivity cell resistance, respectively, is the controlling element in an optimized Wien Bridge oscillator circuit, which produces a frequency output that can be converted to a temperature or conductivity reading. These sensors are available with depth ratings of 6800 m (aluminium housing) or 10500 m (titanium housing). The Paroscientific Digiquartz pressure sensor comprises a quartz crystal resonator that responds to pressure-induced stress, and temperature is measured for thermal compensation of the calculated pressure.
Additional sensors
Optional sensors for dissolved oxygen, pH, light transmission, fluorescence and others do not require the very high levels of resolution needed in the primary CTD channels, nor do these sensors generally offer variable frequency outputs. Accordingly, signals from the auxiliary sensors are acquired using a conventional voltage-input multiplexed A/D converter (optional). Some Sea-Bird CTDs use a strain gauge pressure sensor (Senso-Metrics) in which case their pressure output data is in the same form as that from the auxiliary sensors as described above.
Deck unit or SEARAM
Each underwater unit is connected to a power supply and data logging system: the SBE 11 (or SBE 11 plus) deck unit allows real-time interfacing between the deck and the underwater unit via a conductive wire, while the submersible SBE 17 (or SBE 17 plus) SEARAM plugs directly into the underwater unit and data are downloaded on recovery of the CTD. The combination of SBE 9 and SBE 17 or SBE 11 are termed SBE 917 or SBE 911, respectively, while the combinations of SBE 9 plus and SBE 17 plus or SBE 11 plus are termed SBE 917 plus or SBE 911 plus.
Specifications
Specifications for the SBE 9 plus underwater unit are listed below:
| Parameter | Range | Initial accuracy | Resolution at 24 Hz | Response time |
|---|---|---|---|---|
| Temperature | -5 to 35°C | 0.001°C | 0.0002°C | 0.065 sec |
| Conductivity | 0 to 7 S m-1 | 0.0003 S m-1 | 0.00004 S m-1 | 0.065 sec (pumped) |
| Pressure | 0 to full scale (1400, 2000, 4200, 6800 or 10500 m) | 0.015% of full scale | 0.001% of full scale | 0.015 sec |
Further details can be found in the manufacturer's specification sheet.
Chelsea Technologies Group Aquatracka MKIII fluorometer
The Chelsea Technologies Group Aquatracka MKIII is a logarithmic response fluorometer. Filters are available to enable the instrument to measure chlorophyll, rhodamine, fluorescein and turbidity.
It uses a pulsed (5.5 Hz) xenon light source discharging along two signal paths to eliminate variations in the flashlamp intensity. The reference path measures the intensity of the light source whilst the signal path measures the intensity of the light emitted from the specimen under test. The reference signal and the emitted light signals are then applied to a ratiometric circuit. In this circuit, the ratio of returned signal to reference signal is computed and scaled logarithmically to achieve a wide dynamic range. The logarithmic conversion accuracy is maintained at better than one percent of the reading over the full output range of the instrument.
Two variants of the instrument are available, both manufactured in titanium, capable of operating in depths from shallow water down to 2000 m and 6000 m respectively. The optical characteristics of the instrument in its different detection modes are visible below:
| Excitation | Chlorophyll a | Rhodamine | Fluorescein | Turbidity |
|---|---|---|---|---|
| Wavelength (nm) | 430 | 500 | 485 | 440* |
| Bandwidth (nm) | 105 | 70 | 22 | 80* |
| Emission | Chlorophyll a | Rhodamine | Fluorescein | Turbidity |
| Wavelength (nm) | 685 | 590 | 530 | 440* |
| Bandwidth (nm) | 30 | 45 | 30 | 80* |
* The wavelengths for the turbidity filters are customer selectable but must be in the range 400 to 700 nm. The same wavelength is used in the excitation path and the emission path.
The instrument measures chlorophyll a, rhodamine and fluorescein with a concentration range of 0.01 µg l-1 to 100 µg l-1. The concentration range for turbidity is 0.01 to 100 FTU (other wavelengths are available on request).
The instrument accuracy is ± 0.02 µg l-1 (or ± 3% of the reading, whichever is greater) for chlorophyll a, rhodamine and fluorescein. The accuracy for turbidity, over a 0 - 10 FTU range, is ± 0.02 FTU (or ± 3% of the reading, whichever is greater).
Further details are available from the Aquatracka MKIII specification sheet.
Chelsea Technologies Group ALPHAtracka and ALPHAtracka II transmissometers
The Chelsea Technologies Group ALPHAtracka (the Mark I) and its successor, the ALPHAtracka II (the Mark II), are both accurate (< 0.3 % fullscale) transmissometers that measure the beam attenuation coefficient at 660 nm. Green (565 nm), yellow (590 nm) and blue (470 nm) wavelength variants are available on special order.
The instrument consists of a Transmitter/Reference Assembly and a Detector Assembly aligned and spaced apart by an open support frame. The housing and frame are both manufactured in titanium and are pressure rated to 6000 m depth.
The Transmitter/Reference housing is sealed by an end cap. Inside the housing an LED light source emits a collimated beam through a sealed window. The Detector housing is also sealed by an end cap. A signal photodiode is placed behind a sealed window to receive the collimated beam from the Transmitter.
The primary difference between the ALPHAtracka and ALPHAtracka II is that the Alphatracka II is implemented with surface-mount technology; this has enabled a much smaller diameter pressure housing to be used while retaining exactly the same optical train as in the Mark I. Data from the Mark II version are thus fully compatible with that already obtained with the Mark I. The performance of the Mark II is further enhanced by two electronic developments from Chelsea Technologies Group - firstly, all items are locked in a signal nulling loop of near infinite gain and, secondly, the signal output linearity is inherently defined by digital circuitry only.
Among other advantages noted above, these features ensure that the optical intensity of the Mark II, indicated by the output voltage, is accurately represented by a straight line interpolation between a reading near full-scale under known conditions and a zero reading when blanked off.
For optimum measurements in a wide range of environmental conditions, the Mark I and Mark II are available in 5 cm, 10 cm and 25 cm path length versions. Output is default factory set to 2.5 volts but can be adjusted to 5 volts on request.
Further details about the Mark II instrument are available from the Chelsea Technologies Group ALPHAtrackaII specification sheet.
WETLabs Single-angle Backscattering Meter ECO BB
An optical scattering sensor that measures scattering at 117°. This angle was determined as a minimum convergence point for variations in the volume scattering function induced by suspended materials and water. The measured signal is less determined by the type and size of the materials in the water and is more directly correlated to their concentration.
Several versions are available, with minor differences in their specifications:
- ECO BB(RT)provides analog or RS-232 serial output with 4000 count range
- ECO BB(RT)D adds the possibility of being deployed in depths up to 6000 m while keeping the capabilities of ECO BB(RT)
- ECO BB provides the capabilities of ECO BB(RT) with periodic sampling
- ECO BBB is similar to ECO BB but with internal batteries for autonomous operation
- ECO BBS is similar to ECO BB but with an integrated anti-fouling bio-wiper
- ECO BBSB has the capabilities of ECO BBS but with internal batteries for autonomous operation
Specifications
| Wavelength | 471, 532, 660 nm |
| Sensitivity (m-1 sr-1) | 1.2 x 10⁻⁵ at 470 nm 7.7 x 10⁻⁶ at 532 nm 3.8 x 10⁻⁶ at 660 nm |
| Typical range | ~0.0024 to 5 m-1 |
| Linearity | 99% R2 |
| Sample rate | up to 8Hz |
| Temperature range | 0 to 30°C |
| Depth rating | 600 m (standard) 6000 m (deep) |
Further details can be found in the manufacturer's specification sheet.
Originator's processing of CTD data from RRS Discovery cruise D354
Sampling Strategy
A total of 38 stainless steel CTD casts and 32 titanium CTD casts were deployed during RRS Discovery cruise D354, which was funded by NERC as part of the split award project entitled "Iron biogeochemistry in the high latitude North Atlantic / Irminger Basin Iron Study (IBIS)". All casts were deployed within 33 stations in the Iceland and Irminger Basins, occupied from 10 July 2010 to 07 August 2010.
No major problems were experienced on either CTD frames, however an offset of 0.02 in the secondary conductivity sensor on the stainless steel frame was verified by bottle salinity analyses.
Data processing
Four output files were created following each cast: a raw data file (.dat), a data configuration file (.con), a bottle firing locations file (.bot) and a header file (.hdr). The file names contained the cast number and the identifiers T or S for titanium and stainless steel frames respectively.
The first stage of processing for each cast was carried out using the SeaBird CTD data processing routines in the following order:
- Data conversion (DatCnv). Raw CTD files were read and converted from engineering units into binary format. Two output files were created: one containing CTD data from the whole profile (.cnv), the other containing CTD data at the instant of bottle firing (.ros).
- AlignCTD. Converted data files were corrected for the oxygen sensor's response time, which lags five seconds behind the pressure sensor. The output overwrote the .cnv file.
- WildEdit. De-spiking routine which overwrote the .cnv files.
- CellTM. Removed the effect of thermal 'inertia' on the conductivity cells using temperature measurements.
- Translate. The final .cnv files were converted from binary to ASCII format.
The second processing stage was carried out in the UNIX system of the ship using in-house processing routines. Two versions of all the processing scripts used were created, one for the stainless steel frame and one for the titanium frame (indicated in the command name as 's' and 't' respectively).
- ctds0/ctdt0. The ASCII .cnv files were converted into a binary format and header information was added, including the spatial coordinates of the CTD when it was at the bottom. The files were then averaged to 24 Hz.
- ctds1/ctdt1. Subroutines ran in PEXEC included pmdian , which removed residual spikes from all the variables, pavrge , which averaged the data to 1 Hz, pintrp , which interpolated absent pressure data values, peos83 , which calculated salinity, potential temperature, sigma0 and sigma2. The output files included both 1 Hz and 10 second averaged files.
- ctds2/ctdt2. The appropriate data cycles were manually selected out of the .1hz files using mlist . These were defined by the shallowest CTD depth after the initial 10 minute soak, the greatest bottom depth, and the last good point before the CTD is removed from the water. The data cycles were cut out using pcopya and averaged into 2db pressure bins. All CTD files were then merged with navigation to replace the manually entered position values with the accurate fixes.
- fir/firt0. The .ros files created from DatCnv were converted into pstar format. The relevant data from the 10 second averaged output files from ctds1/ctdt1 were then pasted into a new file containing the mean values of all measured variables at the bottle firing locations.
- samfir/samfirt. A new file was created, containing selected variables from the output files of fir/firt0 pasted into a World Ocean Circulation Experiment (WOCE) style master template. The "sam" files will be used in the calibration of the conductivity and oxygen sensors.
Sample Bottle Data
Text files containing salinity, oxygen and nutrient bottle data for each cast were processed separately but following the same steps. Sample measurements were converted into UNIX friendly characters, following which formatted files were created. The data were then pasted into one "sam" output file from samfir/samfirt per cast.
Calibration
Salinity bottle data were used to calibrate the conductivity sensors on both stainless steel and titanium framed CTDs, whilst oxygen bottle data were used to calibrate oxygen sensors in the stainless steel framed CTD only, as no oxygen bottle data were collected from the titanium framed CTD on this cruise. A cross calibration between stainless steel and titanium framed CTD was carried out to calibrate the dissolved oxygen sensor from the titanium framed CTD.
Conductivity. Salinity samples were run using a 8400B Autosal Salinometer, and the UNESCO 1983 equation of state was used to convert the output salinity values to conductivity using both primary and secondary temperatures. Calibration coefficients were subsequently obtained and used to correct the sensor measured conductivities in the output files fromctds2/ctdt2 using the following equations:
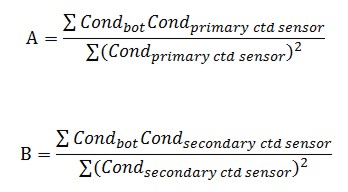
The calibrated conductivity values resulted from inserting the A and B coefficients in the following equations:
Conductivity = A * (primary sensor conductivity)
Conductivity = B * (secondary sensor conductivity)
For the stainless steel CTD, the coefficients were set to A = 1.00012407 to calibrate the primary conductivity sensor, and B = 1.00061972 to calibrate the secondary conductivity sensor. The mean residual conductivity differences between the salinity sample conductivity and CTD sensor conductivity were 0.0000 ± 0.0020 for the primary sensor and 0.0000 ± 0.0024 for the secondary sensor. For the titanium framed CTD, the coefficients were set to A = 1.00027784 to calibrate the primary conductivity sensor, and B = 1.00023613 to calibrate the secondary conductivity sensor. The mean residual conductivity differences between the salinity sample conductivity and CTD sensor conductivity were 0.0000 ± 0.0011 for the primary sensor and 0.0000 ± 0.0012 for the secondary sensor.
Dissolved oxygen The stainless steel CTD frame was equipped with a SBE43 dissolved oxygen sensor which was calibrated against discrete oxygen samples measured via Winkler titration. The appropriate calibration was found to fit a linear regression between the sensor measurements and the sample measurements. The calibration equation thus obtained was: calibrated dissolved oxygen (ml/l) = sensor dissolved oxygen (ml/l) * 1.01454 - 0.05330 (ml/l). The mean residual after calibration was 0.0000355 ± 0.021 (ml/l), obtained by subtracting SBE43 oxygen measurements from the corresponding Winkler oxygen measurements. For the titanium framed CTD, no dissolved oxygen samples were collected, therefore a cross calibration with the stainless steel CTD was carried out to obtain the following calibration equation: calibrated dissolved oxygen (ml/l) = sensor dissolved oxygen (ml/l) * 1.0489 - 0.1404 (ml/l). The mean residual between stainless steel CTD and titanium CTD calibrated dissolved oxygen was -0.00002 ± 0.0369 (ml/l).
Processing by BODC of Titanium CTD data on cruise D354
Data Processing
The data were processed and calibrated by the originator and arrived at BODC in a total of 32 ASCII format files, one for each titanium framed CTD cast taken throughout the cruise.
Reformatting
Most of the parameters in the originator's files were transferred into an internal file format using BODC standard procedures. BODC derived parameters such as potential temperature and potential density were automatically calculated for both sensor pairs and included in the internal file format files, together with oxygen saturation.
Some parameters included in the originator's files have not been transferred into the internal format files, including - datacycle (number), day (DOY), hour (HHMMSS), potemp (deg.C), sigma0 (kg m-3), sigma2 (kg m-3), oxygen (ml l-1), oxygen_c (umol kg-1) and potemp2 (deg.c). These variables may have already been stored as metadata, or are automatically derived by BODC through standard procedures, or are additional derived parameters of limited use to the end user.
The following table lists all the parameters included in the internally reformatted files, showing how the originator's variables as named in the ASCII files were mapped to appropriate BODC parameter codes.
| Originator's Variable | Originator's Units | Description | BODC Parameter Code | BODC Units | Comments |
|---|---|---|---|---|---|
| lat | - | Latitude north (WGS84) by unspecified GPS system. | ALATGP01 | degrees | Originator confirmed degrees to be positive North. |
| lon | - | Longitude east (WGS84) by unspecified GPS system. | ALONGP01 | degrees | Originator confirmed degrees to be positive East. |
| press | db | Pressure (spatial co-ordinate) exerted by the water body by profiling pressure sensor and corrected to read zero at sea level. | PRESPR01 | dbar | Originator confirmed that 'db' stands for decibar. |
| temp | degC | Temperature of the water body by CTD or STD. | TEMPST01 | deg C | - |
| salin | psu | Practical salinity of the water body by CTD and computation using UNESCO 1983 algorithm. | PSALST01 | - | Salinity measured by the UNESCO 1983 algorithm has no units. |
| oxygen_x | umol l-1 | Concentration of oxygen {O2} per unit volume of the water body [dissolved plus reactive particulate phase] by in-situ sensor | DOXYZZ01 | µmol l-1 | - |
| fluor | ug l-1 | Concentration of chlorophyll-a {chl-a} per unit volume of the water body [particulate >unknown phase] by in-situ chlorophyll fluorometer. | CPHLPR01 | mg m-3 | 1:1 conversion from µg l-1 to mg m-3 to match the BODC parameter code. |
| trans | % | Transmittance (red light wavelength) per 25cm of the water body by 25cm path length red light transmissometer. | POPTDR01 | % | - |
| atten | m-1 | Attenuance (red light wavelength) per unit length of the water body by 25cm path length red light transmissometer. | ATTNDR01 | m-1 | - |
| backs | - | Attenuance due to volume scatter (660 nm wavelength at 117 degree incidence) by the water body by scattering photometer. | VSRDACTX | m-1nm-1sr-1 | BODC units confirmed by the manufacturer's instrument guide. |
| - | - | Saturation of oxygen {O2} in the water body [dissolved plus reactive particulate phase] | OXYSZZ01 | % | Derived during transfer. |
| - | - | Potential temperature of the water body by computation using UNESCO 1983 algorithm | POTMCV01 | deg C | Derived during transfer. |
| - | - | Sigma-theta of the water body by CTD and computation from salinity and potential temperature using UNESCO algorithm | SIGTPR01 | kg m-3 | Derived during transfer. |
Screening
Quality control flags were automatically added to data outside the expected parameter specific range during the reformatting process. All parameters in the internal format files were then visualised and screened using the in house software Edserplo, and any suspect data point was assigned a quality control flag.
The originator's files included temperature and salinity measurements from two sets of temperature and conductivity sensors mounted on the CTD. By default, the BODC reformatted files include parameters from only one set of sensors. The decision on which set of temperature and salinity measurements to keep is based on screening results. In this case, no significant difference in sensors performance was detected, therefore BODC made an arbitrary decision to keep the parameters from the primary temperature sensor (SBE 3P #2729) and primary conductivity sensor (SBE 4C #2858). The originator's parameters 'temp2' and 'salin2' from the secondary temperature and conductivity sensors respectively are therefore not included in the final data files.
Reference
Fofonoff and Millard (1983). Algorithms for computations of fundamental properties of seawater. UNESCO Technical Papers in Marine Science No 44, 53pp.
Project Information
Iron Biogeochemistry in the high latitude North Atlantic - Irminger Basin Iron Study (IBIS)
Funding
Funding was provided by NERC, in the form of four standard (full Economic Cost - fEC) grants with a total value of £528,607. The project was a study of the iron (Fe) biogeochemistry in the high latitude North Atlantic, with the results providing a better understanding of the role that nutrients like iron play in the growth of phytoplankton cells in the ocean. The gathered data were intended to help computer modellers to design improved climate models that would allow for better predictions of the extent of climate change over the next hundreds of years.
Project dates - 21 June 2007 to 08 November 2013.
Background
With the rise in carbon dioxide concentrations throughout the world, the importance of carbon-ingesting marine plants, such as phytoplankton is becoming more important. As phytoplankton take up atmospheric carbon dioxide, they are helping to reduce the atmospheric concentration. Recently it has been discovered that the phytoplankton in many of the world's oceans are lacking in iron. For example, in the Southern Ocean, phytoplankton cell growth is limited by very low iron concentrations. Thus, they do not remove as much carbon dioxide as they could. Recent studies have suggested that iron may even play a role in the phytoplankton growth in the high latitude North Atlantic, which was thought to be iron replete.
Objectives
The main objective of this project was to study the iron biogeochemistry of the high latitude North Atlantic, assess whether community productivity in parts of the high latitude North Atlantic was iron limited following the annual spring bloom, and to determine the factors which lead to this situation. This project studied whether iron was limiting phytoplankton growth in the study area, by undertaking two cruises and taking samples of water, sedimenting material, and atmospheric dust and rain. The project also directly investigated whether iron is limiting the growth of phytoplankton in water samples from the study area.
Participants
Organisations directly involved- University of Southampton, School of Ocean and Earth Science.
- University of Liverpool, Earth Surface Dynamics.
- University of Essex, Biological Sciences.
- University of East Anglia, Environmental Sciences.
- Prof. Eric Achterberg, University of Southampton, School of Ocean and Earth Science (Principal Investigator)
- Dr. Gary Fones, University of Portsmouth, School of Earth and Environmental Sciences
- Dr. Richard Sanders, National Oceanography Centre, Science and Technology
- Dr. Christopher Mark Moore, University of Southampton, School of Ocean and Earth Science
- Prof. Richard Geider University of Essex, Biological Sciences
- Prof. Tim Jickells, University of East Anglia, Environmental Sciences
- Prof. Ric Williams, University of Liverpool, Earth, Ocean and Ecological Sciences
Methodology
- Took samples of water, sediments, atmospheric dust and rain.
- Calculated the supply ratios of iron (Fe) to nitrogen (N), phosphorus (P) and carbon (C) to the surface oceans and in sedimenting material.
- Calculated the oceanic transfers of these elements using models.
- Assessed whether iron was limiting phytoplankton growth using both models and water samples analysis.
More information can be found within the Gateway to Research website.
Fieldwork
Two research cruises
- RRS Discovery D350 - 26 April 2010 to 09 May 2010. Departed from Govan, UK and arrived in Reykjavík, Iceland. Study area: North Atlantic Ocean - Irminger and Iceland Basins. Principal Scientist: Dr. Mark Moore, University of Southampton.
- RRS Discovery D354 - 10 July 2010 to 11 August 2010. Departed from Avonmouth, UK and arrived in Birkenhead, UK. Study area: North Atlantic Ocean - Iceland and Irminger Basins. Principal Scientist: Prof. Eric Achterberg, University of Southampton.
Instrumentation
- Stainless Steel CTD rosette
- Titanium CTD rosette
- VM ADCP 75 kHz
- VM ADCP 150 kHz
- Stand Alone Pump Systems (SAPS)
- PELAGRA - Neutrally Buoyant Sediment Traps
- Trace metal clean tow fish
- Seasoar with CTD, fluorometer and Laser Optical Plankton Counter (LOPC)
- Zooplankton nets
- Underway - Navigation, surface and meteorology
Data Activity or Cruise Information
Cruise
| Cruise Name | D354 |
| Departure Date | 2010-07-04 |
| Arrival Date | 2010-08-11 |
| Principal Scientist(s) | Eric Pieter Achterberg (University of Southampton School of Ocean and Earth Science) |
| Ship | RRS Discovery |
Complete Cruise Metadata Report is available here
Fixed Station Information
No Fixed Station Information held for the Series
BODC Quality Control Flags
The following single character qualifying flags may be associated with one or more individual parameters with a data cycle:
| Flag | Description |
|---|---|
| Blank | Unqualified |
| < | Below detection limit |
| > | In excess of quoted value |
| A | Taxonomic flag for affinis (aff.) |
| B | Beginning of CTD Down/Up Cast |
| C | Taxonomic flag for confer (cf.) |
| D | Thermometric depth |
| E | End of CTD Down/Up Cast |
| G | Non-taxonomic biological characteristic uncertainty |
| H | Extrapolated value |
| I | Taxonomic flag for single species (sp.) |
| K | Improbable value - unknown quality control source |
| L | Improbable value - originator's quality control |
| M | Improbable value - BODC quality control |
| N | Null value |
| O | Improbable value - user quality control |
| P | Trace/calm |
| Q | Indeterminate |
| R | Replacement value |
| S | Estimated value |
| T | Interpolated value |
| U | Uncalibrated |
| W | Control value |
| X | Excessive difference |
SeaDataNet Quality Control Flags
The following single character qualifying flags may be associated with one or more individual parameters with a data cycle:
| Flag | Description |
|---|---|
| 0 | no quality control |
| 1 | good value |
| 2 | probably good value |
| 3 | probably bad value |
| 4 | bad value |
| 5 | changed value |
| 6 | value below detection |
| 7 | value in excess |
| 8 | interpolated value |
| 9 | missing value |
| A | value phenomenon uncertain |
| B | nominal value |
| Q | value below limit of quantification |
