Metadata Report for BODC Series Reference Number 1807527
Metadata Summary
Problem Reports
Data Access Policy
Narrative Documents
Project Information
Data Activity or Cruise Information
Fixed Station Information
BODC Quality Flags
SeaDataNet Quality Flags
Metadata Summary
Data Description |
|||||||||||||||||||||||||||||
|
|||||||||||||||||||||||||||||
Data Identifiers |
|||||||||||||||||||||||||||||
|
|||||||||||||||||||||||||||||
Time Co-ordinates(UT) |
|||||||||||||||||||||||||||||
|
|||||||||||||||||||||||||||||
Spatial Co-ordinates | |||||||||||||||||||||||||||||
|
|||||||||||||||||||||||||||||
Parameters |
|||||||||||||||||||||||||||||
|
|||||||||||||||||||||||||||||
|
|||||||||||||||||||||||||||||
Problem Reports
No Problem Report Found in the Database
Data Access Policy
Open Data
These data have no specific confidentiality restrictions for users. However, users must acknowledge data sources as it is not ethical to publish data without proper attribution. Any publication or other output resulting from usage of the data should include an acknowledgment.
If the Information Provider does not provide a specific attribution statement, or if you are using Information from several Information Providers and multiple attributions are not practical in your product or application, you may consider using the following:
"Contains public sector information licensed under the Open Government Licence v1.0."
Narrative Documents
Chelsea Technologies Minipack CTD-F
The Minipack CTD is a titanium/acetyl conductivity-temperature-depth system that can be used for discrete profiles, installed on a data buoy or on a towed undulator. The instrument includes conductivity, temperature, depth and fluorometer sensors, incorporating a high-performance 24-channel data logging and transmission system which allows for the acquisition of up to 16 external channels (e.g., dissolved oxygen, pH, PAR, fluorescence, turbidity, transmissance etc.).
Specifications
| Sensor | Type | Range | Accuracy | Resolution |
| Temperature | Pt resistance | -2 to 35 °C | 0.003 °C | 0.0005 °C |
| Conductivity | Induction cell | 0 to 70 mmho cm-1 | 0.005 mmho cm-1 | 0.001 mmho cm-1 |
| Pressure | Strain gauge with | 0 to 600 dbar | 0.2 dbar | 0.01 dbar |
Optical sensor specifications
| Chlorophyll a | Rhodamine | Amido Rhodamine | Fluorescein | Nephelometer | Phycoerythrin | Phycocyanin | |
| Excitation wavelengths | 430/30 nm or 470/30 nm | 470/30 nm | 425/30 nm | 480/80 nm | *470/30 nm | 530/30 nm | 590/35 nm |
| Emission wavelengths | 685/30 nm | 590/45 nm | 550/30 nm | 530/30 nm | *470/30 nm | 580/30 nm | 645/35 nm |
| Concentration range | 0.03 - 100 µg L-1 | 0.03 - 100 µg L-1 | 0.04 - 200 µg L-1 | 0.03 - 100 µg L-1 | *0.04 - 100 FTU | 0.03 - 100 µg L-1 | 0.03 - 100 µg L-1 |
| Resolution | 0.01 µg L-1 | 0.01 µg L-1 | 0.025 µg L-1 | 0.01 µg L-1 | *0.01 FTU | 0.01 µg L-1 | 0.01 µg L-1 |
*the wavelengths for the turbidity filters are a customer option but must be in the range 400 to 700 nm. The same wavelength is used in both the excitation path and the emission path.
Further details can be found in the manufacturer's specification sheet.
OSMOSIS Cruise D381B Towed SeaSoar: Instrument description
SeaSoar vehicle and auxiliary sensors
For RRS Discovery cruise D381B, the SeaSoar vehicle had been prepared to carry the (NOC/Valeport) UV Nutrient Sensor (SUV-6/SUV-51), a PAR sensor, a Brooke Ocean laser optical plankton counter (LOPC), a second generation CTG Fast Repetition Rate Fluorometer (FRRFII), two oxygen sensors, three further fluorometric pigment sensors, a backscatter sensor and a bioluminescence sensor.
The table below lists more detailed information about the various sensors.
| Sensor Unit | Serial Number | Last calibration date (YYYY-MM-DD) | Comments |
|---|---|---|---|
| PENGUIN Submersible Linux Computer | PENGUIN1 | - | - |
| Chelsea TG Minipack CTD-f | 210012, 210035 | 2011-06-27, 2011-06-20 | - |
| Chelsea TG Fastracka-II FRRF-II | 07-6139-001 | 2012-05-08 | - |
| Chelsea TG Glowtracka Bioluminescence Sensor | 07-6244-002 | 2007-07-16 | - |
| Maurer Instruments Ltd Flow Meter Model SR150 | 2886 | - | Used as a sample agitator (not logged) |
| Chelsea TG 2. Hemispherical PAR sensor (Seasoar/FRRF) | 46/2835/08 | 2011-12-16 | - |
| Turner Cyclops mini fluorimeter - Chlorophyll "C" | 2100432 | - | - |
| Turner Cyclops mini fluorimeter - Phycoerythrin "E" | 2100594 | - | - |
| Turner Cyclops mini fluorimeter - CDOM "U" | 2100595 | - | - |
| Chelsea TG Unilux Nephelometer 2125-021-PL-D | 005 | 2010-04-14 | - |
| Aanderaa Optode 3975 Dissolved Oxygen | 891 | 2007-06-21 | - |
| Seabird SBE43 Dissolved Oxygen Sensor | 2061 | 2012-04-24 | - |
| New Valeport SUV-6 UV Nutrient Sensor | 17395 | - | Trial use |
| Evaluation Valeport SUV-51 UV Nutrient Sensor | 41426 | - | Trial use |
| ODIM LOPC Optical Plankton Counter (660m pressure case) | 10690 | - | - |
The following instruments were logged using the four serial ports in PENGUIN:
- /dev/ttyS0 Chelsea TG Minipack CTD-f (9600 baud)
- /dev/ttyS1 ODIM LOPC Optical Plankton Counter (115, 200 baud)
- /dev/ttyS2 NOC/Valeport SUV-6/51 UV Nutrient Sensor (9600/19, 200 baud)
- /dev/ttyS3 Chelsea TG Fastracka-II FRRF-II (115, 200 baud)
All the remaining instruments were logged using the auxiliary 0-5 VDC inputs of the Chelsea Minipack CTD-f
References
Allen, J. T. et al. (2012). 'Ocean Surface Mixing, Ocean Sub-mesoscale Interaction Study (OSMOSIS)'. Cruise Report National Oceanography Centre, University of Southampton.
Global Positioning Satellite System
A location system of unspecified make or model that determines location on the Earth's surface using the Global Positioning Satellite Network. Angular co-ordinates are given relative to WGS84 CRS. Other parameters such as platform velocity may be derived from this.
OSMOSIS Cruise D381B Towed SeaSoar: Originator's Data Processing
Originator's Protocol for Data Acquisition and Analysis
The RRS Discovery D381B was the second leg of cruise D381 funded by the NERC Consortium grant to support the Ocean Surface Mixing, Ocean Sub-mesoscale Interaction Study (OSMOSIS) project. OSMOSIS set out to explore the processes responsible for the deepening and shallowing of the oceanic mixed layer. Gliders were deployed to provide spatial coverage over a region approximately 20 km x 20 km throughout the year spanning September 2012 to September 2013.
D381B was a 19 day cruise sailing from Falmouth on the 14 September 2012, returning to Southampton on 3 October 2012.
Sample collection
During the cruise there were two spatial surveys conducted with a towed SeaSoar vehicle to map and diagnose the mesoscale and sub-mesoscale flows. Each SeaSoar survey was designed along the standard radiator format, though modified to avoid the cluster of moorings at the centre of the mapped region.
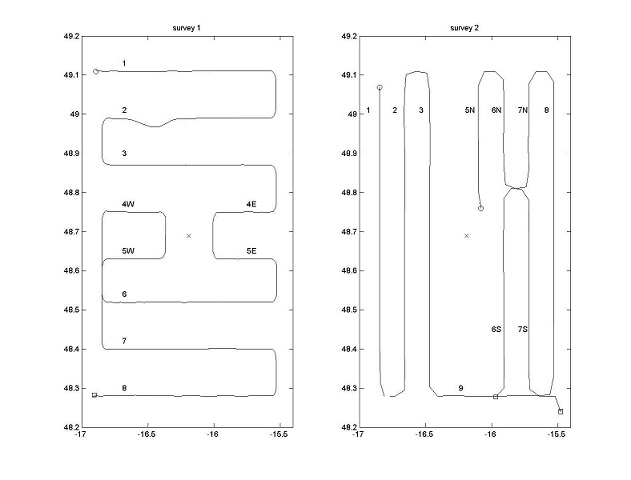
Figure 1. - Tracks for the two SeaSoar surveys. The cross marks the central mooring position. Other moorings within the central cluster are not shown. A circle marks the start of each tow whilst a box marks the end.
The first survey was successful with only being deployed and recovered at the start and end. Due to time constraints, the survey was carried out as a continuous survey rather than in quadrants. The survey was orientated with transects running west to east.
The second survey began just north east of the mooring array. Due to bad weather, the second survey was stopped on julian day 268 and only resumed on julian day 273. Bad weather also kept the SeaSoar below 50 m for parts of the survey. The survey plan was a slightly modified quadrant track, with each of the four quadrants representing a smaller radiator style survey. This deviation was to allow short segments to coincide with survey one for comparison. The second part of survey two was also interrupted on julian day 273 because of a power outage affecting the whole vessel.
During SeaSoar deployments data were recovered, in real time, from the PENGUIN data handling system on SeaSoar. In the case of the MiniPack and SUV-6 instruments, the files were buffered for transfer in PENGUIN and the master data files were recorded on the EMPEROR Linux PC in the main lab.
Data Processing
All of the variables output by the MiniPack CTDF were calibrated using pre-set calibrations stored in the instrument firmware. The sensors are sampled in the MiniPack at 16 Hz, but the data are averaged to 1 Hz prior to the output data stream from the MiniPack.
The following processing routines were carried out:
- Reads raw DAPS data into a PSTAR recognisable format. Sets up the data name and header information.
- Copies time from Julian day to seconds.
- Using this output, simple editing and calibration of the data is applied. This includes temperature correction, interpolation of pressure to remove absent data and salinity and density are calculated.
There was a small delay in the response of the temperature sensor, which was corrected before evaluating the salinity.
Tcorr = Traw + t ΔT
where ΔT is the temperature differences over the CTD's one second averaging interval and t is the time constant.
The only parameters processed were from the MiniPack CTDF and all other parameters were supplied to BODC as raw data.
Field Calibrations
The MiniPack CTDF salinity was calibrated against the traditional vertical CTD casts. The following offsets were applied to the raw data salinities:
- Survey 1 -0.22
- Survey 2 pre-storm +0.05 and post storm +0.04
The Originator did not include data from the Anderraa Optode oxygen sensor as it gave no usable data. The Originator also did not include data from the nutrient sensors which were on trial during this cruise.
OSMOSIS Cruise D381B Towed SeaSoar: Processing by BODC
Data Processing
The data arrived at BODC in two Pstar files representing the data collected from the towed SeaSoar auxillary sensors during cruise D381B. The data were reformatted to BODC's internal NetCDF format. The following table shows the mapping of variables within the Pstar file to the appropriate BODC parameter codes:
| Originator's Variable | Originator's Units | Description | BODC Parameter Code | BODC Units | Comment |
|---|---|---|---|---|---|
| distrun | kilometers | The along-track distance the platform has travelled since the start of the current cruise or mission. | DSRNCV01 | kilometers | - |
| press | dbar | Pressure (spatial co-ordinate) exerted by the water body by profiling pressure sensor and corrected to read zero at sea level | PRESPR01 | dbar | - |
| cond | millimho per centimetre | Electrical conductivity of the water body by CTD | CNDCST01 | Siemens per metre | Conversion *0.1 applied. |
| fluor | - | - | - | - | Not transferred |
| temp | Degrees Celsius | Temperature of the water body by CTD or STD | TEMPST01 | Degrees Celsius | - |
| salin | dimensionless | Practical salinity of the water body by CTD and computation using UNESCO 1983 algorithm and calibration against independent measurements | PSALCC01 | dimensionless | - |
| lat | degrees | Latitude north (WGS84) by unspecified GPS system | ALATGP01 | degrees | - |
| lon | degrees | Longitude east (WGS84) by unspecified GPS system | ALONGP01 | degrees | - |
| CDOM | - | - | - | - | Not transferred |
| SBE_Oxy | - | - | - | - | Good quality data in raw format. Not transferred |
| phyceryt | - | - | - | - | Not transferred |
| turb | - | - | - | - | Not transferred |
| TurFluor | - | - | - | - | Not transferred |
| Lumin | - | - | - | - | Not transferred |
| PAR | - | - | - | - | Not transferred |
| sigma0 | - | - | - | - | Not transferred |
| potemp | - | - | - | - | Not transferred |
| - | - | Sigma-theta of the water body by CTD and computation from salinity and potential temperature using UNESCO algorithm | SIGTPR01 | Kilograms per cubic metre | Derived by BODC |
| - | - | Potential temperature of the water body by computation using UNESCO 1983 algorithm | POTMCV01 | Degrees Celsius | Derived by BODC |
The parameters marked not transferred were not processed by BODC as these channels have not been worked up by the Originator and are suspected to be poor quality data. These raw channels are available on request from BODC.
The reformatted data were visualised using the in-house EDSERPLO software. Suspect data were marked by adding an appropriate quality control flag, missing data by both setting the data to an appropriate value and setting the quality control flag.
Project Information
Ocean Surface Mixing, Ocean Sub-mesoscale Interaction Study (OSMOSIS)
Background
The Ocean Surface Mixing, Ocean Sub-mesoscale Interaction Study (OSMOSIS) consortium was funded to deliver NERC's Ocean Surface Boundary Layer (OSBL) programme. Commencing in 2011, this multiple year study will combine traditional observational techniques, such as moorings and CTDs, with the latest autonomous sampling technologies (including ocean gliders), capable of delivering near real-time scientific measurements through the water column.
The OSMOSIS consortium aims to improve understanding of the OSBL, the interface between the atmosphere and the deeper ocean. This layer of the water column is thought to play a pivotal role in global climate and the productivity of our oceans.
OSMOSIS involves collaborations between scientists at various universities (Reading, Oxford, Bangor, Southampton and East Anglia) together with researchers at the National Oceanography Centre (NOC), Scottish Association for Marine Science (SAMS) and Plymouth Marine Laboratory (PML). In addition, there are a number of project partners linked to the consortium.
Scientific Objectives
- The primary goal of the fieldwork component of OSMOSIS is to obtain a year-long time series of the properties of the OSBL and its controlling 3D physical processes. This is achieved with an array of moorings (two nested clusters of 4 moorings, each centred around a central mooring) and gliders deployed near the Porcupine Abyssal Plain (PAP) observatory. Data obtained from this campaign will help with the understanding of these processes and subsequent development of associated parameterisations.
- OSMOSIS will attempt to create parameterisations for the processes which determine the evolving stratification and potential vorticity budgets of the OSBL.
- The overall legacy of OSMOSIS will be to develop new (physically based and observationally supported) parameterisations of processes that deepen and shoal the OSBL, and to implement and evaluate these parameterisations in a state-of-the-art global coupled climate model, facilitating improved weather and climate predictions.
Fieldwork
Three cruises are directly associated with the OSMOSIS consortium. Preliminary exploratory work in the Clyde Sea (September 2011) to hone techniques and strategies, followed by a mooring deployment and recovery cruise in the vicinity of the Porcupine Abyssal Plain (PAP) observatory (in late Summer 2012 and 2013 respectively). Additional opportunist ship time being factored in to support the ambitious glider operations associated with OSMOSIS.
Instrumentation
Types of instrumentation and measurements associated with the OSMOSIS observational campaign:
- Ocean gliders
- Wave rider buoys
- Towed SeaSoar surveys
- Microshear measurements
- Moored current meters, conductivity-temperature sensors and ADCPs
- Traditional shipboard measurements (including CTD, underway, discrete nutrients, LADCP, ADCP).
Contacts
| Collaborator | Organisation |
|---|---|
| Prof. Stephen Belcher | University of Reading, U.K |
| Dr. Alberto C Naveira Garabato | University of Southampton, U.K |
Data Activity or Cruise Information
Cruise
| Cruise Name | D381B |
| Departure Date | 2012-09-14 |
| Arrival Date | 2012-10-03 |
| Principal Scientist(s) | John T Allen (National Oceanography Centre, Southampton) |
| Ship | RRS Discovery |
Complete Cruise Metadata Report is available here
Fixed Station Information
No Fixed Station Information held for the Series
BODC Quality Control Flags
The following single character qualifying flags may be associated with one or more individual parameters with a data cycle:
| Flag | Description |
|---|---|
| Blank | Unqualified |
| < | Below detection limit |
| > | In excess of quoted value |
| A | Taxonomic flag for affinis (aff.) |
| B | Beginning of CTD Down/Up Cast |
| C | Taxonomic flag for confer (cf.) |
| D | Thermometric depth |
| E | End of CTD Down/Up Cast |
| G | Non-taxonomic biological characteristic uncertainty |
| H | Extrapolated value |
| I | Taxonomic flag for single species (sp.) |
| K | Improbable value - unknown quality control source |
| L | Improbable value - originator's quality control |
| M | Improbable value - BODC quality control |
| N | Null value |
| O | Improbable value - user quality control |
| P | Trace/calm |
| Q | Indeterminate |
| R | Replacement value |
| S | Estimated value |
| T | Interpolated value |
| U | Uncalibrated |
| W | Control value |
| X | Excessive difference |
SeaDataNet Quality Control Flags
The following single character qualifying flags may be associated with one or more individual parameters with a data cycle:
| Flag | Description |
|---|---|
| 0 | no quality control |
| 1 | good value |
| 2 | probably good value |
| 3 | probably bad value |
| 4 | bad value |
| 5 | changed value |
| 6 | value below detection |
| 7 | value in excess |
| 8 | interpolated value |
| 9 | missing value |
| A | value phenomenon uncertain |
| B | nominal value |
| Q | value below limit of quantification |
