Metadata Report for BODC Series Reference Number 1809823
Metadata Summary
Problem Reports
Data Access Policy
Narrative Documents
Project Information
Data Activity or Cruise Information
Fixed Station Information
BODC Quality Flags
SeaDataNet Quality Flags
Metadata Summary
Data Description |
|||||||||||||||||||||||||||||||||||||||||||||||||||||||||
|
|||||||||||||||||||||||||||||||||||||||||||||||||||||||||
Data Identifiers |
|||||||||||||||||||||||||||||||||||||||||||||||||||||||||
|
|||||||||||||||||||||||||||||||||||||||||||||||||||||||||
Time Co-ordinates(UT) |
|||||||||||||||||||||||||||||||||||||||||||||||||||||||||
|
|||||||||||||||||||||||||||||||||||||||||||||||||||||||||
Spatial Co-ordinates | |||||||||||||||||||||||||||||||||||||||||||||||||||||||||
|
|||||||||||||||||||||||||||||||||||||||||||||||||||||||||
Parameters |
|||||||||||||||||||||||||||||||||||||||||||||||||||||||||
|
|||||||||||||||||||||||||||||||||||||||||||||||||||||||||
|
|||||||||||||||||||||||||||||||||||||||||||||||||||||||||
Problem Reports
No Problem Report Found in the Database
RRS Discovery D376 Meteorology Quality Report
Light sensors
The PAR and TIR channels display consistent negative readings during night time. This most likely results from excessive loss of radiation after sunset, which suggests that day-time data recorded during cloud cover should also be treated with caution. Another explanation would be that outdated calibrations added an offset to the data. All negative PAR and TIR data were flagged. (BODC assessment)
Air temperature and Humidity
The originator has noted that errors started appearing in the air temperature and humidity sensor on 24th June 2012 09:22:10 GMT. The sensor was changed on 26th June 2012 14:45 GMT. The humidity data has been removed by the originator up to this point but the air temperature data is still present. The originator has warned that this data should be treated with caution.
BODC have flagged air temperature with 'L' flags up to the point that the sensor was changed.
Wind sensors
BODC could see suspect features in the Matlab file wind channels and so have used the TECHSAS files as the source to derive true wind speed and direction as these suspect features were not present. (BODC assessment)
Data Access Policy
Open Data
These data have no specific confidentiality restrictions for users. However, users must acknowledge data sources as it is not ethical to publish data without proper attribution. Any publication or other output resulting from usage of the data should include an acknowledgment.
If the Information Provider does not provide a specific attribution statement, or if you are using Information from several Information Providers and multiple attributions are not practical in your product or application, you may consider using the following:
"Contains public sector information licensed under the Open Government Licence v1.0."
Narrative Documents
Gill Instruments Windsonic Anemometer
The Gill Windsonic is a 2-axis ultrasonic wind sensor that monitors wind speed and direction using four transducers. The time taken for an ultrasonic pulse to travel from the North to the South transducers is measured and compared with the time for a pulse to travel from South to North. Travel times between the East and West transducers are similarly compared. The wind speed and direction are calculated from the differences in the times of flight along each axis. This calculation is independent of environmental factors such as temperature.
Specifications
| Ultrasonic output rate | 0.25, 0.5, 1, 2 or 4 Hz |
| Operating Temperature | -35 to 70°C |
| Operating Humidity | < 5 to 100% RH |
| Anemometer start up time | < 5 s |
| Wind speed | |
| Range | 0 to 60 m s-1 |
| Accuracy | ± 2% at 2 m s-1 |
| Resolution | 0.01 m s-1 |
| Response time | 0.25 s |
| Threshold | 0.01 m s-1 |
| Wind direction | |
| Range | 0 to 359° |
| Accuracy | ± 3° at 12 m s-1 |
| Resolution | 1° |
| Response time | 0.25 s |
Further details can be found in the manufacturer's specification sheet.
Kipp and Zonen Pyranometer Model CM6B
The CM6B pyranometer is intended for routine global solar radiation measurement research on a level surface. The CM6B features a sixty-four thermocouple junction (series connected) sensing element. The sensing element is coated with a highly stable carbon based non-organic coating, which delivers excellent spectral absorption and long term stability characteristics. The sensing element is housed under two concentric fitting Schott K5 glass domes.
Specifications
| Dimensions (W x H) | 150.0 mm x 91.5 mm |
|---|---|
| Weight | 850 grams |
| Operating Temperature | -40°C to +80°C |
| Spectral Range | 305 - 2800 nm (50% points) |
| Sensitivity | 9 -15 µV/W/m2 |
| Impedance (nominal) | 70 - 100 ohm |
| Response Time (95%) | 30 sec |
| Non-linearity | < ± 1.2% (<1000 W/m2) |
| Temperature dependence of sensitivity | < ± 2% (-10 to +40°C) |
| Zero-offset due to temperature changes | < ± 4 W/m2 at 5 K/h temperature change |
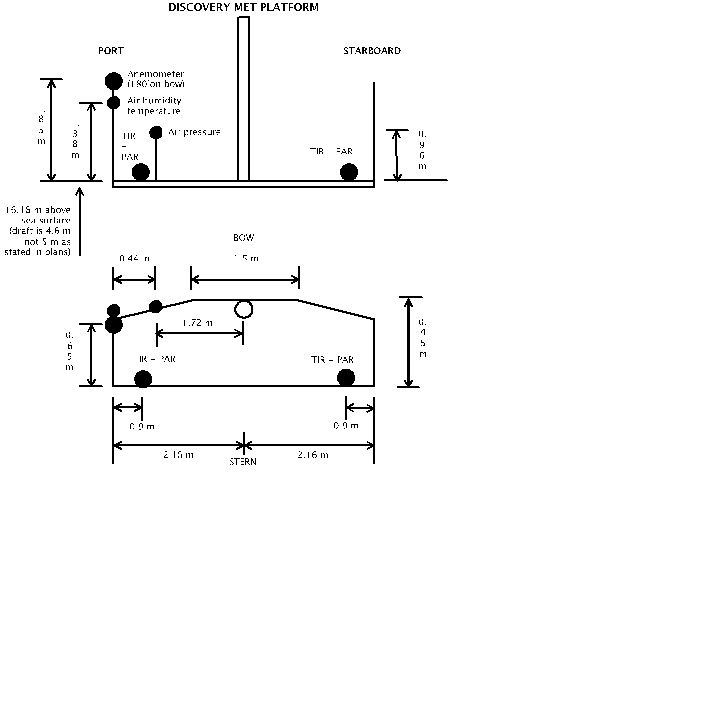
RRS Discovery D376 Meteorology Instrumentation
The meteorological suite of sensors was located on the forecastle deck, at approximately 17 m above sea level. The anemometer orientation was 0° on the bow.
| Manufacturer | Model | Serial number | Last manufacturer's calibration date | Comments |
| Skye | SKE 510 | 28559 | 22/07/2010 | Port |
| Skye | SKE 510 | 28556 | 07/06/2011 | Starboard |
| Kipp and Zonen | CM 6B | 962301 | 26/04/2011 | Port |
| Kipp and Zonen | CM 6B | 047462 | 26/07/2011 | Starboard |
| Gill | Windsonic | 71123 | - | No calibration required |
| Vaisala | Humidity and Temperature Probe HMP45A | B4950011 | 16/05/2012 | No calibration required |
| Vaisala | PTB110 Barometer Air pres | F4740025 | 15/05/2012 | No calibration required |
 |
Skye Instruments PAR Energy Sensor Model SKE 510
The SKE 510 is suitable for measuring photosynthetically active radiation (PAR) from natural or artificial light sources. The sensor is fully waterproof and guaranteed submersible to 4m depth, and indoor versions are also available.
The instrument uses a blue-enhanced planar diffused silicon detector to measure energy (in W m-2) over the 400-700 nm waveband. It has a cosine-corrected head and a square spectral response. The sensor can operate over a temperature range of -35 to 70 °C and a humidity range of 0-100% RH.
Specifications
| Sensitivity (current) | 1.5µA or 100 W m-2 |
|---|---|
| Sensitivity (voltage) | 1mV or 100 W m-2 |
| Working Range | 0-5000 W m-2 |
| Linearity error | 0.2% |
| Absolute calibration error | typ. less than 3% 5% max |
| Response time - voltage output | 10 ns |
| Cosine error | 3% |
| Azimuth error | less than 1% |
| Temperature co-efficient | ±0.1% per °C |
| Internal resistance - voltage output | c. 300 ohms |
| Longterm stability | ±2% |
| Material | Dupont 'Delrin' |
| Dimensions | 34 mm diameter 38mm height |
| Cable | 2 core screened 7 - 2 - 2C |
| Sensor Passband | 400 - 700 nm |
| Detector | Silicon photocell |
| Filters | Glass type and/or metal interference |
Vaisala PTB110 barometer
An industrial, analog barometer which uses a silicon capacitive sensor (BAROCAP). The sensor produces either frequency or voltage output and is mountable on a (35 mm wide) DIN rail.
Operating ranges (1 hPa = 1 mbar)
| Pressure ranges | 500 ... 1100 hPa 600 ... 1100 hPa 800 ... 1100 hPa 800 ... 1060 hPa 600 ... 1060 hPa |
| Temperature range | -40 ... +60 °C (-40 ... +140 °F) |
| Humidity range | non-condensing |
General
| Output voltage | 0 ... 2.5 VDC 0 ... 5 VDC |
| Output frequency | 500 ... 1100 Hz |
| Resolution | 0.1 hPa |
Accuracy
| Linearity* | ±0.25 hPa |
| Hysteresis* | ±0.03 hPa |
| Repeatability* | ±0.03 hPa |
| Pressure calibration uncertainty** | ±0.15 hPa |
| Accuracy at +20 °C*** | ±0.3 hPa |
| Total accuracy at: | |
| +15 ... +25 °C (+59 ... +77 °F) 0 ... +40 °C (+32 ... +104 °F) -20 ... +45 °C (-4 ... +113 °F) -40 ... +60 °C (-40 ... +140 °F) | ±0.3 hPa ±0.6 hPa ±1.0 hPa ±1.5 hPa |
* Defined as ±2 standard deviation limits of end-point non-linearity, hysteresis error or repeatability error.
** Defined as ±2 standard deviation limits of inaccuracy of the working standard including traceability to NIST.
*** Defined as the root sum of the squares (RSS) of end-point non-linearity, hysteresis error, repeatability error and calibration uncertainty at room temperature when using voltage output.
More detailed information can be found in the manufacturer's data sheet and user's guide.
Vaisala Temperature and Relative Humidity HMP Sensors
A family of sensors and instruments (sensors plus integral displays or loggers) for the measurement of air temperature and relative humidity. All are based on a probe containing a patent (HUMICAP) capacitive thin polymer film capacitanece humidity sensor and a Pt100 platinum resistance thermometer. The probes are available with a wide range of packaging, cabling and interface options all of which have designations of the form HMPnn or HMPnnn such as HMP45 and HMP230. Vaisala sensors are incorporated into weather stations and marketed by Campbell Scientific.
All versions operate at up to 100% humidity. Operating temperature ranges vary between models, allowing users to select the version best suited to their requirements.
Further details can be found in the manufacturer's specification sheets for the HMP 45 series, HMP 70 series and HMP 230 series.
RRS Discovery D376 Meteorology processing procedures
Originator's Data Processing
The meteorology data were logged by the TECHSAS (TECHnical and Scientific sensors Acquisition System) system into daily NetCDF files. The TECHSAS system is used as the main data logging system on NMF-SS operated research vessels. Data were additionally logged into the RVS Level-C format files.
Each Level-C file was read into Matlab so that further processing, calibration and quality control could be performed on selected variables.
The worst spiking from a number of channels was removed (turned into a NaN), by identifying measurements falling beyond x standard deviations of the median within a Δt second window. In exceptional cases, spikes were identified and removed manually. The window size and standard deviation used for each variable are detailed in the table below. A 10 second median smoothing window was also applied to these data streams.
In an attempt to account for shading of the sensors total PAR and TIR values were created by taking the maximum value recorded between the port and starboard sensors (TIR = max([PTIR STIR]), PAR = max([PPAR SPAR])). The de-spiked and smoothed versions of PPAR/SPAR and STIR/PTIR were used to do this.
The Matlab and TECHSAS meteorology files provided to BODC were used for BODC processing. Data were additionally logged into the RVS Level-C format files and TECHSAS which have been archived at BODC.
For more detailed information on the Originator's underway data processing, please see the cruise report
Files delivered to BODC
| Filename | Content description | Format | Interval | Start date/time (UTC) | End date/time (UTC) | Comments |
| D376_MET1_1sec.mat | Pressure, Humidity and air temperature | Matlab | 1 second | 11/06/2012 14:35:40 | 30/06/2012 23:00:00 | |
| D376_MET2_10sec.mat | Absolute wind speed, Absolute wind direction | Matlab | 10 seconds | 11/06/2012 14:35:40 | 30/06/2012 23:00:00 | |
| D376_PAR_1sec.mat | PAR | Matlab | 1 second | 11/06/2012 14:35:40 | 30/06/2012 23:00:00 | |
| D376_TIR_1sec.mat | TIR | Matlab | 1 second | 11/06/2012 14:35:40 | 30/06/2012 23:00:00 | |
| *-*-MET-SURFMET.SURFMETv2 | relative wind speed, relative wind direction | NetCDF | ~1 second. | 11/06/2012 13:02:11 | 02/07/2012 07:30:35 |
BODC Data Processing
The data were reformatted to BODC internal format using standard banking procedures. Data were reduced to 60 second intervals. The following table shows how variables within the file were mapped to appropriate BODC parameter codes:
D376_MET1_1sec.mat
| Originator's variable | Originator's units | Description | BODC Code | BODC Units | Unit conversion | Comments |
| daynum | Decimal Julian day number | Measure timestamp | Not transferred | |||
| dd | Matlab serial date number | Measure timestamp | Not transferred | |||
| Latitude | degree_north | Latitude north | Not transferred | |||
| Longitude | degree_east | Longitude east | Not transferred | |||
| Pressure | hPa | Atmospheric pressure | CAPHTU01 | millibar | none | |
| AirTemp | degree celsius | Air temperature | CDTAZZ01 | degrees celsius | none | |
| Humidity | % | Relative air humidity | CRELZZ01 | % | none |
D376_MET2_10sec.mat
| Originator's variable | Originator's units | Description | BODC Code | BODC Units | Unit conversion | Comments |
| daynum | Decimal Julian day number | Measure timestamp | Not transferred | |||
| dd | Matlab serial date number | Measure timestamp | Not transferred | |||
| Latitude | degree_north | Latitude north | Not transferred | |||
| Longitude | degree_east | Longitude east | Not transferred | |||
| AbsWindDir | degrees | True wind direction | Not transferred. Derived by BODC. | |||
| AbsWindSpd | m/s | True wind speed | Not transferred. Derived by BODC. |
D376_PAR_1sec.mat
| Originator's variable | Originator's units | Description | BODC Code | BODC Units | Unit conversion | Comments |
| daynum | Decimal Julian day number | Measure timestamp | Not transferred | |||
| dd | Matlab serial date number | Measure timestamp | Not transferred | |||
| Latitude | degree_north | Latitude north | Not transferred | |||
| Longitude | degree_east | Longitude east | Not transferred | |||
| PPAR | Volt x 105 | Port side PAR sensor | Not transferred - combined PAR transferred. | |||
| SPAR | Volt x 105 | Port side starboard sensor | Not transferred - combined PAR transferred. | |||
| PAR | W/m2 | PAR | DWIRRXMX | W/m2 | none | Maximum of starboard and port side PAR. |
D376_TIR_1sec.mat
| Originator's variable | Originator's units | Description | BODC Code | BODC Units | Unit conversion | Comments |
| daynum | Decimal Julian day number | Measure timestamp | Not transferred | |||
| dd | Matlab serial date number | Measure timestamp | Not transferred | |||
| Latitude | degree_north | Latitude north | Not transferred | |||
| Longitude | degree_east | Longitude east | Not transferred | |||
| PTIR | Volt x 105 | Port total irradiance | Not transferred - combined TIR transferred. | |||
| STIR | Volt x 105 | Starboard total irradiance | Not transferred - combined TIR transferred. | |||
| TIR | W/m2 | Starboard total irradiance | CSLRR1XS | W/m2 | none | Maximum of starboard and port side TIR. |
yyyymmdd-000000-MET-SURFMET.SURFMETv2
| Originator's variable | Originator's units | Description | BODC Code | BODC Units | Unit conversion | Comments |
| direct | degrees | Apparent wind direction | ERWDSS01 | degrees | none | |
| speed | m/s | Apparent wind speed | ERWSSS01 | m/s | none | |
| airtemp | degree celsius | Air temperature | Not transferred. | |||
| humid | % | Relative air humidity | Not transferred. | |||
| time | days since 1899-12-30 00:00:00 UTC | Acquisition time | Not transferred |
All data expressed at measurement altitude.
Screening
All the reformatted data were visualised using the in-house EDSERPLO software. Suspect data were marked by adding an appropriate quality control flag.
Calibrations
Field Calibrations
No field calibrations were applied to the data at BODC.
Manufacturers Calibrations
PAR/TIR
The following manufacturer's calibrations were applied to the PAR and TIR light sensors by the originator:
y (W m -2 ) = (a x 10 6 )/b
where 'a' is the raw data in volts and 'b' is the calibration offset (µV per W m -2 ) as shown below.
| Sensor | Serial no | location | offset (µV per W m -2 ) |
| PAR | 28559 | Port | 11.21 |
| PAR | 28556 | Starboard | 10.53 |
| TIR | 962301 | Port | 9.84 |
| TIR | 047462 | Port | 11.97 |
All the reformatted data were visualised using the in-house EDSERPLO software. Suspect data were marked by adding an appropriate quality control flag.
Absolute wind speed and direction
Relative wind speed and direction were corrected for the ship's heading and speed using the heading, ship velocities (calculated at BODC from the main positional channels) and an anemometer orientation of 0° on the bow, thus obtaining the BODC derived absolute wind speed and direction parameters, with codes EWSBSS01 and EWDASS01 respectively.
Air pressure
A manufacturer's calibration was not applied to the barometer because there was no significant offset reported on the certified calibration certificate.
Air temperature and humidity
Manufacturer's calibrations were not applied to the temperature and humidity probe because there were no significant offsets reported on the certified calibration certificate.
Project Information
Fluxes Across Sloping Topography of the North East Atlantic (FASTNEt)
Background
The FASTNEt consortium was funded to deliver NERC's Ocean Shelf Edge Exchange Programme. Commencing in October 2011, this four year study aims to couple established observational techniques, such as moorings and CTDs, with the very latest in autonomous sampling initiatives - including use of Autosub Long Range and gliders. With the aid of novel model techniques, these observations will be utilised to construct a new paradigm of Ocean/Shelf exchange.
Shelf edge regions mark the gateway between the world's deep oceans and shallower coastal seas, linking terrestrial, atmospheric and oceanic carbon pools and influencing biogeochemical fluxes. Shelf edge processes can influence near-shore productivity (and fisheries) and ultimately affect global climate.
FASTNEt brings together researchers from multiple UK organisations. Further collaboration has been established with five Project Partners: the UK Met Office, Marine Scotland Science, Agri-Food and Biosciences Institute, Marine Institute Ireland and Scripps Institution of Oceanography.
Scientific Objectives
- To determine the seasonality of physical gradients and exchange across the shelf edge by deploying new observational technologies (gliders, Autosub Long Range) and established techniques (long term moorings, drifters)
- To quantify key exchange mechanisms and to collect new data targeted at testing and improving high resolution models of the shelf edge, by carrying out detailed process studies in contrasting regions of the shelf edge of the NE Atlantic margin
- To develop a new parameterisation of shelf edge exchange processes suitable for regional-scale models, using improved resolution numerical, and new empirical models constrained by the observations
- To test the new parameterisations in a regional model in the context of making an assessment of inter-annual variability of ocean-shelf exchange.
Fieldwork
Three survey sites on the UK shelf edge have been selected for FASTNEt. These are a) the Celtic Sea shelf edge, b) Malin shelf and c) North Scotland shelf. Fieldwork is centred around two research cruises. The first, to the Celtic Sea, on RRS Discovery in June 2012. The second cruise visits the Malin shelf on RRS James Cook, during summer 2013. In addition to these dedicated cruises, opportunist cruise activity to the North Scotland shelf has been agreed with project partner Marine Scotland Science. Autonomous technologies will complement observations made during the cruises and provide knowledge of seasonal and inter-annual variability in exchange processes.
Instrumentation
Types of instruments/measurements:
- Gliders
- Autosub Long Range
- Drifter buoys
- Scanfish
- Microstructure profilers
- Moored CTD/CT loggers and ADCPs
- Shipboard measurements: CTD, underway, nutrients (and other discrete sampling), LADCP, ADCP.
Contacts
| Collaborator | Organisation |
|---|---|
| Prof. Mark Inall (lead) | Scottish Association for Marine Science, U.K |
| Dr. Jason Holt | National Oceanography Centre, U.K |
| Dr. Peter Miller | Plymouth Marine Laboratory, U.K |
| Dr. Mattias Green | Bangor University, U.K |
| Prof. Jonathan Sharples | University of Liverpool, U.K |
| Dr. Vasyl Vlasenko | University of Plymouth, U.K |
Data Activity or Cruise Information
Cruise
| Cruise Name | D376 |
| Departure Date | 2012-06-11 |
| Arrival Date | 2012-07-02 |
| Principal Scientist(s) | Mark E Inall (Scottish Association for Marine Science) |
| Ship | RRS Discovery |
Complete Cruise Metadata Report is available here
Fixed Station Information
No Fixed Station Information held for the Series
BODC Quality Control Flags
The following single character qualifying flags may be associated with one or more individual parameters with a data cycle:
| Flag | Description |
|---|---|
| Blank | Unqualified |
| < | Below detection limit |
| > | In excess of quoted value |
| A | Taxonomic flag for affinis (aff.) |
| B | Beginning of CTD Down/Up Cast |
| C | Taxonomic flag for confer (cf.) |
| D | Thermometric depth |
| E | End of CTD Down/Up Cast |
| G | Non-taxonomic biological characteristic uncertainty |
| H | Extrapolated value |
| I | Taxonomic flag for single species (sp.) |
| K | Improbable value - unknown quality control source |
| L | Improbable value - originator's quality control |
| M | Improbable value - BODC quality control |
| N | Null value |
| O | Improbable value - user quality control |
| P | Trace/calm |
| Q | Indeterminate |
| R | Replacement value |
| S | Estimated value |
| T | Interpolated value |
| U | Uncalibrated |
| W | Control value |
| X | Excessive difference |
SeaDataNet Quality Control Flags
The following single character qualifying flags may be associated with one or more individual parameters with a data cycle:
| Flag | Description |
|---|---|
| 0 | no quality control |
| 1 | good value |
| 2 | probably good value |
| 3 | probably bad value |
| 4 | bad value |
| 5 | changed value |
| 6 | value below detection |
| 7 | value in excess |
| 8 | interpolated value |
| 9 | missing value |
| A | value phenomenon uncertain |
| B | nominal value |
| Q | value below limit of quantification |
