Metadata Report for BODC Series Reference Number 1893691
Metadata Summary
Problem Reports
Data Access Policy
Narrative Documents
Project Information
Data Activity or Cruise Information
Fixed Station Information
BODC Quality Flags
SeaDataNet Quality Flags
Metadata Summary
Data Description |
|||||||||||||||||||||||||||||||||||||||||||||||||||||
|
|||||||||||||||||||||||||||||||||||||||||||||||||||||
Data Identifiers |
|||||||||||||||||||||||||||||||||||||||||||||||||||||
|
|||||||||||||||||||||||||||||||||||||||||||||||||||||
Time Co-ordinates(UT) |
|||||||||||||||||||||||||||||||||||||||||||||||||||||
|
|||||||||||||||||||||||||||||||||||||||||||||||||||||
Spatial Co-ordinates | |||||||||||||||||||||||||||||||||||||||||||||||||||||
|
|||||||||||||||||||||||||||||||||||||||||||||||||||||
Parameters |
|||||||||||||||||||||||||||||||||||||||||||||||||||||
|
|||||||||||||||||||||||||||||||||||||||||||||||||||||
|
|||||||||||||||||||||||||||||||||||||||||||||||||||||
Problem Reports
No Problem Report Found in the Database
RRS James Clark Ross JR20071129 (JR171, JR193, JR196 Leg1, JR212) CTD Data Quality Report.
During screening any obvious outliers and spikes were looked at in closer detail and flagged if necessary. There were no data quality comments provided by the originator.
Altimeter data (AHSFZZ01) were flagged 'M' when values were equal or greater than 100 or to improbable values as the sensor approached the sea floor. The altimeter only displays valid information when it is 100m above the seafloor.
Data Access Policy
Open Data
These data have no specific confidentiality restrictions for users. However, users must acknowledge data sources as it is not ethical to publish data without proper attribution. Any publication or other output resulting from usage of the data should include an acknowledgment.
If the Information Provider does not provide a specific attribution statement, or if you are using Information from several Information Providers and multiple attributions are not practical in your product or application, you may consider using the following:
"Contains public sector information licensed under the Open Government Licence v1.0."
Narrative Documents
Sea-Bird Dissolved Oxygen Sensor SBE 43 and SBE 43F
The SBE 43 is a dissolved oxygen sensor designed for marine applications. It incorporates a high-performance Clark polarographic membrane with a pump that continuously plumbs water through it, preventing algal growth and the development of anoxic conditions when the sensor is taking measurements.
Two configurations are available: SBE 43 produces a voltage output and can be incorporated with any Sea-Bird CTD that accepts input from a 0-5 volt auxiliary sensor, while the SBE 43F produces a frequency output and can be integrated with an SBE 52-MP (Moored Profiler CTD) or used for OEM applications. The specifications below are common to both.
Specifications
| Housing | Plastic or titanium |
| Membrane | 0.5 mil- fast response, typical for profile applications 1 mil- slower response, typical for moored applications |
| Depth rating | 600 m (plastic) or 7000 m (titanium) 10500 m titanium housing available on request |
| Measurement range | 120% of surface saturation |
| Initial accuracy | 2% of saturation |
| Typical stability | 0.5% per 1000 h |
Further details can be found in the manufacturer's specification sheet.
Instrument Description
CTD Unit and Auxiliary Sensors
One CTD package was used during JR20071129 (JR171, JR193, JR196 Leg1, JR212) comprising a Sea-Bird 911plus CTD system, auxiliary sensors and Sea-Bird SBE 24 carousel with 12 bottles fitted to a stainless steel frame.
| Instrument/Sensor | Serial Number | Manufacturer's Calibration Date | Comments |
|---|---|---|---|
| Sea-Bird SBE 9plus underwater unit (aluminium) | 09P-30856-0707 | Pressure sensor SN: 89973. Unit used until 14/12/2007, then replaced. | |
| Sea-Bird SBE 9plus underwater unit (aluminium) | 09P-20391-0541 | Pressure sensor SN: 75429. Unit used from 14/12/2007. | |
| Sea-Bird SBE 11plus deck unit | 11P-20391-0502 | ||
| Sea-Bird SBE 3P temperature sensor (aluminium) | 03P-2366 | 18/07/2007 | Primary |
| Sea-Bird SBE 3P temperature sensor (aluminium) | 03P-2307 | 20/07/2007 | Secondary |
| Sea-Bird SBE 4C conductivity sensor (titanium) | 04C-2289(T) | 17/07/2007 | Primary |
| Sea-Bird SBE 4C conductivity sensor (titanium) | 04C-2222(T) | 17/07/2007 | Secondary |
| Sea-Bird SBE 32 24-way carousel | |||
| Sea-Bird SBE 43 dissolved oxygen sensor (titanium) | 43-0245 | 12/06/2007 | |
| Chelsea MKIII Aquatracka fluorometer (titanium) | 088216 | 22/06/2006 | configured for chl-a |
| Biospherical QCD-905L underwater PAR sensor | 7274 | 26/07/2007 | Data not supplied in originator's files |
| Tritech PA-200 altimeter | 2130.26993 | ||
| Sea-Bird SBE 5T submersible pump (titanium) | 05T-4488 | primary | |
| Sea-Bird SBE 5T submersible pump (titanium) | 05T-4458 | secondary |
Sea-Bird Electronics SBE 911 and SBE 917 series CTD profilers
The SBE 911 and SBE 917 series of conductivity-temperature-depth (CTD) units are used to collect hydrographic profiles, including temperature, conductivity and pressure as standard. Each profiler consists of an underwater unit and deck unit or SEARAM. Auxiliary sensors, such as fluorometers, dissolved oxygen sensors and transmissometers, and carousel water samplers are commonly added to the underwater unit.
Underwater unit
The CTD underwater unit (SBE 9 or SBE 9 plus) comprises a protective cage (usually with a carousel water sampler), including a main pressure housing containing power supplies, acquisition electronics, telemetry circuitry, and a suite of modular sensors. The original SBE 9 incorporated Sea-Bird's standard modular SBE 3 temperature sensor and SBE 4 conductivity sensor, and a Paroscientific Digiquartz pressure sensor. The conductivity cell was connected to a pump-fed plastic tubing circuit that could include auxiliary sensors. Each SBE 9 unit was custom built to individual specification. The SBE 9 was replaced in 1997 by an off-the-shelf version, termed the SBE 9 plus, that incorporated the SBE 3 plus (or SBE 3P) temperature sensor, SBE 4C conductivity sensor and a Paroscientific Digiquartz pressure sensor. Sensors could be connected to a pump-fed plastic tubing circuit or stand-alone.
Temperature, conductivity and pressure sensors
The conductivity, temperature, and pressure sensors supplied with Sea-Bird CTD systems have outputs in the form of variable frequencies, which are measured using high-speed parallel counters. The resulting count totals are converted to numeric representations of the original frequencies, which bear a direct relationship to temperature, conductivity or pressure. Sampling frequencies for these sensors are typically set at 24 Hz.
The temperature sensing element is a glass-coated thermistor bead, pressure-protected inside a stainless steel tube, while the conductivity sensing element is a cylindrical, flow-through, borosilicate glass cell with three internal platinum electrodes. Thermistor resistance or conductivity cell resistance, respectively, is the controlling element in an optimized Wien Bridge oscillator circuit, which produces a frequency output that can be converted to a temperature or conductivity reading. These sensors are available with depth ratings of 6800 m (aluminium housing) or 10500 m (titanium housing). The Paroscientific Digiquartz pressure sensor comprises a quartz crystal resonator that responds to pressure-induced stress, and temperature is measured for thermal compensation of the calculated pressure.
Additional sensors
Optional sensors for dissolved oxygen, pH, light transmission, fluorescence and others do not require the very high levels of resolution needed in the primary CTD channels, nor do these sensors generally offer variable frequency outputs. Accordingly, signals from the auxiliary sensors are acquired using a conventional voltage-input multiplexed A/D converter (optional). Some Sea-Bird CTDs use a strain gauge pressure sensor (Senso-Metrics) in which case their pressure output data is in the same form as that from the auxiliary sensors as described above.
Deck unit or SEARAM
Each underwater unit is connected to a power supply and data logging system: the SBE 11 (or SBE 11 plus) deck unit allows real-time interfacing between the deck and the underwater unit via a conductive wire, while the submersible SBE 17 (or SBE 17 plus) SEARAM plugs directly into the underwater unit and data are downloaded on recovery of the CTD. The combination of SBE 9 and SBE 17 or SBE 11 are termed SBE 917 or SBE 911, respectively, while the combinations of SBE 9 plus and SBE 17 plus or SBE 11 plus are termed SBE 917 plus or SBE 911 plus.
Specifications
Specifications for the SBE 9 plus underwater unit are listed below:
| Parameter | Range | Initial accuracy | Resolution at 24 Hz | Response time |
|---|---|---|---|---|
| Temperature | -5 to 35°C | 0.001°C | 0.0002°C | 0.065 sec |
| Conductivity | 0 to 7 S m-1 | 0.0003 S m-1 | 0.00004 S m-1 | 0.065 sec (pumped) |
| Pressure | 0 to full scale (1400, 2000, 4200, 6800 or 10500 m) | 0.015% of full scale | 0.001% of full scale | 0.015 sec |
Further details can be found in the manufacturer's specification sheet.
Chelsea Technologies Group Aquatracka MKIII fluorometer
The Chelsea Technologies Group Aquatracka MKIII is a logarithmic response fluorometer. Filters are available to enable the instrument to measure chlorophyll, rhodamine, fluorescein and turbidity.
It uses a pulsed (5.5 Hz) xenon light source discharging along two signal paths to eliminate variations in the flashlamp intensity. The reference path measures the intensity of the light source whilst the signal path measures the intensity of the light emitted from the specimen under test. The reference signal and the emitted light signals are then applied to a ratiometric circuit. In this circuit, the ratio of returned signal to reference signal is computed and scaled logarithmically to achieve a wide dynamic range. The logarithmic conversion accuracy is maintained at better than one percent of the reading over the full output range of the instrument.
Two variants of the instrument are available, both manufactured in titanium, capable of operating in depths from shallow water down to 2000 m and 6000 m respectively. The optical characteristics of the instrument in its different detection modes are visible below:
| Excitation | Chlorophyll a | Rhodamine | Fluorescein | Turbidity |
|---|---|---|---|---|
| Wavelength (nm) | 430 | 500 | 485 | 440* |
| Bandwidth (nm) | 105 | 70 | 22 | 80* |
| Emission | Chlorophyll a | Rhodamine | Fluorescein | Turbidity |
| Wavelength (nm) | 685 | 590 | 530 | 440* |
| Bandwidth (nm) | 30 | 45 | 30 | 80* |
* The wavelengths for the turbidity filters are customer selectable but must be in the range 400 to 700 nm. The same wavelength is used in the excitation path and the emission path.
The instrument measures chlorophyll a, rhodamine and fluorescein with a concentration range of 0.01 µg l-1 to 100 µg l-1. The concentration range for turbidity is 0.01 to 100 FTU (other wavelengths are available on request).
The instrument accuracy is ± 0.02 µg l-1 (or ± 3% of the reading, whichever is greater) for chlorophyll a, rhodamine and fluorescein. The accuracy for turbidity, over a 0 - 10 FTU range, is ± 0.02 FTU (or ± 3% of the reading, whichever is greater).
Further details are available from the Aquatracka MKIII specification sheet.
Biospherical Instruments Log Quantum Cosine Irradiance Sensor QCD-905L
The QCD-905L is a submersible radiometer designed to measure irradiance over Photosynthetically Active Radiation (PAR) wavelengths (400-700 nm). It features a cosine directional response when fully immersed in water.
The sensor is a blue-enhanced high stability silicon photovoltaic detector with dielectric and absorbing glass filter assembly, and produces a logarithmic output. Normal output range is -1 to 6 volts with 1 volt per decade. Typically, the instrument outputs 5 volts for full sunlight and has a minimum output of 0.001% full sunlight, where typical noon solar irradiance is 1.5 to 2 x 10¹⁷ quanta cm-2 s-1. The instrument can be calibrated with constants for µE cm-2 s-1 or quanta cm-2 s-1.
The QCD-905L can be coupled to a fixed range data acquisition system like a CTD (Conductivity-Temperature-Depth) profiler or current meter. It has an aluminium and PET housing, and a depth rating of 7000 m.
Specifications
| Wavelength | 400 to 700 nm |
| Output range | -1 to 6 V, with 1 V decade-1 |
| Operating temperature | -2 to 35°C |
| Depth range | 0 - 7000 m |
Further details can be found in the manufacturer's manual.
Tritech PA-200 altimeter
Digital precision altimeter with 200 kHz signal giving highly accurate height off seabed and subsea distance measurements. Operates effectively between -10 °C and 40 °C at heights up to 50 m above the seabed. Standard depth rating is 4000 m, with 700 and 6800 m options. This term can be used for either the MKI or MKII version, which will be identified elsewhere in the supporting metadata.
For more information, please see these documents:
https://www.bodc.ac.uk/data/documents/nodb/pdf/pa200_pa500-altimeters.pdf
https://www.bodc.ac.uk/data/documents/nodb/pdf/pa200_pa500_MKII-altimeters.pdf
Paroscientific Absolute Pressure Transducers Series 3000 and 4000
Paroscientific Series 3000 and 4000 pressure transducers use a Digiquartz pressure sensor to provide high accuracy and precision data. The sensor comprises a quartz crystal resonator that responds to pressure-induced stress, and temperature is measured for thermal compensation of the calculated pressure.
The 3000 series of transducers includes one model, the 31K-101, whereas the 4000 series includes several models, listed in the table below. All transducers exhibit repeatability of better than ±0.01% full pressure scale, hysteresis of better than ±0.02% full scale and acceleration sensitivity of ±0.008% full scale /g (three axis average). Pressure resolution is better than 0.0001% and accuracy is typically 0.01% over a broad range of temperatures.
Differences between the models lie in their pressure and operating temperature ranges, as detailed below:
| Model | Max. pressure (psia) | Max. pressure (MPa) | Temperature range (°C) |
|---|---|---|---|
| 31K-101 | 1000 | 6.9 | -54 to 107 |
| 42K-101 | 2000 | 13.8 | 0 to 125 |
| 43K-101 | 3000 | 20.7 | 0 to 125 |
| 46K-101 | 6000 | 41.4 | 0 to 125 |
| 410K-101 | 10000 | 68.9 | 0 to 125 |
| 415K-101 | 15000 | 103 | 0 to 50 |
| 420K-101 | 20000 | 138 | 0 to 50 |
| 430K-101 | 30000 | 207 | 0 to 50 |
| 440K-101 | 40000 | 276 | 0 to 50 |
Further details can be found in the manufacturer's specification sheet.
BODC Processing
The data arrived at BODC in 10 Matlab files. These represented all of the BAS CTD casts taken during the cruise. The files were reformatted to the internal QXF format using standard procedures. The following tables show how the variables were mapped to appropriate BODC parameter codes:
| Originator's Variable | Units | BODC Parameter Code | Units | Comment |
|---|---|---|---|---|
| press | decibar | PRESPR01 | decibar | |
| temp1 | deg C | TEMPST01 | deg C | |
| cond1 | S m-1 | CNDCST01 | S m-1 | Conversion by /10 |
| temp2 | deg C | TEMPST02 | deg C | |
| cond2 | S m-1 | CNDCST02 | S m-1 | Conversion by /10 |
| altimeter | metres | AHSFZZ01 | metres | |
| oxy_ml_l | ml l-1 | DOXYZZ01 | µmol l-1 | Conversion by *44.66 |
| fluor_ug_l | µg l-1 | CPHLPR01 | mg m-3 | |
| PSALST01 | Derived by BODC | |||
| PSALST02 | Derived by BODC | |||
| POTMCV01 | deg C | Derived by BODC using standard procedures. | ||
| SIGTPR01 | deg C | Derived by BODC using standard procedures. | ||
| OXYSZZ01 | % | Derived by BODC using standard procedures. |
Files contained parameters that were not transferred because they were either not environmental data or were re-derived by BODC using standard procedures. These parameters were: gtime, lat, lon, sig0, sig2, sig4, potemp1 and potemp2
During ingestion procedures it was identified that the salinity data had been incorrectly derived by the originator where it was assumed that the Temperature was in ITS-90, when in fact the data were in ITS-68. BODC decided to re-derive salinity from the originator's Pressure, Temperature and Conductivity data using the Matlab sw_salt equation, which uses a Temperature of ITS-68. The Conductivity ration was found by applying the formula
- Cond ratio = Originator's cond/sw_c3515
The final files contain the data from the primary sensors, but data from duplicate sensors, as well as the originator's data are available upon request.
Originator's Data Processing
Sampling Strategy
A Conductivity-Temperature-Depth (CTD) unit was used on JR20071129 (JR171, JR193, JR196 Leg1, JR212) to produce vertical profiles of the temperature and salinity of the water column. Thirty-two stations were occupied across the Drake Passage SR1b transect, nine in Marguerite Trough and one in front of Rothera Base giving 42 casts in total.
A full-sized SBE 24 carousel water sampler, holding 12 bottles, connected to an SBE 9 plus CTD and an SBE 11 plus deck unit were used to collect vertical profiles of the water column. The deck unit provides power, real-time data acquisition and control. The underwater SBE 9 plus unit featured dual temperature and conductivity (SBE 4) sensors, and a Paroscientific pressure sensor. A T-C (temperature-conductivity) duct and a pump-controlled flow system ensure that the flow through the T-C duct is constant to minimize salinity spiking. Files containing the data are saved in binary and ASCII format. In addition, an altimeter, a fluorometer, an oxygen sensor and a PAR/Irradiance sensor were attached to the carousel. The altimeter gave real-time accurate measurements of height off the sea-bed once the instrument package was within approximately 100 m of the bottom. The Simrad EA600 system would sometimes lose the bottom or give erroneous readings on station, so care was needed to interpret these digitised records. The oxygen sensor SBE 43 had six seconds delay relative to the pressure sensor to account for the water transit time trough instrument. For all stations two UKORS LADCPs (one upward-looking, the other downward-looking) were attached to the main CTD frame and a fin was also added to the frame to reduce rotation of the package underwater.
Data Processing
NOC processing
The CTD data were logged via the deck unit to a 1.4 GHz P4 PC, running Seasave Win32 version 5.28e (Sea-Bird Electronics Inc.). This new software allows numerical data to be listed to the screen in real time, together with several graphs of various parameters.
Four files were created by the Seasave Win32 version 5.28e module for each station: a binary data file, an ASCII configuration file containing calibration information, an ASCII header file containing the sensor information and a file containing the data cycles at which a bottle was closed on the rosette where nn refers to the CTD cast number.
The CTD data were converted to ASCII and calibrated by running the Sea-Bird Electronics Inc. Data Processing software version 5.37b Data Conversion module. This program was used only to convert the data from binary, although it can be used to derive variables. This output an ASCII file 193ctdnn.cnv to match the names from previous cruises. The Sea-Bird Electronics Inc. Data Processing software version 5.37b was then used to apply a cell thermal mass correction. This correction takes the output from the data conversion program and re-derives the pressure and conductivity to take into account the temperature of the pressure sensor and the action of pressure on the conductivity cell. The final ASCII output file is of the form 193ctdnn_ctm.cnv. For further calibration details, see JR193 cruise report.
BAS processing
BAS in house Matlab scripts were used to process the casts performed in the Marguerite Trough and off Rothera. No further information was provided by the originator.
Post-cruise calibration
NOC procedures
Sally Close and Brian King carried out calibration of the CTD data for the JR193 casts at NOCS after completion of the cruise. The raw CTD data and sample data were used as input files and the data were processed using the NOCS in-house mstar processing routines. Corrections were calculated and applied to conductivity values, which were then reprocessed to provide corrected salinity values. Conductivity data for CTD sensors 1 and 2 were examined, and a slight pressure effect was noted for sensor 2. It was hence decided to correct the sensor 1 data for the calibration. Conductivity bottle and CTD sensor values were compared and residuals were examined with respect to station number. Suspected bad bottles were marked in the final data file using a quality flag, and a final correction was calculated using only data deeper than 900dbar, to remove surface variability.
A single uniform correction of +3.4*10-5 ± 3.4*10-5 was applied to the conductivity values of sensor 1 in the original 24Hz mstar files, corresponding to an approximate correction of +0.001 ± 0.001 in salinity. After correction, the mean value of the residuals was -1.1745*10-6, with a median of -1.4545*10-7 and an interquartile range of 3.3093*10-5. 72% of the values lie within 1 standard deviation of the mean, with 95% lying within 2 standard deviations.
BAS procedures
Calibration procedures involved an internal check between the primary and secondary sensors and comparison with salinity values. The results found can be found in the table below:
| Sensor difference | Mean and one standard deviation |
|---|---|
| T1-T2 | (0.6 ± 0.5) * 10-3°C |
| C1-C2 | (1.0 ± 0.4) * 10-3 mmho cm -1 |
| S1-S2 | (0.6 ±0.2) * 10-3 psu |
Project Information
BAS Long Term Monitoring and Survey
Introduction
The Long Term Monitoring and Survey project (LTMS) has been running since the British Antarctic Survey (BAS) was created. This project is one of the BAS core projects, with several groups of scientists collecting various types of data e.g biological, geological, atmospheric, among others.
Data collection is achievable through a wide scope of instruments and platforms, e.g. the Antarctic research stations, autonomous instrument platforms deployed on or from BAS research ships, BAS aircrafts, satellite remote sensing and others.
Scientific Objectives
This project was implemented in order to measure change and variability in the Earth system. Its long term duration allows for the monitoring of processes that could be missed in shorter term studies and experiments. The data collected is also used to check and improve the reliability of models used to stimulate and predict the behavior of the Earth system.
The main objectives are:
- Topographic survey
- Geosciences survey
- Biological survey and monitoring
- Atmospheric and oceanographic monitoring
Data Availability
The data sets obtained through this project are available to the academic community.
Data Activity or Cruise Information
Cruise
| Cruise Name | JR20071129 (JR171, JR193, JR196 Leg1, JR212) |
| Departure Date | 2007-11-29 |
| Arrival Date | 2007-12-09 |
| Principal Scientist(s) | Graham D Quartly (National Oceanography Centre, Southampton), Hugh J Venables (British Antarctic Survey), Miguel Angel Morales Maqueda (Proudman Oceanographic Laboratory) |
| Ship | RRS James Clark Ross |
Complete Cruise Metadata Report is available here
Fixed Station Information
Fixed Station Information
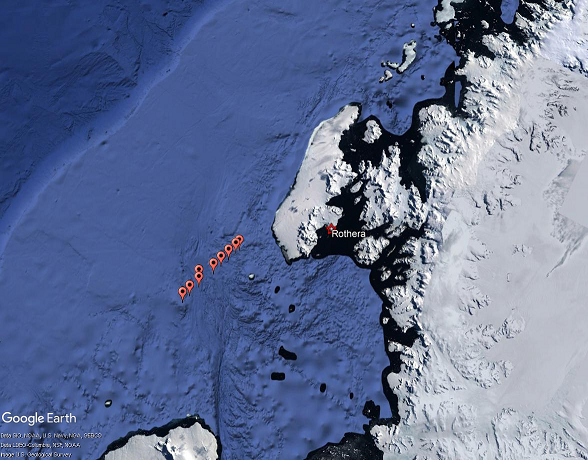
| Station Name | Marguerite Trough |
| Category | Offshore route/traverse |
Marguerite Trough section
This section runs across the Marguerite Trough, Antarctica and has been sporadically occupied by the British Antarctic Survey during their core cruises. Below are the coordinates delimiting the trough section:
| Latitude | Longitude | |
|---|---|---|
| North-West corner | 68° S | 71° W |
| South-East corner | 67°S | 69° W |
From
History of Occupations
| Cruise | Start Date | End Date | Country | PSO |
|---|---|---|---|---|
| RRS James Clark Ross JR20060215 (JR136, JR137) | 15-02-2006 | 17-02-2006 | United Kingdom | K. Weston |
| RRS James Clark Ross JR20071129 (JR171, JR193, JR196 Leg1, JR212) | 29-11-2007 | 09-12-2007 | United Kingdom | G Quartly, H. Venables and M. A. Morales Maqueda |
Related Fixed Station activities are detailed in Appendix 1
BODC Quality Control Flags
The following single character qualifying flags may be associated with one or more individual parameters with a data cycle:
| Flag | Description |
|---|---|
| Blank | Unqualified |
| < | Below detection limit |
| > | In excess of quoted value |
| A | Taxonomic flag for affinis (aff.) |
| B | Beginning of CTD Down/Up Cast |
| C | Taxonomic flag for confer (cf.) |
| D | Thermometric depth |
| E | End of CTD Down/Up Cast |
| G | Non-taxonomic biological characteristic uncertainty |
| H | Extrapolated value |
| I | Taxonomic flag for single species (sp.) |
| K | Improbable value - unknown quality control source |
| L | Improbable value - originator's quality control |
| M | Improbable value - BODC quality control |
| N | Null value |
| O | Improbable value - user quality control |
| P | Trace/calm |
| Q | Indeterminate |
| R | Replacement value |
| S | Estimated value |
| T | Interpolated value |
| U | Uncalibrated |
| W | Control value |
| X | Excessive difference |
SeaDataNet Quality Control Flags
The following single character qualifying flags may be associated with one or more individual parameters with a data cycle:
| Flag | Description |
|---|---|
| 0 | no quality control |
| 1 | good value |
| 2 | probably good value |
| 3 | probably bad value |
| 4 | bad value |
| 5 | changed value |
| 6 | value below detection |
| 7 | value in excess |
| 8 | interpolated value |
| 9 | missing value |
| A | value phenomenon uncertain |
| B | nominal value |
| Q | value below limit of quantification |
Appendix 1: Marguerite Trough
Related series for this Fixed Station are presented in the table below. Further information can be found by following the appropriate links.
If you are interested in these series, please be aware we offer a multiple file download service. Should your credentials be insufficient for automatic download, the service also offers a referral to our Enquiries Officer who may be able to negotiate access.
