Metadata Report for BODC Series Reference Number 1921510
Metadata Summary
Problem Reports
Data Access Policy
Narrative Documents
Project Information
Data Activity or Cruise Information
Fixed Station Information
BODC Quality Flags
SeaDataNet Quality Flags
Metadata Summary
Data Description |
|||||||||||||||||||||||||||||||||||||||||||||||||||||||||||||||||||||||||||||||||
|
|||||||||||||||||||||||||||||||||||||||||||||||||||||||||||||||||||||||||||||||||
Data Identifiers |
|||||||||||||||||||||||||||||||||||||||||||||||||||||||||||||||||||||||||||||||||
|
|||||||||||||||||||||||||||||||||||||||||||||||||||||||||||||||||||||||||||||||||
Time Co-ordinates(UT) |
|||||||||||||||||||||||||||||||||||||||||||||||||||||||||||||||||||||||||||||||||
|
|||||||||||||||||||||||||||||||||||||||||||||||||||||||||||||||||||||||||||||||||
Spatial Co-ordinates | |||||||||||||||||||||||||||||||||||||||||||||||||||||||||||||||||||||||||||||||||
|
|||||||||||||||||||||||||||||||||||||||||||||||||||||||||||||||||||||||||||||||||
Parameters |
|||||||||||||||||||||||||||||||||||||||||||||||||||||||||||||||||||||||||||||||||
|
|||||||||||||||||||||||||||||||||||||||||||||||||||||||||||||||||||||||||||||||||
|
|||||||||||||||||||||||||||||||||||||||||||||||||||||||||||||||||||||||||||||||||
Problem Reports
Meteorology
The Port TIR (CVLTRP01) sensor appears to be faulty. There is an offset between both sensors and the trend of the Port TIR sensor does not always follow the starboard TIR sensor. The most apparent difference can be seen at the daily maxium. The Port TIR channel was flagged accordingly.
Meteorology
The Port TIR (CSLRRP01) sensor appears to be faulty. There is an offset between both sensors and the trend of the Port TIR sensor does not always follow the starboard TIR sensor. The most apparent difference can be seen at the daily maxium. The entire Port TIR channel was flagged accordingly.
RRS James Cook JC145 Meteorology Quality Control Report
Wind sensors
The wind channels looks good overall. There were some periods where spiking is observed as wind speed is seen to accelerate in tandem with the wind changing direction rapidly. In addition, wind shielding is observed at various points throughout the dataset. These occurrences were flagged accordingly.
Light sensors
The port TIR channel appears to be faulty but the other light channels look good overall. The light channels show occasional shading on both the port and the starboard sensors. There are some drop-outs within the dataset. This is possibly due to sensor malfunctions. These were automatically flagged.
Air temperature, relative humidity and atmospheric pressure
The temperature, pressure and humidity readings are within their expected ranges. There are some drop-outs within the dataset. This is possibly due to sensor malfunctions. These were automatically flagged.
Data Access Policy
Open Data
These data have no specific confidentiality restrictions for users. However, users must acknowledge data sources as it is not ethical to publish data without proper attribution. Any publication or other output resulting from usage of the data should include an acknowledgment.
If the Information Provider does not provide a specific attribution statement, or if you are using Information from several Information Providers and multiple attributions are not practical in your product or application, you may consider using the following:
"Contains public sector information licensed under the Open Government Licence v1.0."
Narrative Documents
Gill Instruments Windsonic Anemometer
The Gill Windsonic is a 2-axis ultrasonic wind sensor that monitors wind speed and direction using four transducers. The time taken for an ultrasonic pulse to travel from the North to the South transducers is measured and compared with the time for a pulse to travel from South to North. Travel times between the East and West transducers are similarly compared. The wind speed and direction are calculated from the differences in the times of flight along each axis. This calculation is independent of environmental factors such as temperature.
Specifications
| Ultrasonic output rate | 0.25, 0.5, 1, 2 or 4 Hz |
| Operating Temperature | -35 to 70°C |
| Operating Humidity | < 5 to 100% RH |
| Anemometer start up time | < 5 s |
| Wind speed | |
| Range | 0 to 60 m s-1 |
| Accuracy | ± 2% at 2 m s-1 |
| Resolution | 0.01 m s-1 |
| Response time | 0.25 s |
| Threshold | 0.01 m s-1 |
| Wind direction | |
| Range | 0 to 359° |
| Accuracy | ± 3° at 12 m s-1 |
| Resolution | 1° |
| Response time | 0.25 s |
Further details can be found in the manufacturer's specification sheet.
Kipp and Zonen Pyranometer Model CM6B
The CM6B pyranometer is intended for routine global solar radiation measurement research on a level surface. The CM6B features a sixty-four thermocouple junction (series connected) sensing element. The sensing element is coated with a highly stable carbon based non-organic coating, which delivers excellent spectral absorption and long term stability characteristics. The sensing element is housed under two concentric fitting Schott K5 glass domes.
Specifications
| Dimensions (W x H) | 150.0 mm x 91.5 mm |
|---|---|
| Weight | 850 grams |
| Operating Temperature | -40°C to +80°C |
| Spectral Range | 305 - 2800 nm (50% points) |
| Sensitivity | 9 -15 µV/W/m2 |
| Impedance (nominal) | 70 - 100 ohm |
| Response Time (95%) | 30 sec |
| Non-linearity | < ± 1.2% (<1000 W/m2) |
| Temperature dependence of sensitivity | < ± 2% (-10 to +40°C) |
| Zero-offset due to temperature changes | < ± 4 W/m2 at 5 K/h temperature change |
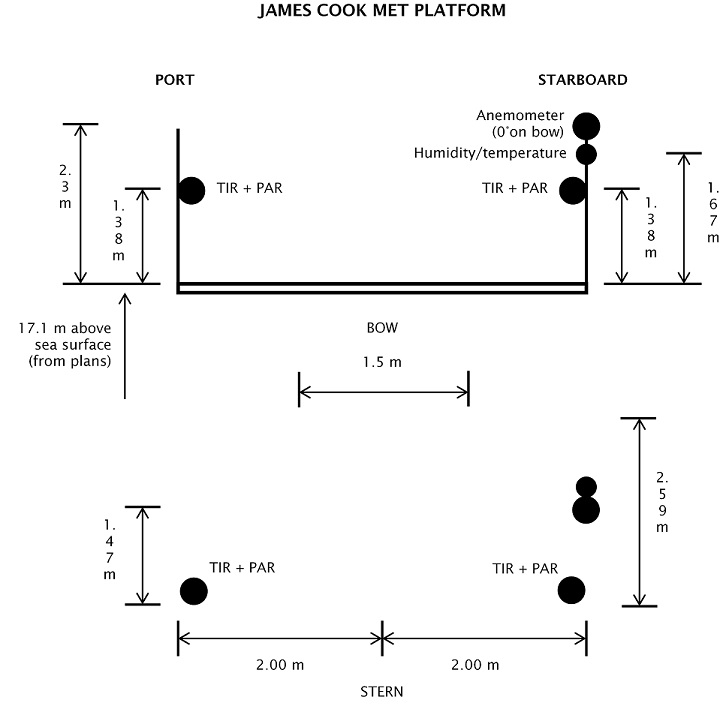
RRS James Cook JC145 Meteorology Instrumentation
Instrumentation
The meteorological suite of sensors was located on the forecastle deck, at approximately 17.1 m above sea level. The anemometer orientation was 0° on the bow.
| Manufacturer | Model | Serial number | Last manufacturer's calibration date | Comments |
| Skye | SKE 510 | 28559 | 11/09/2015 | Port |
| Skye | SKE 510 | 28560 | 11/09/2015 | Starboard |
| Kipp and Zonen | CM6B | 047462 | 01/06/2015 | Port |
| Kipp and Zonen | CM6B | 047463 | 15/06/2015 | Starboard |
| Gill | Windsonic | 064537 | N/A | No calibration required |
| Vaisala | Humidity and Temperature Probe HMP 45 | E105502 | 18/07/2016 | No calibration required |
| Vaisala | PTB110 Barometer Air pres | J0710001 | 12/04/2016 | No calibration required |
Skye Instruments PAR Energy Sensor Model SKE 510
The SKE 510 is suitable for measuring photosynthetically active radiation (PAR) from natural or artificial light sources. The sensor is fully waterproof and guaranteed submersible to 4m depth, and indoor versions are also available.
The instrument uses a blue-enhanced planar diffused silicon detector to measure energy (in W m-2) over the 400-700 nm waveband. It has a cosine-corrected head and a square spectral response. The sensor can operate over a temperature range of -35 to 70 °C and a humidity range of 0-100% RH.
Specifications
| Sensitivity (current) | 1.5µA or 100 W m-2 |
|---|---|
| Sensitivity (voltage) | 1mV or 100 W m-2 |
| Working Range | 0-5000 W m-2 |
| Linearity error | 0.2% |
| Absolute calibration error | typ. less than 3% 5% max |
| Response time - voltage output | 10 ns |
| Cosine error | 3% |
| Azimuth error | less than 1% |
| Temperature co-efficient | ±0.1% per °C |
| Internal resistance - voltage output | c. 300 ohms |
| Longterm stability | ±2% |
| Material | Dupont 'Delrin' |
| Dimensions | 34 mm diameter 38mm height |
| Cable | 2 core screened 7 - 2 - 2C |
| Sensor Passband | 400 - 700 nm |
| Detector | Silicon photocell |
| Filters | Glass type and/or metal interference |
Vaisala PTB110 barometer
An industrial, analog barometer which uses a silicon capacitive sensor (BAROCAP). The sensor produces either frequency or voltage output and is mountable on a (35 mm wide) DIN rail.
Operating ranges (1 hPa = 1 mbar)
| Pressure ranges | 500 ... 1100 hPa 600 ... 1100 hPa 800 ... 1100 hPa 800 ... 1060 hPa 600 ... 1060 hPa |
| Temperature range | -40 ... +60 °C (-40 ... +140 °F) |
| Humidity range | non-condensing |
General
| Output voltage | 0 ... 2.5 VDC 0 ... 5 VDC |
| Output frequency | 500 ... 1100 Hz |
| Resolution | 0.1 hPa |
Accuracy
| Linearity* | ±0.25 hPa |
| Hysteresis* | ±0.03 hPa |
| Repeatability* | ±0.03 hPa |
| Pressure calibration uncertainty** | ±0.15 hPa |
| Accuracy at +20 °C*** | ±0.3 hPa |
| Total accuracy at: | |
| +15 ... +25 °C (+59 ... +77 °F) 0 ... +40 °C (+32 ... +104 °F) -20 ... +45 °C (-4 ... +113 °F) -40 ... +60 °C (-40 ... +140 °F) | ±0.3 hPa ±0.6 hPa ±1.0 hPa ±1.5 hPa |
* Defined as ±2 standard deviation limits of end-point non-linearity, hysteresis error or repeatability error.
** Defined as ±2 standard deviation limits of inaccuracy of the working standard including traceability to NIST.
*** Defined as the root sum of the squares (RSS) of end-point non-linearity, hysteresis error, repeatability error and calibration uncertainty at room temperature when using voltage output.
More detailed information can be found in the manufacturer's data sheet and user's guide.
Vaisala Temperature and Relative Humidity HMP Sensors
A family of sensors and instruments (sensors plus integral displays or loggers) for the measurement of air temperature and relative humidity. All are based on a probe containing a patent (HUMICAP) capacitive thin polymer film capacitanece humidity sensor and a Pt100 platinum resistance thermometer. The probes are available with a wide range of packaging, cabling and interface options all of which have designations of the form HMPnn or HMPnnn such as HMP45 and HMP230. Vaisala sensors are incorporated into weather stations and marketed by Campbell Scientific.
All versions operate at up to 100% humidity. Operating temperature ranges vary between models, allowing users to select the version best suited to their requirements.
Further details can be found in the manufacturer's specification sheets for the HMP 45 series, HMP 70 series and HMP 230 series.
RRS James Cook JC145 Meteorology Data Processing Procedures
Originator's Data Processing
The data were logged by the TECHSAS (TECHnical and Scientific sensors Acquisition System) data logging system into daily NetCDF files. The daily TECHSAS NetCDF Meteorology files were converted to MSTAR by the originator. These were provided to BODC and used for BODC processing. Data were additionally logged into the RVS Level-C format files which have been archived at BODC.
Files delivered to BODC
| Filename | Content description | Format | Interval | Start date/time (UTC) | End date/time (UTC) | Comments |
| surfmet_jc145_trueav.nc | Ship speed, Relative wind speed, Relative wind direction, True wind speed, True wind direction | MSTAR | 1 min. | 28-Feb-2017 08:30:00 | 07-Apr-2017 00:00:00 | |
| met_light_jc145_01.nc | Air pressure, PAR, TIR | MSTAR | 1 sec. | 28-Feb-2017 08:30:00 | 06-Apr-2017 23:59:58 |
BODC Data Processing
The data were reformatted to BODC internal format using standard banking procedures. Data were averaged at 60 second intervals. The following table shows how variables within the file were mapped to appropriate BODC parameter codes:
yyyymmdd-000000-MET-SURFMET.SURFMETv2
| Originator's variable | Originator's units | Description | BODC Code | BODC Units | Unit conversion | Comments |
| relwind_dirship (direction towards) | degrees | Relative wind direction (direction from) | ERWDSS01 | degrees | none | relwind_dirship>180 = relwind_dirship-180; relwind_dirship>180 = relwind_dirship+180 |
| relwind_spd | m/s | Relative wind speed | ERWSSS01 | m/s | none | |
| airtemp | degree celsius | Air temperature | CDTAZZ01 | degrees celsius | none | |
| humid | 100*Pa/Pa | Relative air humidity | CRELZZ01 | % | none | |
| time | days since 1899-12-30 00:00:00 UTC | Acquisition time | Not transferred |
yyyymmdd-000000-Light-SURFMET.SURFMETv2
| Originator's variable | Originator's units | Description | BODC Code | BODC Units | Unit conversion | Comments |
| ptir | dimensionless | Port total irradiance | CVLTRP01 | Volts | /100000 | |
| stir | dimensionless | Starboard total irradiance | CVLTRS01 | Volts | /100000 | |
| ppar | dimensionless | Port side PAR sensor | DVLTRPSD | Volts | /100000 | |
| spar | dimensionless | Port side starboard sensor | DVLTRSSD | Volts | /100000 | |
| pres | mbar | Atmospheric pressure | CAPHTU01 | millibar | none | |
| time | days since 1899-12-30 00:00:00 UTC | Acquisition time | Not transferred |
All data expressed at measurement altitude.
Calibrations
Field Calibrations
No field calibrations were applied to the data at BODC.
Manufacturers Calibrations
PAR/TIR
The following manufacturer's calibrations were applied to the PAR and TIR light sensors using:
y (W m -2 ) = (a x 10 6 )/b
where 'a' is the raw data in volts and 'b' is the calibration offset (µV per W m -2 ) as shown below.
| Sensor | Serial no | location | offset (µV per W m -2 ) |
| PAR | 28560 | Port | 9.799 |
| PAR | 28559 | Starboard | 10.77 |
| TIR | 047462 | Starboard | 11.87 |
| TIR | 047463 | Port | 10.62 |
All the reformatted data were visualised using the in-house EDSERPLO software. Suspect data were marked by adding an appropriate quality control flag.
Absolute wind speed and direction
Relative wind speed and direction were corrected for the ship's heading and speed using the POS MV gyro heading, ship velocities (calculated at BODC from the main positional channels) and an anemometer orientation of 0° on the bow, thus obtaining the BODC derived absolute wind speed and direction parameters, with codes EWSBSS01 and EWDASS01 respectively.
Air pressure
A manufacturer's calibration was not applied to the barometer because there was no significant offset reported on the certified calibration certificate.
Air temperature and humidity
Manufacturer's calibrations were not applied to the temperature and humidity probe because there were no significant offsets reported on the certified calibration certificate.
Project Information
Monitoring the Meridional Overturning Circulation at 26.5N (RAPIDMOC)
Scientific Rationale
There is a northward transport of heat throughout the Atlantic, reaching a maximum of 1.3PW (25% of the global heat flux) around 24.5°N. The heat transport is a balance of the northward flux of a warm Gulf Stream, and a southward flux of cooler thermocline and cold North Atlantic Deep Water that is known as the meridional overturning circulation (MOC). As a consequence of the MOC northwest Europe enjoys a mild climate for its latitude: however abrupt rearrangement of the Atlantic Circulation has been shown in climate models and in palaeoclimate records to be responsible for a cooling of European climate of between 5-10°C. A principal objective of the RAPID programme is the development of a pre-operational prototype system that will continuously observe the strength and structure of the MOC. An initiative has been formed to fulfill this objective and consists of three interlinked projects:
- A mooring array spanning the Atlantic at 26.5°N to measure the southward branch of the MOC (Hirschi et al., 2003 and Baehr et al., 2004).
- Additional moorings deployed in the western boundary along 26.5°N (by Prof. Bill Johns, University of Miami - project MOCHA) to resolve transport in the Deep Western Boundary Current (Bryden et al., 2005). These moorings allow surface-to-bottom density profiles along the western boundary, Mid-Atlantic Ridge, and eastern boundary to be observed. As a result, the transatlantic pressure gradient can be continuously measured.
- Monitoring of the northward branch of the MOC using submarine telephone cables in the Florida Straits (Baringer et al., 2001) led by Dr Molly Baringer (NOAA/AOML/PHOD) - Western Boundary Time Series (WBTS) project.
The UK-led monitoring array system was recovered and redeployed annually until 2008 under RAPID funding. From 2008 until 2015 the array continued to be serviced annually under RAPID-WATCH funding. From 2015 until 2021 the array was serviced under RAPID-AMOC funding. Since 2022 the servicing of the array has continued to be funded by the Natural Environment Research Council (NERC). The US-led projects are funded by the National Science Foundation (NSF) (MOCHA project) and NOAA Office of Climate Observations (WBTS project).
The array will be focussed on three regions, the Eastern Boundary (EB), the Mid Atlantic Ridge (MAR) and the Western Boundary (WB). The geographical extent of these regions are as follows:
- Eastern Boundary (EB) array defined as a box with the south-east corner at 23.5°N, 25.5°W and the north-west corner at 29.0°N, 12.0°W
- Mid Atlantic Ridge (MAR) array defined as a box with the south-east corner at 23.0°N, 52.1°W and the north-west corner at 26.5°N, 40.0°W
- Western Boundary (WB) array defined as a box with the south-east corner at 26.0°N, 77.5°W and the north-west corner at 27.5°N, 69.5°W
References
Baehr, J., Hirschi, J., Beismann, J.O. and Marotzke, J. (2004) Monitoring the meridional overturning circulation in the North Atlantic: A model-based array design study. Journal of Marine Research, Volume 62, No 3, pp 283-312.
Baringer, M.O'N. and Larsen, J.C. (2001) Sixteen years of Florida Current transport at 27N Geophysical Research Letters, Volume 28, No 16, pp3179-3182
Bryden, H.L., Johns, W.E. and Saunders, P.M. (2005) Deep Western Boundary Current East of Abaco: Mean structure and transport. Journal of Marine Research, Volume 63, No 1, pp 35-57.
Hirschi, J., Baehr, J., Marotzke J., Stark J., Cunningham S.A. and Beismann J.O. (2003) A monitoring design for the Atlantic meridional overturning circulation. Geophysical Research Letters, Volume 30, No 7, article number 1413 (DOI 10.1029/2002GL016776)
RAPID Climate Change - Atlantic Meridional Overturning Circulation (RAPID-AMOC)
RAPID-AMOC is an £8.4 million, 7 year (2013-2020) research programme that builds on the success of the Natural Environment Research Council's (NERC) RAPID and RAPID-WATCH programmes and will deliver a 16 year long time series of the Atlantic Meridional Overturning Circulation (AMOC).
Background
The Atlantic Meridional Overturning Circulation (AMOC) is a critical element in the energy balance of the global climate system. The AMOC consists of a near-surface, warm northward flow of ocean water, compensated by a colder southward return flow at depth. This heat is transferred from the ocean to the atmosphere at mid-latitudes, with a substantial impact on climate and, in particular, on that of the UK and northwest Europe.
Observing and understanding changes in the AMOC is critically important for identifying the mechanisms of decadal climate variability and change, and for interannual-to-decadal climate prediction. This includes predicting changes in the location, frequency and intensity of Atlantic hurricanes, storms in the North Atlantic and over Europe, shifts in tropical and European precipitation patterns, and the response of sea level to changing radiative forcing. Sustained observations are also critical for assessing the possibility of abrupt change in the AMOC that are known to occur in palaeoclimatic records.
Since 2004 the NERC RAPID and RAPID-WATCH programmes, in partnership with the National Science Foundation and the National Oceanic and Atmospheric Administration in the US, have supported an observing system to continuously measure the AMOC at 26.5°N via a trans-basin array of moored instruments. This measures the basin-wide strength and vertical structure of the AMOC, and its components.
Observations from the array have already revolutionised understanding of AMOC variability and documented its variability on seasonal to interannual timescales. The first few years of observations, demonstrated the feasibility of AMOC measurement, provided new insights into the seasonal cycle, and allowed apparent trends in previous historical 'snapshots' to be seen in the context of natural variability. RAPID-AMOC will extend the AMOC time series.
Objective
RAPID-AMOC's overall objective is to determine the variability of the AMOC, and its links to climate and to the ocean carbon sink, on interannual-to-decadal time scales
This will be achieved by the continued support of the monitoring array and supporting the use of the data in three key areas:
- Application of array data for improved ocean state estimation;
- Use of array data to understand the role of the AMOC in climate variability and predictability;
- Addition of biogeochemical sensors to the array and use to constrain biogeochemical fluxes.
Three projects have been funded to address the objectives of RAPID-AMOC:
- Reanalysis of the AMOC
- DYNamics and predictability of the Atlantic Meridional Overturning and Climate (DYNAMOC)
- Atlantic BiogeoChemical fluxes (ABC Fluxes)
Data Activity or Cruise Information
Cruise
| Cruise Name | JC145 |
| Departure Date | 2017-02-28 |
| Arrival Date | 2017-04-08 |
| Principal Scientist(s) | David Smeed (National Oceanography Centre, Southampton) |
| Ship | RRS James Cook |
Complete Cruise Metadata Report is available here
Fixed Station Information
No Fixed Station Information held for the Series
BODC Quality Control Flags
The following single character qualifying flags may be associated with one or more individual parameters with a data cycle:
| Flag | Description |
|---|---|
| Blank | Unqualified |
| < | Below detection limit |
| > | In excess of quoted value |
| A | Taxonomic flag for affinis (aff.) |
| B | Beginning of CTD Down/Up Cast |
| C | Taxonomic flag for confer (cf.) |
| D | Thermometric depth |
| E | End of CTD Down/Up Cast |
| G | Non-taxonomic biological characteristic uncertainty |
| H | Extrapolated value |
| I | Taxonomic flag for single species (sp.) |
| K | Improbable value - unknown quality control source |
| L | Improbable value - originator's quality control |
| M | Improbable value - BODC quality control |
| N | Null value |
| O | Improbable value - user quality control |
| P | Trace/calm |
| Q | Indeterminate |
| R | Replacement value |
| S | Estimated value |
| T | Interpolated value |
| U | Uncalibrated |
| W | Control value |
| X | Excessive difference |
SeaDataNet Quality Control Flags
The following single character qualifying flags may be associated with one or more individual parameters with a data cycle:
| Flag | Description |
|---|---|
| 0 | no quality control |
| 1 | good value |
| 2 | probably good value |
| 3 | probably bad value |
| 4 | bad value |
| 5 | changed value |
| 6 | value below detection |
| 7 | value in excess |
| 8 | interpolated value |
| 9 | missing value |
| A | value phenomenon uncertain |
| B | nominal value |
| Q | value below limit of quantification |
