Metadata Report for BODC Series Reference Number 1964884
Metadata Summary
Problem Reports
Data Access Policy
Narrative Documents
Project Information
Data Activity or Cruise Information
Fixed Station Information
BODC Quality Flags
SeaDataNet Quality Flags
Metadata Summary
Data Description |
|||||||||||||||||||||||||||||||||||||||||||||||||||||||||
|
|||||||||||||||||||||||||||||||||||||||||||||||||||||||||
Data Identifiers |
|||||||||||||||||||||||||||||||||||||||||||||||||||||||||
|
|||||||||||||||||||||||||||||||||||||||||||||||||||||||||
Time Co-ordinates(UT) |
|||||||||||||||||||||||||||||||||||||||||||||||||||||||||
|
|||||||||||||||||||||||||||||||||||||||||||||||||||||||||
Spatial Co-ordinates | |||||||||||||||||||||||||||||||||||||||||||||||||||||||||
|
|||||||||||||||||||||||||||||||||||||||||||||||||||||||||
Parameters |
|||||||||||||||||||||||||||||||||||||||||||||||||||||||||
|
|||||||||||||||||||||||||||||||||||||||||||||||||||||||||
|
|||||||||||||||||||||||||||||||||||||||||||||||||||||||||
Problem Reports
Transmittance POPTDR01
The Transmissometer POPTDR01 channel data contains spurious spikes and shows parts of arbitrary decline in data values. The signal increases when the sensor is cleaned suggesting trapped bubbles. These data points have been flagged accordingly.
Transmittance ATTNDR01
The Transmissometer ATTNDR01 channel data contains spurious spikes and shows parts of arbitrary decline in data values. The signal increases when the sensor is cleaned suggesting trapped bubbles. These data points have been flagged accordingly.
Transmittance TVLTDR01
The Transmissometer TVLTDR01 channel data contains spurious spikes and shows parts of arbitrary decline in data values. The signal increases when the sensor is cleaned suggesting trapped bubbles. These data points have been flagged accordingly.
RRS James Cook JC156 Surface Hydrography Quality Control Report
Fluorescence
Other than when the non-toxic supply has been switched off, the fluorometer data appears to be good.
SST and housing temperature, conductivity and salinity
The housing temperature readings are slightly (approximately 0.15 degrees) warmer than the remote temperature values and features a 5 minute delay. To account for the time delay, the remote temperature channel was flagged to account for this time difference.
Salinity and conductivity channels look good and were flagged when the channel was cleaned and obvious anomalous data.
| Date | Time | Event |
| 21/12/2017 | - | Underway Started (Begin) |
| 28/12/2017 | 14:45:00 | Underway Stopped |
| 28/12/2017 | 15:40:00 | Underway Restarted |
| 31/12/2017 | 10:43:00 | Underway Shutdown for cleaning |
| 31/12/2017 | 11:00:00 | Underway Restarted |
| 02/01/2018 | 13:58:00 | Underway Stopped |
| 03/01/2018 | 12:55:00 | Underway Restarted |
| 04/01/2018 | 13:57:00 | Underway Shutdown for cleaning |
| 04/01/2018 | 14:42:00 | Underway Restarted |
| 12/01/2018 | 15:40:00 | Underway Shutdown for cleaning |
| 12/01/2018 | 16:18:00 | Underway Restarted |
| 19/01/2018 | 19:02:00 | Underway Shutdown for cleaning |
| 19/01/2018 | 19:44:00 | Underway Restarted |
| 25/01/2018 | 16:23:00 | Underway Shutdown for cleaning |
| 25/01/2018 | 17:00:00 | Underway Restarted |
| 25/01/2018 | 18:25:00 | Underway Crashed |
| 25/01/2018 | 19:35:00 | Underway Restarted |
| 31/01/2018 | 12:47:00 | Underway Stopped (End) |
Data Access Policy
Open Data
These data have no specific confidentiality restrictions for users. However, users must acknowledge data sources as it is not ethical to publish data without proper attribution. Any publication or other output resulting from usage of the data should include an acknowledgment.
If the Information Provider does not provide a specific attribution statement, or if you are using Information from several Information Providers and multiple attributions are not practical in your product or application, you may consider using the following:
"Contains public sector information licensed under the Open Government Licence v1.0."
Narrative Documents
SeaBird Digital Oceanographic Thermometer SBE38
The SBE38 is an ultra-stable thermistor that can be integrated as a remote temperature sensor with an SBE21 Thermosalinograph or an SBE 45 Micro TSG, or as a secondary temperature sensor with an SBE 16 plus, 16plus-IM, 16plus V2, 16plus-IM V2 or 19plus V2 SEACAT CTD.
Temperature is determined by applying an AC excitation to reference resistances and an ultra-stable aged thermistor. The reference resistor is a hermetically sealed VISHAY. AC excitation and ratiometric comparison using a common processing channel removes measurement errors due to parasitic thermocouples, offset voltages, leakage currents and gain errors.
The SBE38 can operate in polled sampling, where it takes one sample and transmits the data, or in continuous sampling.
Specifications
| Depth rating | up to 10500 m |
| Temperature range | -5 to 35°C |
| Initial accuracy | ± 0.001°C |
| Resolution | 0.00025°C |
| Stability | 0.001°C in 6 months |
| Response time | 500 ms |
| Self-heating error | < 200 µK |
Further details can be found in the manufacturer's specification sheet.
WET Labs WETStar Fluorometers
WET Labs WETStar fluorometers are miniature flow-through fluorometers, designed to measure relative concentrations of chlorophyll, CDOM, uranine, rhodamineWT dye, or phycoerythrin pigment in a sample of water. The sample is pumped through a quartz tube, and excited by a light source tuned to the fluorescence characteristics of the object substance. A photodiode detector measures the portion of the excitation energy that is emitted as fluorescence.
Specifications
By model:
| Chlorophyll WETStar | CDOM WETStar | Uranine WETStar | Rhodamine WETStar | Phycoerythrin WETStar | |
|---|---|---|---|---|---|
| Excitation wavelength | 460 nm | 370 nm | 485 nm | 470 nm | 525 nm |
| Emission wavelength | 695 nm | 460 nm | 530 nm | 590 nm | 575 nm |
| Sensitivity | 0.03 µg l-1 | 0.100 ppb QSD | 1 µg l-1 | - | - |
| Range | 0.03-75 µg l-1 | 0-100 ppb; 0-250 ppb | 0-4000 µg l-1 | - | - |
All models:
| Temperature range | 0-30°C |
|---|---|
| Depth rating | 600 m |
| Response time | 0.17 s analogue; 0.125 s digital |
| Output | 0-5 VDC analogue; 0-4095 counts digital |
Further details can be found in the manufacturer's specification sheet, and in the instrument manual.
WETLabs C-Star transmissometer
This instrument is designed to measure beam transmittance by submersion or with an optional flow tube for pumped applications. It can be used in profiles, moorings or as part of an underway system.
Two models are available, a 25 cm pathlength, which can be built in aluminum or co-polymer, and a 10 cm pathlength with a plastic housing. Both have an analog output, but a digital model is also available.
This instrument has been updated to provide a high resolution RS232 data output, while maintaining the same design and characteristics.
Specifications
| Pathlength | 10 or 25 cm |
| Wavelength | 370, 470, 530 or 660 nm |
| Bandwidth | ~ 20 nm for wavelengths of 470, 530 and 660 nm ~ 10 to 12 nm for a wavelength of 370 nm |
| Temperature error | 0.02 % full scale °C-1 |
| Temperature range | 0 to 30°C |
| Rated depth | 600 m (plastic housing) 6000 m (aluminum housing) |
Further details are available in the manufacturer's specification sheet or user guide.
RRS James Cook JC156 Surface Hydrography Instrumentation
Instrumentation
The sea surface hydrographical suite of sensors was fed by the pumped-seawater, non-toxic supply. The depth of the seawater intake was at 5.5 m.
The following surface hydrology sensors were fitted:
| Manufacturer | Model | Serial number | Last manufacturer's calibration date | Comments |
| WETLabs WS3S Fluorimeter | WS3S | WS3S-134 | 27/10/2017 | |
| Surf Trans: Wetlabs CST | Wetlabs CST | CST-114PR | 19/12/2016 | |
| Sea-Bird Temperature sensor | SBE38 | 3854115-0489 | 25/10/2017 | |
| Sea-Bird | SBE45 TSG | 4548881-0485 | 05/01/2017 |
SeaBird MicroTSG Thermosalinograph SBE 45
The SBE45 MicroTSG is an externally powered instrument designed for shipboard measurement of temperature and conductivity of pumped near-surface water samples. The instrument can also compute salinity and sound velocity internally.
The MicroTSG comprises a platinum-electrode glass conductivity cell and a stable, pressure-protected thermistor temperature sensor. It also contains an RS-232 port for appending the output of a remote temperature sensor, allowing for direct measurement of sea surface temperature.
The instrument can operate in Polled, Autonomous and Serial Line Sync sampling modes:
- Polled sampling: the instrument takes one sample on command
- Autonomous sampling: the instrument samples at preprogrammed intervals and does not enter quiescence (sleep) state between samples
- Serial Line Sync: a pulse on the serial line causes the instrument to wake up, sample and re-enter quiescent state automatically
Specifications
| Conductivity | Temperature | Salinity | |
|---|---|---|---|
| Range | 0 to 7 Sm-1 | -5 to 35°C | |
| Initial accuracy | 0.0003 Sm-1 | 0.002°C | 0.005 (typical) |
| Resolution | 0.00001 Sm-1 | 0.0001°C | 0.0002 (typical) |
| Typical stability (per month) | 0.0003 Sm-1 | 0.0002°C | 0.003 (typical) |
Further details can be found in the manufacturer's specification sheet.
RRS James Cook JC156 Surface Hydrography Data Processing Procedures
Originator's Data Processing
The data were logged by the TECHSAS (TECHnical and Scientific sensors Acquisition System) data logging system into daily NetCDF files which were provided to BODC for processing. Data was additionally logged into the RVS Level-C format which have been archived at BODC.
Files delivered to BODC
| Filename | Content description | Format | Interval | Start date/time (UTC) | End date/time (UTC) | Comments |
| yyyymmdd-000000-Surf-SURFMET.SURFMETv2 | Fluorescence and transmittance | NetCDF | 1 sec. | 20 Dec-2017 12:30:00 | 01-Feb-2018 14:30:00 | |
| yyyymmdd-000000-SBE45-SBE45.TSG | Housing Temperature, remote temperature, salinity and conductivity | NetCDF | 1 sec. | 20-Dec-2017 12:30:00 | 31-Jan-2018 13:06:38 |
BODC Data Processing
The files were reformatted to BODC internal format using standard data banking procedures. All files were averaged to 60 second intervals. The following table shows how the variables within the files were mapped to appropriate BODC parameter codes:
yyyymmdd-000000-Surf-SURFMET.SURFMETv2
| Originator's variable | Originator's units | Description | BODC Code | BODC Units | Unit conversion | Comments |
| trans | volts | Raw voltage measured by transmissometer | TVLTDR01 | volts | none | |
| fluo | volt | Raw voltage measured by fluorometer | FVLTWS01 | volt | none | |
| temp_h | degrees celcius | Housing water temperature | Not transferred | |||
| temp_m | degrees celcius | Remote temperature | Not transferred | |||
| cond | s/m | Conductivity | Not transferred | |||
| time | days since 1899-12-30 00:00:00 UTC | Acquisition time | Not transferred |
yyyymmdd-000000-SBE45-SBE45.TSG
| Originator's variable | Originator's units | Description | BODC Code | BODC Units | Unit conversion | Comments |
| salin | dimensionless | TSG salinity | PSALSU01 | dimensionless | none | |
| temp_h | degrees celcius | Housing water temperature | TMESSG01 | degrees celcius | none | |
| cond | s/m | Conductivity | CNDCSG01 | s/m | none | |
| temp_r | degrees celcius | Remote water temperature | TEMPHU01 | degrees celcius | none | |
| time | days since 1899-12-30 00:00:00 UTC | Acquisition time | Not transferred | |||
| sndspeed | m/s | TSG sound velocity | Not transferred |
All the reformatted data were visualised using the in-house EDSERPLO software. Suspect data were marked by adding an appropriate quality control flag.
Calibration
Field Calibrations
No field calibrations have been applied.
Manufacturers Calibrations
Transmissometer
The transmissometer voltage channel was converted to beam transmission ( beamtrans ) and beam attenuation ( atten ) as follows:
beamtrans [%] = ([ volts - Vdark ] / [ Vref - Vdark ])100
atten [per m] = (-1/ pathlength ) ln( beamtrans /100)
where Vdark = 0.058 V, Vref = 4.667 V and pathlength = 0.25 m.
Fluorometer
The fluorescence voltage channel was converted to engineering units ( chla ) using the following calibration:
chla [µg/L]= SF ( volts - CWO )
where SF = 11.6 µg/L/V and CWO = 0.050 V.
Project Information
FRidge: The impact of Mid-Ocean Ridges on the Ocean's Iron cycle
FRidge is a research project funded by the UK Natural Environment Research Council (NERC). It aims to explore hypotheses regarding the mechanisms that shape ocean iron distribution and in particular, the role of hydrothermal inputs from distinct vent sites along the Mid-Atlantic Ridge.
The project is part of the UK contribution to the international GEOTRACES programme. Research will take place along the GEOTRACES International Section GA13.
Introduction
Photosynthesis by marine phytoplankton contributes to the partitioning of carbon dioxide between the atmosphere and the ocean. Iron is essential for phytoplankton growth as it is required for a number of important enzymes that participate in both photosynthesis and respiration. Mid-ocean ridges are significant sources of iron to the ocean due to hydrothermal activity, with dramatic iron plumes that persist for thousands of kilometres away from the ridge.
The impact of hydrothermal iron on the ocean carbon cycle depends both on the longevity of the iron plumes and the mixing of iron into surface waters, with both aspects poorly constrained. Thus our understanding of how the ocean iron cycle functions is incomplete. This is important as the influence of ocean biology on ocean-atmosphere carbon dioxide exchanges via the biological pump is controlled by iron availability over large parts of the ocean.
Scientific Objectives
The main objectives of the project are to:
1. Document the changes in iron supply, cycling and speciation along the diverse hydrothermal systems of the northern Mid-Atlantic Ridge.
2. Link observational science with state of the art ocean modelling to assess the global influence of mid-ocean ridges on the ocean iron cycle and the sustenance of surface productivity.
To deliver on these objectives, a research expedition to the Atlantic Ocean was carried out to measure trace metals, nutrients and ocean physics over and around the Mid-Atlantic Ridge. Ultimately this will be able to address the broader question of how the amount of iron from mid-ocean ridges can influence phytoplankton growth in the open ocean.
Fieldwork
The FRidge cruise was completed aboard RRS James Cook cruise JC156, which ran between Southampton and Guadeloupe from the 20th of December 2017 to the 1st of February 2018. See the table below for details on what was sampled:
| Data Type | Description | Units |
| Trace elements | Dissolved trace metals (from Ti-Rosette) | nmol/L |
| Trace elements | Particulate trace metals (from Ti rosette) | µmol/L |
| Trace elements | Particulate trace metals (from SAPS) | µmol/L |
| Other chemical oceanographic elements | Helium | fmol/L |
| Phosphate | Phosphate (from SSR and Ti-Rosette) | µmol/L |
| Silicate | Silicate (from SSR and Ti-Rosette) | µmol/L |
| Nitrate | Nitrate (from SSR and Ti-Rosette) | µmol/L |
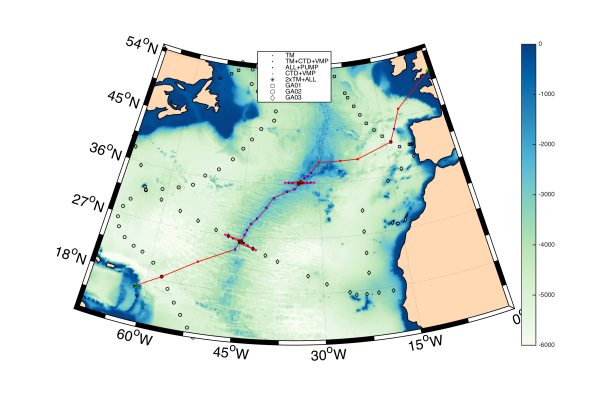
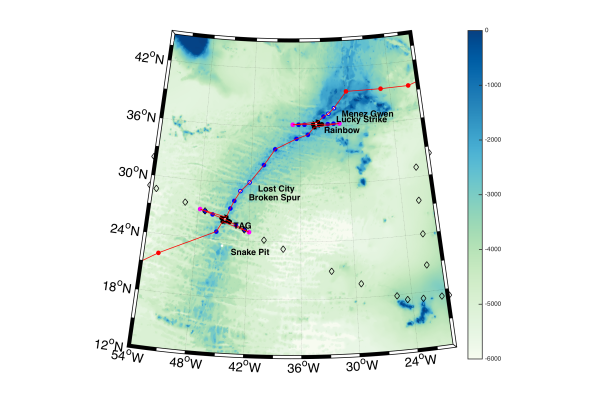
The above images show the locations of known hydrothermal vent systems and the dots represent locations where sampling took place.
Project Collaborators
The science delivered as part of this GEOTRACES section is greatly enhanced by the collaboration with a number of scientists from the following institutions:
- University of Southampton
- University of Liverpool
- Plymouth Marine Laboratory
- Oxford University
- University of South Florida
- University of Washington
- University of California Santa Barbara
- Woods Hole Oceanographic Institute
Scientific Personnel
- Alessandro Tagliabue (Cruise Chief Scientist, University of Liverpool, UK)
- Maeve Lohan (University of Southampton, UK)
- Andy Heath (University of Liverpool, UK)
- Alastair Lough (University of Southampton, UK)
- Shaun Rigby (University of Liverpool, UK)
Project Partners
- Alex Baker (University of East Anglia)
- William Jenkins (Woods Hole Oceanographic Institute)
- Brandy Toner (University of Minnesota)
Funding
This is a NERC funded research project. Funding was provided in the form of two fellowship and training grants.Total value of £527,588. The lead/parent grant reference number is NE/N010396/1 led by Maeve Lohan and the child grant NE/N009525/1 is led by Alessandro Tagliabue.
Period of Award: 4 Sep 2017 - 3 Mar 2020
Data Activity or Cruise Information
Cruise
| Cruise Name | JC156 (FRidGE, GA13) |
| Departure Date | 2017-12-20 |
| Arrival Date | 2018-02-01 |
| Principal Scientist(s) | Alessandro Tagliabue (National Oceanography Centre, Southampton) |
| Ship | RRS James Cook |
Complete Cruise Metadata Report is available here
Fixed Station Information
No Fixed Station Information held for the Series
BODC Quality Control Flags
The following single character qualifying flags may be associated with one or more individual parameters with a data cycle:
| Flag | Description |
|---|---|
| Blank | Unqualified |
| < | Below detection limit |
| > | In excess of quoted value |
| A | Taxonomic flag for affinis (aff.) |
| B | Beginning of CTD Down/Up Cast |
| C | Taxonomic flag for confer (cf.) |
| D | Thermometric depth |
| E | End of CTD Down/Up Cast |
| G | Non-taxonomic biological characteristic uncertainty |
| H | Extrapolated value |
| I | Taxonomic flag for single species (sp.) |
| K | Improbable value - unknown quality control source |
| L | Improbable value - originator's quality control |
| M | Improbable value - BODC quality control |
| N | Null value |
| O | Improbable value - user quality control |
| P | Trace/calm |
| Q | Indeterminate |
| R | Replacement value |
| S | Estimated value |
| T | Interpolated value |
| U | Uncalibrated |
| W | Control value |
| X | Excessive difference |
SeaDataNet Quality Control Flags
The following single character qualifying flags may be associated with one or more individual parameters with a data cycle:
| Flag | Description |
|---|---|
| 0 | no quality control |
| 1 | good value |
| 2 | probably good value |
| 3 | probably bad value |
| 4 | bad value |
| 5 | changed value |
| 6 | value below detection |
| 7 | value in excess |
| 8 | interpolated value |
| 9 | missing value |
| A | value phenomenon uncertain |
| B | nominal value |
| Q | value below limit of quantification |
