Metadata Report for BODC Series Reference Number 2012149
Metadata Summary
Problem Reports
Data Access Policy
Narrative Documents
Project Information
Data Activity or Cruise Information
Fixed Station Information
BODC Quality Flags
SeaDataNet Quality Flags
Metadata Summary
Data Description |
|||||||||||||||||||||||||||||||||||||||||||||||||||||||||||||||||||||||||||||
|
|||||||||||||||||||||||||||||||||||||||||||||||||||||||||||||||||||||||||||||
Data Identifiers |
|||||||||||||||||||||||||||||||||||||||||||||||||||||||||||||||||||||||||||||
|
|||||||||||||||||||||||||||||||||||||||||||||||||||||||||||||||||||||||||||||
Time Co-ordinates(UT) |
|||||||||||||||||||||||||||||||||||||||||||||||||||||||||||||||||||||||||||||
|
|||||||||||||||||||||||||||||||||||||||||||||||||||||||||||||||||||||||||||||
Spatial Co-ordinates | |||||||||||||||||||||||||||||||||||||||||||||||||||||||||||||||||||||||||||||
|
|||||||||||||||||||||||||||||||||||||||||||||||||||||||||||||||||||||||||||||
Parameters |
|||||||||||||||||||||||||||||||||||||||||||||||||||||||||||||||||||||||||||||
|
|||||||||||||||||||||||||||||||||||||||||||||||||||||||||||||||||||||||||||||
|
|||||||||||||||||||||||||||||||||||||||||||||||||||||||||||||||||||||||||||||
Problem Reports
The TIR1 Sensor (CSLRR101) was not working for the duration of the cruise. This is mentioned on page 106 of the cruise report.
PAR channels were offset by a significant margin. At its highest, the offset was greater than 13%. It is unclear as to which of the sensors are compromised as both sensors were calibrated a day apart 04/11/2015 (IRRDSV01) and 05/11/2015 (PARERXSD). Both calibrations are quite old and are reaching the point where they will require calibration again. Because of this, both sensors may have drifted over this time and therefore, both channels have been flagged entirely.
PAR channels were offset by a significant margin. At its highest, the offset was greater than 13%. It is unclear as to which of the sensors are compromised as both sensors were calibrated a day apart 04/11/2015 (IRRDSV01) and 05/11/2015 (PARERXSD). Both calibrations are quite old and are reaching the point where they will require calibration again. Because of this, both sensors may have drifted over this time and therefore, both channels have been flagged entirely.
JR16005 Meteorology Quality Control Report
Wind sensors
Screened relative Heading, wind direction, Air Temperature and true wind speed together.
There were some periods where spiking was observed as wind speed was seen to accelerate in tandem with the wind changing direction rapidly. In addition, wind shielding was observed at various points throughout the dataset. These occurrences were flagged accordingly.
Air Temperature, Relative Humidity and Atmospheric Pressure
The temperature, pressure and humidity channels are within their expected ranges and show great uniformity with their secondary channels. There are two drop-outs and these channels that were automatically flagged. There were was minimal spiking that was flagged in the pressure and humidity sensors.
Data Access Policy
Open Data
These data have no specific confidentiality restrictions for users. However, users must acknowledge data sources as it is not ethical to publish data without proper attribution. Any publication or other output resulting from usage of the data should include an acknowledgment.
If the Information Provider does not provide a specific attribution statement, or if you are using Information from several Information Providers and multiple attributions are not practical in your product or application, you may consider using the following:
"Contains public sector information licensed under the Open Government Licence v1.0."
Narrative Documents
RRS James Clark Ross cruise JR16005 underway document
Cruise details
| Dates | 17th March 2017 - 8th May 2017 (UTC) |
|---|---|
| Principal Scientific Officer | Prof. Alberto Naveira Garabato (British Antarctic Survey) |
Gill Windobserver 70 (ultrasonic) anemometer
A solid state, heated ultrasonic anemometer. Designed for use within the aviation industry and for more extreme weather conditions. It measures the times taken for an ultrasonic pulse of sound to travel from the North transducer to the South transducer, and compares it with the time for a pulse to travel from S to N transducer. Likewise times are compared between West and East, and E and W transducer. The wind speed and direction (and the speed of sound) can then be calculated from the differences in the times of flight on each axis. This calculation is independent of factors such as temperature. It uses 150 Watts of electrical heating in the anemometer head to prevent icing. Wind speed accuracy is +/-2% at 12 m/s. Wind direction accuracy is +/-2 degrees at 12 m/s.
For more information, please see this document: https://www.bodc.ac.uk/data/documents/nodb/pdf/Gill_WindObserver70_2017.pdf
JR16005 Meteorology Instrument Description Document
The meteorological suite of sensors is located in the foremast on the bow at 20-22 m height. The instruments used to collect this dataset are displayed in the table below.
| Manufacturer | Model | Main Function | Serial number | Calibration date | Comments |
| Kipp and Zonen (sensor 1) | SPLite 2 | Total Incident Radiation (TIR) | 161952 | 19/04/2016 | Manufacturer calibration applied |
| Kipp and Zonen (sensor 2) | SPLite 2 | Total Incident Radiation (TIR) | 161953 | 19/04/2016 | Manufacturer calibration applied |
| Kipp and Zonen (sensor 1) | Proto Quantum Spectra 1 (PQS1) | Photosynthetically Active Radiation (PAR) | 150813 | 04/11/2015 | Manufacturer calibration applied |
| Kipp and Zonen (sensor 2) | Proto Quantum Spectra 1 (PQS1) | Photosynthetically Active Radiation (PAR) | 150814 | 04/11/2015 | Manufacturer calibration applied |
| Rotronic (sensor 1) | MP402H-050300 | Air temperature and relative humidity | 0061606138 | 25/05/2016 | No calibration required |
| Rotronic (sensor 1) | HC2-S3 | Air temperature and relative humidity | 0020066609 | 16/11/2015 | No calibration required |
| Rotronic (sensor 2) | MP402H-050300 | Air temperature and relative humidity | 0061606317 | 25/05/2016 | No calibration required |
| Rotronic (sensor 2) | HC2-S3 | Air temperature and relative humidity | 0020066609 | 16/11/2015 | No calibration required |
| Vaisala | PTB210 Class B | Barometer Air pres | V1450003 | 10/04/2000 | No calibration required |
| Vaisala | PTB210 Class B | Barometer Air pres | V1450002 | 10/04/2000 | No calibration required |
| Windobserver | 70 | Anemometer | - | - | No calibration required |
Kipp & Zonen Photosynthetically Active Radiation Quantum Sensor PQS1
The PQS1 is an atmospheric radiometer designed to measure incident radiation at photosynthetically active radiation (PAR) wavelengths. It incorporates a diffuser with an excellent directional (cosine) response and a silicon photodiode detector.
If used in field research applications, the PQS1 can be connected with the METEON handheld display unit, which also as data-logging capability. For permanent installations, it can be connected to the LOGBOX SD data logger.
Specifications
| Spectral range | 400 to 700 nm (± 4 nm) |
| Sensitivity | 4 to 10 µV µmol-1 m-2 s-1 |
| Response time | < 1 µs |
| Non linearity | < 1% (0 to 10000 µV µmol-1 m-2 s-1) |
| Temperature dependence | < -0.1% °C-1 |
| Sensitivity change per year | < 2% |
| Directional error | < 3% (up to 80° zenith angle) |
| Field of view | 180° |
| Operating temperature | -30 to 70°C |
| Relative humidity | 0 to 100 % RH |
A link to the PQS1 specification sheet can be found here: PQS1 Spec sheet
Kipp and Zonen SP Lite and SP Lite2 Silicon Pyranometer
An atmospheric pyranometer that measures solar radiation over the range 400-1100 nm by means of a silicon photo-diode detector mounted in a diffuser. The sensor measures the radiation received over the entire hemisphere and the diffuser's sensitivity is proportional to the cosine of the angle of incidence of the incoming radiation. The photodiode creates a voltage output that is proportional to the incoming radiation. The SP Lite2 supersedes the SP Lite and features an improved sensitivity and faster response time than its predecessor.
Specifications
| Specification | SP Lite | SP Lite2 |
|---|---|---|
| Spectral range | 400-1100 nm | 400-1100 nm |
| Sensitivity | 100 µV W-1 m-2 | 60 to 100 µV W-1 m-2 |
| Response time | < 1 s | < 500 ns |
| Maximum irradiance | 2000 W m-2 | 2000 W m-2 |
| Operating temperature | -30 to 70°C | -30 to 70°C |
| Temperature dependence | 0.15% °C-1 | 0.15% °C-1 |
Further details can be found in the manufacturer's specification sheets for the SP Lite and SP Lite2.
Rotronic Hygromet MP102H and MP402H temperature and humidity probes
This meteorological probe measures humidity and temperature with the plug-in HygroClip HC2-S3 sensor module, and can also be equipped with a signal conditioned Pt100 temperature probe.
The two models differ in that the MP102H produces a voltage output while the MP402H produces a current output. Other characteristics are common to both models.
The specification sheet can be accessed here Rotronic MP102H and MP402H.
Specifications
| Start up time | 3 s (typical) |
| Data refresh time | 1 s (typical) |
| Humidity range | 0 to 100% RH |
| Humidity accuracy | 0.8% RH |
| Temperature range | -40 to 80°C |
| Temperature accuracy | 0.1°C |
| Maximum air velocity ar probe | 20 m s-1 |
| User configurable limits | -999 to 9999 engineering units |
| HC2-S3 Probe material | Polycarbonate |
| Probe dust filter | Polyethylene |
Vaisala PTB210 Digital Barometer
The basic specifications for this pressure sensor are as follows:
- Manufacturer: Vaisala
- Type: Silicon capacitive sensor
- Model: PTB210
- Range: 900 - 1100 hPa
- Output: 0-5VDC
- Total Accuracy (20°C): ±0.30hPa
- Operating temperature: -40 to +60 deg C
- Weight: 110g
- Certification Ingress Protection: IP65
Further details can be found in the manufacturer's specification sheet.
JR16005 Meteorology Processing Procedures Document
Originator's Data Processing
Meterological data were measured from instruments located on the RRS James Clark Ross meterological mast. The data streams were logged every second to the SCS system and merged into comma separated file formats (.ACO). The instruments logged the meterological data to the oceanlogger and anemometer ACO files and the header information was stored in the corresponding .TPL files.
The originator compiled the .ACO files into a MATLAB structure array for further processing. The meteorological data is included in the originator's .MAT file. The .MAT file was provided to BODC and used for BODC processing.
The start and end times of the meterological files are shown in the table below.
| Filename | Content Discription | Format | Interval | Start date | Start Time | End date | End Time |
| underway_data.mat |
| .MAT | 4-6 sec | 18/03/2017 | 00:00:05 | 29/04/2017 | 23:59:55 |
BODC Data Processing
The files were reformatted to BODC internal format using standard data banking procedures. All files were averaged to 60 second intervals. The following table shows how the variables within the files were mapped to appropriate BODC parameter codes.
| Originator's File | Originator's Parameter | Originator's Units | Description | BODC parameter | BODC Units | Comments and unit conversions |
| underway_data.mat | baro1 | hPa | Pressure (measured variable) exerted by the atmosphere by barometer and expressed at measurement altitude | CAPHTU01 | mbar | Units are equivalent |
| underway_data.mat | baro2 | hPa | Pressure (measured variable second sensor) exerted by the atmosphere by barometer and expressed at measurement altitude | CAPHTU02 | mbar | Units are equivalent |
| underway_data.mat | airtemp1 | °C | Temperature (second sensor) of the atmosphere by dry bulb thermometer | CDTAZZ01 | °C | - |
| underway_data.mat | airtemp2 | °C | Temperature (second sensor) of the atmosphere by dry bulb thermometer | CDTAZZ02 | °C | - |
| underway_data.mat | humidity1 | % | Relative humidity (second sensor) of the atmosphere | CRELZZ01 | % | - |
| underway_data.mat | humidity2 | % | Relative humidity (second sensor) of the atmosphere | CRELZZ02 | % | - |
| underway_data.mat | par1 | µmol m-2 s-1 | Downwelling vector irradiance as photons (PAR wavelengths) in the atmosphere by cosine-collector radiometer | IRRDSV01 | µE m-2 s-1 | Dropped after transfer due to poor quality |
| underway_data.mat | par2 | µmol m-2 s-1 | Downwelling vector irradiance as photons (PAR wavelengths) in the atmosphere by cosine-collector radiometer | PARERXSD | µE m-2 s-1 | Dropped after transfer due to poor quality |
| underway_data.mat | tir1 | W m-2 | Downwelling vector irradiance as energy (solar (300-3000 nm) wavelengths) in the atmosphere by pyranometer | CSLRR101 | W m-2 | Dropped after transfer due to poor quality. |
| underway_data.mat | tir2 | W m-2 | Downwelling vector irradiance as energy (solar (300-3000 nm) wavelengths) in the atmosphere by pyranometer | CSLRR102 | W m-2 | - |
| anemometer.ACO | wind_dir | Degrees | Wind direction (relative to moving platform) in the atmosphere by in-situ anemometer | ERWDSS01 | Degrees | Omitted from originator's .MAT file. Added from .ACO file. |
| anemometer.ACO | wind_speed | m s-1 | Wind speed (relative to moving platform) in the atmosphere by in-situ anemometer | ERWSSS01 | m s-1 | Omitted from originator's .MAT file. Added from .ACO file. |
| - | - | - | Wind speed in the atmosphere by in-situ anemometer | EWSBSS01 | m s-1 | Channel derived using BODC Matlab routine 'wincor' |
| - | - | - | Wind direction in the atmosphere by in-situ anemometer | EWDASS01 | Degrees true | Channel derived using BODC Matlab routine 'wincor' |
Wind sensors
The BODC Matlab procedure 'wincor' was run using the relative wind speed and direction and ship's north-south and east-west velocities, with the vane set to 0 degrees at the bow. This program generated the absolute wind speed and direction.
Calibrations
No calibrations were applied to the meteorological data.
Project Information
Dynamics of Orkney Passage Outflow (DynOPO)
DynOPO is a five year research project that aims to understand how Antarctic Bottom Water is exported and modified through the Orkney Passage, the overflow's controlling dynamics, and its downstream impact on the Atlantic Ocean abyss.
Introduction
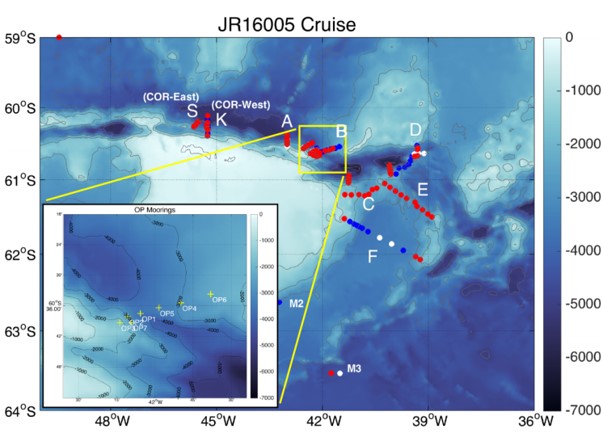
Mooring data collected for the DynOPO project are a component of a long term time series, in association with the Ocean Regulation of Climate by Heat and Carbon Sequestration and Transports (ORCHESTRA) project, led by Emily Shuckburgh (British Antarctic Survey) since 2016. The time series originally started out as part of the British Antarctic Survey's Long-Term Monitoring and Survey (LTMS) programme. Moorings were deployed on RRS James Clark Ross cruise JR20150309 (JR310 and JR272D) which ran from 09 March to 14 April 2015. RRS James Clark Ross cruise JR16005 ran from 17 March to 08 May 2017 and was the primary fieldwork element of the DynOPO project. The cruise had two main goals: (1) to conduct measurements of the hydrographic properties, velocity and turbulent processes of the Antarctic Bottom Water outflow along its pathway through the Orkney Passage region; and (2) to turn around a set of long-term moorings deployed in the area by British Antarctic Survey (BAS) and Lamont-Doherty Earth Observatory (LDEO) scientists, including recovery of additional instruments on some of the moorings deployed by JR20150309.
Project Collaborators
The project was led by the University of Southampton, and is an international collaboration with;
- UK: British Antarctic Survey (BAS), UK Meteorological Office, University of East Anglia and Newcastle University;
- Europe: University of Gothenburg (Sweden), University of Paris 6 (France);
- Australia: University of Tasmania;
- US: Lamont Doherty Earth Observatory, Woods Hole Oceanographic Institute, NOAA, University of California, Washington State University and Princeton University
Funding
The project was funded by the Natural Environment Research Council and ran from March 2015 to November 2018.
Data Activity or Cruise Information
Cruise
| Cruise Name | JR16005 |
| Departure Date | 2017-03-17 |
| Arrival Date | 2017-05-08 |
| Principal Scientist(s) | Alberto C Naveira Garabato (University of Southampton School of Ocean and Earth Science), Povl Abrahamsen (British Antarctic Survey) |
| Ship | RRS James Clark Ross |
Complete Cruise Metadata Report is available here
Fixed Station Information
No Fixed Station Information held for the Series
BODC Quality Control Flags
The following single character qualifying flags may be associated with one or more individual parameters with a data cycle:
| Flag | Description |
|---|---|
| Blank | Unqualified |
| < | Below detection limit |
| > | In excess of quoted value |
| A | Taxonomic flag for affinis (aff.) |
| B | Beginning of CTD Down/Up Cast |
| C | Taxonomic flag for confer (cf.) |
| D | Thermometric depth |
| E | End of CTD Down/Up Cast |
| G | Non-taxonomic biological characteristic uncertainty |
| H | Extrapolated value |
| I | Taxonomic flag for single species (sp.) |
| K | Improbable value - unknown quality control source |
| L | Improbable value - originator's quality control |
| M | Improbable value - BODC quality control |
| N | Null value |
| O | Improbable value - user quality control |
| P | Trace/calm |
| Q | Indeterminate |
| R | Replacement value |
| S | Estimated value |
| T | Interpolated value |
| U | Uncalibrated |
| W | Control value |
| X | Excessive difference |
SeaDataNet Quality Control Flags
The following single character qualifying flags may be associated with one or more individual parameters with a data cycle:
| Flag | Description |
|---|---|
| 0 | no quality control |
| 1 | good value |
| 2 | probably good value |
| 3 | probably bad value |
| 4 | bad value |
| 5 | changed value |
| 6 | value below detection |
| 7 | value in excess |
| 8 | interpolated value |
| 9 | missing value |
| A | value phenomenon uncertain |
| B | nominal value |
| Q | value below limit of quantification |
