Metadata Report for BODC Series Reference Number 2014605
Metadata Summary
Problem Reports
Data Access Policy
Narrative Documents
Project Information
Data Activity or Cruise Information
Fixed Station Information
BODC Quality Flags
SeaDataNet Quality Flags
Metadata Summary
Data Description |
|||||||||||||||||||||||||||||||||||||||||||||||||||||||||||||||||||||
|
|||||||||||||||||||||||||||||||||||||||||||||||||||||||||||||||||||||
Data Identifiers |
|||||||||||||||||||||||||||||||||||||||||||||||||||||||||||||||||||||
|
|||||||||||||||||||||||||||||||||||||||||||||||||||||||||||||||||||||
Time Co-ordinates(UT) |
|||||||||||||||||||||||||||||||||||||||||||||||||||||||||||||||||||||
|
|||||||||||||||||||||||||||||||||||||||||||||||||||||||||||||||||||||
Spatial Co-ordinates | |||||||||||||||||||||||||||||||||||||||||||||||||||||||||||||||||||||
|
|||||||||||||||||||||||||||||||||||||||||||||||||||||||||||||||||||||
Parameters |
|||||||||||||||||||||||||||||||||||||||||||||||||||||||||||||||||||||
|
|||||||||||||||||||||||||||||||||||||||||||||||||||||||||||||||||||||
|
|||||||||||||||||||||||||||||||||||||||||||||||||||||||||||||||||||||
Problem Reports
No Problem Report Found in the Database
Data Access Policy
Open Data
These data have no specific confidentiality restrictions for users. However, users must acknowledge data sources as it is not ethical to publish data without proper attribution. Any publication or other output resulting from usage of the data should include an acknowledgment.
If the Information Provider does not provide a specific attribution statement, or if you are using Information from several Information Providers and multiple attributions are not practical in your product or application, you may consider using the following:
"Contains public sector information licensed under the Open Government Licence v1.0."
Narrative Documents
SeaBird Digital Oceanographic Thermometer SBE38
The SBE38 is an ultra-stable thermistor that can be integrated as a remote temperature sensor with an SBE21 Thermosalinograph or an SBE 45 Micro TSG, or as a secondary temperature sensor with an SBE 16 plus, 16plus-IM, 16plus V2, 16plus-IM V2 or 19plus V2 SEACAT CTD.
Temperature is determined by applying an AC excitation to reference resistances and an ultra-stable aged thermistor. The reference resistor is a hermetically sealed VISHAY. AC excitation and ratiometric comparison using a common processing channel removes measurement errors due to parasitic thermocouples, offset voltages, leakage currents and gain errors.
The SBE38 can operate in polled sampling, where it takes one sample and transmits the data, or in continuous sampling.
Specifications
| Depth rating | up to 10500 m |
| Temperature range | -5 to 35°C |
| Initial accuracy | ± 0.001°C |
| Resolution | 0.00025°C |
| Stability | 0.001°C in 6 months |
| Response time | 500 ms |
| Self-heating error | < 200 µK |
Further details can be found in the manufacturer's specification sheet.
WET Labs WETStar Fluorometers
WET Labs WETStar fluorometers are miniature flow-through fluorometers, designed to measure relative concentrations of chlorophyll, CDOM, uranine, rhodamineWT dye, or phycoerythrin pigment in a sample of water. The sample is pumped through a quartz tube, and excited by a light source tuned to the fluorescence characteristics of the object substance. A photodiode detector measures the portion of the excitation energy that is emitted as fluorescence.
Specifications
By model:
| Chlorophyll WETStar | CDOM WETStar | Uranine WETStar | Rhodamine WETStar | Phycoerythrin WETStar | |
|---|---|---|---|---|---|
| Excitation wavelength | 460 nm | 370 nm | 485 nm | 470 nm | 525 nm |
| Emission wavelength | 695 nm | 460 nm | 530 nm | 590 nm | 575 nm |
| Sensitivity | 0.03 µg l-1 | 0.100 ppb QSD | 1 µg l-1 | - | - |
| Range | 0.03-75 µg l-1 | 0-100 ppb; 0-250 ppb | 0-4000 µg l-1 | - | - |
All models:
| Temperature range | 0-30°C |
|---|---|
| Depth rating | 600 m |
| Response time | 0.17 s analogue; 0.125 s digital |
| Output | 0-5 VDC analogue; 0-4095 counts digital |
Further details can be found in the manufacturer's specification sheet, and in the instrument manual.
WETLabs C-Star transmissometer
This instrument is designed to measure beam transmittance by submersion or with an optional flow tube for pumped applications. It can be used in profiles, moorings or as part of an underway system.
Two models are available, a 25 cm pathlength, which can be built in aluminum or co-polymer, and a 10 cm pathlength with a plastic housing. Both have an analog output, but a digital model is also available.
This instrument has been updated to provide a high resolution RS232 data output, while maintaining the same design and characteristics.
Specifications
| Pathlength | 10 or 25 cm |
| Wavelength | 370, 470, 530 or 660 nm |
| Bandwidth | ~ 20 nm for wavelengths of 470, 530 and 660 nm ~ 10 to 12 nm for a wavelength of 370 nm |
| Temperature error | 0.02 % full scale °C-1 |
| Temperature range | 0 to 30°C |
| Rated depth | 600 m (plastic housing) 6000 m (aluminum housing) |
Further details are available in the manufacturer's specification sheet or user guide.
RRS James Clark Ross Cruise JR18007 Surface Hydrography Instrument Description Document
The sea surface hydrographical suite of sensors was fed by the pumped-seawater, non-toxic supply. The seawater intake was located at 6.5 m below the sea surface. The following surface hydrology sensors were fitted:
| Manufacturer | Model | Main Function | Serial number | Last calibration date | Comments |
| Sea Bird Electronics | SBE45 | Thermosalinograph | 4524698-0018 | Unknown | No manufacturer calibration applied |
| Sea Bird Electronics | SBE38 | Sea surface temperature (sensor 1) | 0765 | Unknown | No manufacturer calibration applied |
| Sea Bird Electronics | SBE38 | Sea surface temperature (sensor 2) | 0771 | Unknown | No manufacturer calibration applied |
| WET Labs | WSCHL Wetstar fluorometer | Chlorophyll fluorescence | 1498 | Unknown | No manufacturer calibration applied |
| Wet Labs | C-Star | Transmissometer | 1497DR | Unknown | No manufacturer calibration applied |
| Litremeter | F112-PHC-AP-OR-PP | Flow meter | 05/811950 | Unknown | No manufacturer calibration applied |
SeaBird MicroTSG Thermosalinograph SBE 45
The SBE45 MicroTSG is an externally powered instrument designed for shipboard measurement of temperature and conductivity of pumped near-surface water samples. The instrument can also compute salinity and sound velocity internally.
The MicroTSG comprises a platinum-electrode glass conductivity cell and a stable, pressure-protected thermistor temperature sensor. It also contains an RS-232 port for appending the output of a remote temperature sensor, allowing for direct measurement of sea surface temperature.
The instrument can operate in Polled, Autonomous and Serial Line Sync sampling modes:
- Polled sampling: the instrument takes one sample on command
- Autonomous sampling: the instrument samples at preprogrammed intervals and does not enter quiescence (sleep) state between samples
- Serial Line Sync: a pulse on the serial line causes the instrument to wake up, sample and re-enter quiescent state automatically
Specifications
| Conductivity | Temperature | Salinity | |
|---|---|---|---|
| Range | 0 to 7 Sm-1 | -5 to 35°C | |
| Initial accuracy | 0.0003 Sm-1 | 0.002°C | 0.005 (typical) |
| Resolution | 0.00001 Sm-1 | 0.0001°C | 0.0002 (typical) |
| Typical stability (per month) | 0.0003 Sm-1 | 0.0002°C | 0.003 (typical) |
Further details can be found in the manufacturer's specification sheet.
RRS James Clark Ross Cruise JR18007 Sea Surface Hydrography Data Quality Document
Non-toxic seawater supply
The non-toxic seawater supply was turned off on several occasions throughout JR18007 as indicated by the flow channel (INFLTF01), potentially due to sea ice. All data during periods when the non-toxic supply was flagged accordingly, in addition to instrument specific settling periods.
FluorometryAt the start of the cruise the fluorometer outputted some stuck values, possibly due to the presence of air bubbles in the system. Data during this period (22:45 on 06/08/2019 until 19:58 on 07/08/2019) were flagged accordingly.
TransmissivityA marked drop in transmissivity occurs between 14:35 on 07/08/2019 and approximately 12:55 on 08/08/2019, potentially due to the presence of air bubbles in the system. Data during this period were flagged accordingly.
RRS James Clark Ross cruise JR18007 surface hydrography data processing procedures
Originator's Data Processing
The sea surface hydrography measurements were performed by a Sea-Bird SBE 45 thermosalinograph, Wetlabs Cstar transmissometer, Sea-Bird SBE 38 temperature sensor, and Wetlabs WSCHL-1498 Wetstar fluorometer in the ship's flow through system, and by a Sea-Bird SBE 38 temperature sensor located near the flow through intake, at the hull. The data streams were logged every second to the SCS system and merged into a comma separated file format, and logged to the oceanlogger.ACO file. The header information was stored in the associated .TPL files.
File delivered to BODC
| Filename | Content description | Format | Interval | Start date/time (UTC) | End date/time (UTC) | Comments |
| oceanlogger.ACO | Conductivity, salinity, temperature, chlorophyll, transmissivity | SCS | 5 Hz | 2019/08/05 07:19:14 | 2019/08/29 12:09:50 | - |
BODC Data Processing
The files were reformatted to BODC internal format using standard banking procedures. Data were averaged to 60 second intervals. The following table shows how the variables within the file were mapped to appropriate BODC parameter codes:
oceanlogger.ACO
| Originator's variables | Originator's units | Description | BODC code | BODC unit | Conversion | Comments |
| chlorophyll | ug/l | Chlorophyll fluorescence | CPHLUMTF | mg/m3 | Units equivalent | - |
| flowrate | l/min | Non-toxic flow rate | INFLTF01 | l/min | - | Used for screening at BODC only |
| salinity | psu | Practical salinity (TSG) | PSALSU01 | psu | - | - |
| tstemp | °C | Housing temperature (TSG) | TMESSG01 | °C | - | - |
| sstemp | °C | Sea surface temperature (hull sensor) | TEMPHU01 | °C | - | - |
| sstemp2 | °C | Sea surface temperature (second sensor) | TEMPSU01 | °C | - | - |
| trans | 0<tr<1 | Beam transmittance | POPTDR01 | % | *100 | - |
| conductivity | s/m | Conductivity (TSG) | CNDCSG01 | s/m | - | - |
Manufacturer's Calibrations
Transmissometer
Beam transmission (trans) was used to calculate beam attenuation (atten) as follows:
atten [per m] = (-4 * ln(trans * 0.01)
Processing
ScreeningAll the reformatted data were visualised using the in-house EDSERPLO software. Suspect data were marked by adding an appropriate quality control flag.
Field Calibrations
Salinity
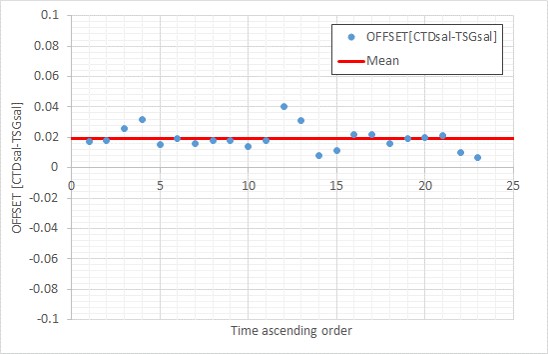
Salinity was calibrated against calibrated CTD casts (https://www.bodc.ac.uk/data/documents/nodb/565358/). CTD salinities (48 casts where salinity was averaged from readings between 0-6m depth) and corresponding underway data values (1 min averaged) were extracted using standard BODC procedures and the offset between them calculated (CTDsal - TSGsal). Samples where the CTD salinity measurements were considered highly variable (> 1 SD) over 6 m were removed. Due to the high variability in the offset, outliers considered to be more than one standard deviation of the resulting dataset were also removed. The remaining 23 samples were used in the calculation of the calibration. No trends with time or CTD salinity were found, therefore underway salinity was calibrated with a mean offset as follows:
new_salinity (PSU) = old_salinity (PSU) + 0.0190 (±0.0078 S.D., n = 23, P < 0.005)
Where 'new_salinity' is the calibrated salinity, 'old_salinity' is the thermosalinograph salinity.
Sea surface temperature (sensor 1)
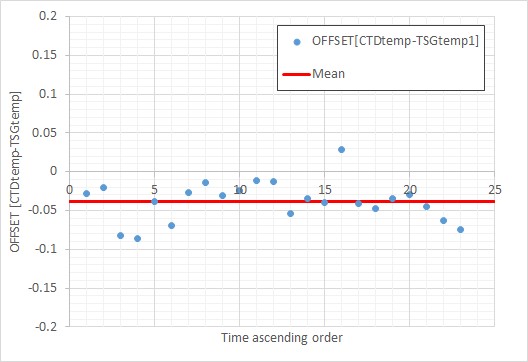
Sea surface temperature from sensor 1 was calibrated against calibrated CTD casts (https://www.bodc.ac.uk/data/documents/nodb/565358/). CTD temperature (48 casts where temperature was averaged from readings between 0-6m depth) and corresponding underway data values (1 min averaged) were extracted using standard BODC procedures and the offset between them calculated (CTDtemp- TSGtemp1). Samples where the CTD temperature measurements were considered highly variable (> 1 SD) over 6 m were removed. Due to the high variability in the offset, outliers considered to be more than one standard deviation of the resulting dataset were also removed. A further two samples considered to be suspect were removed until the variance in the dataset was considered small. The remaining 23 samples were used in the calculation of the calibration. No trends with time or CTD temperature were found, therefore underway temperature was calibrated with a mean offset as follows:
new_temp (° C) = old_temp (°C) - 0.038 (±0.026 S.D., n = 23, P < 0.05)
Where 'new_temp' is the calibrated temperature sensor 1, 'old_temp' is the thermosalinograph temperature.
Sea surface temperature (sensor 2)
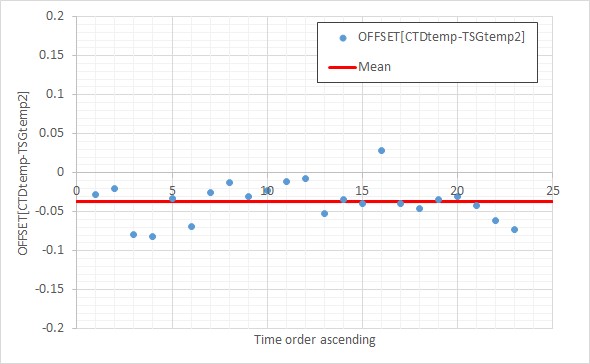
Sea surface temperature from sensor 2 was calibrated against calibrated CTD casts (https://www.bodc.ac.uk/data/documents/nodb/565358/). CTD temperature (48 casts where temperature was averaged from readings between 0-6m depth) and corresponding underway data values (1 min averaged) were extracted using standard BODC procedures and the offset between them calculated (CTDtemp- TSGtemp2). Samples where the CTD temperature measurements were considered highly variable (> 1 SD) over 6 m were removed. Due to the high variability in the offset, outliers considered to be more than one standard deviation of the resulting dataset were also removed. A further two samples considered to be suspect were removed until the variance in the dataset was considered small. The remaining 23 samples were used in the calculation of the calibration. No trends with time or CTD temperature were found, therefore underway temperature was calibrated with a mean offset as follows:
new_temp (° C) = old_temp (°C) - 0.037 (±0.025 S.D., n = 23, P < 0.05)
Where 'new_temp' is the calibrated temperature sensor 2, 'old_temp' is the thermosalinograph temperature.
Project Information
Changing Arctic Ocean: Implications for marine biology and biogeochemistry
Changing Arctic Ocean (CAO) is a £16 million, five year (2017-2022) research programme initially funded by the Natural Environment Research Council (NERC). The aim of the CAO programme is to understand how change in the physical environment (ice and ocean) will affect the large-scale ecosystem structure and biogeochemical functioning of the Arctic Ocean, the potential major impacts and provide projections for future ecosystem services. In July 2018, additional projects were added to the programme that were jointly funded by NERC and the German Federal Ministry of Education and Research.
Background
The Arctic Ocean is responding to global climate change in ways that are not yet fully understood and in some cases, not yet identified. The impacts of change in the Arctic are global in range and international in importance. To achieve the aim, the programme has two key research challenges:
- To develop quantified understanding of the structure and functioning of Arctic ecosystems.
- To understand the sensitivity of Arctic ecosystem structure, functioning and services to multiple stressors and the development of projections of the impacts of change.
The decision to fund the CAO project was both scientific and political and is the second largest research programme funded by NERC.
The programme involves 33 organisations, the majority of which are research institutions in the UK and Germany, and over 170 scientists. The programme consists of four large projects with an additional 12 research projects added in July 2018.
Further information can be found on the Changing Arctic Ocean website.
Participants
There are 33 organisations involved in the Changing Arctic Ocean project, these are:
- Alfred Wegener Institut (AWI)
- Bangor University
- British Antarctic Survey (BAS)
- Centre for Environment, Fisheries and Aquaculture Science (CEFAS)
- Durham University
- GEOMAR
- Helmholtz-Zentrum Geesthacht Centre for Materials and Coastal Research
- Lancaster University
- Marine Biological Association (MBA)
- Max Planck Institute for the Science of Human History
- National Oceanography Centre (NOC)
- Newcastle University
- Northumbria University
- Ocean Atmosphere Systems GmbH
- Plymouth Marine Laboratory (PML)
- Scottish Association for Marine Science (SAMS)
- Scottish Universities Environmental Research Centre (SUERC)
- Université Libre de Bruxelles
- University College London (UCL)
- University of Bristol
- University of East Anglia (UEA)
- University of Edinburgh
- University of Glasgow
- University of Huddersfield
- University of Leeds
- University of Liverpool
- University of Manchester
- University of Oldenburg
- University of Oxford
- University of Southampton
- University of St Andrews
- University of Stirling
- University of Strathclyde
In addition to the core organisation, there are a number of international collaborators.
Research Details
The four large projects funded by NERC are:
- Arctic Productivity in the seasonal Ice Zone (Arctic PRIZE)
- Can we detect changes in Arctic ecosystems? (ARISE)
- The Changing Arctic Ocean Seafloor (ChAOS) - How changing sea ice conditions impact biological communities, biogeochemical processes and ecosystems
- Mechanistic understanding of the role of diatoms in the success of the Arctic Calanus complex and implications for a warmer Arctic (DIAPOD)
The additional 12 projects added in July 2018 funded jointly by NERC and the German Federal Ministry of Education and Research are:
- Advective Pathways of nutrients and key Ecological substances in the Arctic (APEAR)
- How will changing freshwater export and terrestrial permafrost thaw influence the Arctic Ocean? (CACOON)
- Chronobiology of changing Arctic Sea Ecosystems (CHASE)
- Potential benefits and risks of borealisation for fish stocks and ecosystems in a changing Arctic Ocean (Coldfish)
- Diatom Autecological Responses with Changes To Ice Cover (Diatom-ARCTIC)
- Ecosystem functions controlled by sea ice and light in a changing Arctic (Eco-Light)
- Effects of ice stressors and pollutants on the Arctic marine cryosphere (EISPAC)
- Linking Oceanography and Multi-specific, spatially-Variable Interactions of seabirds and their prey in the Arctic (LOMVIA)
- Understanding the links between pelagic microbial ecosystems and organic matter cycling in the changing Arctic (Micro-ARC)
- Microbes to Megafauna Modelling of Arctic Seas (MiMeMo)
- Primary productivity driven by escalating Arctic nutrient fluxes? (PEANUTS)
- Pathways and emissions of climate-relevant trace gases in a changing Arctic Ocean (PETRA)
Fieldwork and Data Collection
The programme consists of seven core cruises that survey areas in the Barents Sea and the Fram Strait on board the NERC research vessel RRS James Clark Ross. Measurements will include temperature, salinity, dissolved oxygen, dissolved inorganic carbon, total alkalinity, inorganic nutrients, oxygen and carbon isotopes and underway meteorological and surface ocean observations. In addition to ship based cruise datasets gliders, moorings and animal tags are part of the fieldwork. Further data are collected from model runs.
Data Activity or Cruise Information
Cruise
| Cruise Name | JR18007 |
| Departure Date | 2019-08-04 |
| Arrival Date | 2019-09-06 |
| Principal Scientist(s) | David Pond (University of Stirling, Institute of Aquaculture) |
| Ship | RRS James Clark Ross |
Complete Cruise Metadata Report is available here
Fixed Station Information
No Fixed Station Information held for the Series
BODC Quality Control Flags
The following single character qualifying flags may be associated with one or more individual parameters with a data cycle:
| Flag | Description |
|---|---|
| Blank | Unqualified |
| < | Below detection limit |
| > | In excess of quoted value |
| A | Taxonomic flag for affinis (aff.) |
| B | Beginning of CTD Down/Up Cast |
| C | Taxonomic flag for confer (cf.) |
| D | Thermometric depth |
| E | End of CTD Down/Up Cast |
| G | Non-taxonomic biological characteristic uncertainty |
| H | Extrapolated value |
| I | Taxonomic flag for single species (sp.) |
| K | Improbable value - unknown quality control source |
| L | Improbable value - originator's quality control |
| M | Improbable value - BODC quality control |
| N | Null value |
| O | Improbable value - user quality control |
| P | Trace/calm |
| Q | Indeterminate |
| R | Replacement value |
| S | Estimated value |
| T | Interpolated value |
| U | Uncalibrated |
| W | Control value |
| X | Excessive difference |
SeaDataNet Quality Control Flags
The following single character qualifying flags may be associated with one or more individual parameters with a data cycle:
| Flag | Description |
|---|---|
| 0 | no quality control |
| 1 | good value |
| 2 | probably good value |
| 3 | probably bad value |
| 4 | bad value |
| 5 | changed value |
| 6 | value below detection |
| 7 | value in excess |
| 8 | interpolated value |
| 9 | missing value |
| A | value phenomenon uncertain |
| B | nominal value |
| Q | value below limit of quantification |
