Metadata Report for BODC Series Reference Number 2023043
Metadata Summary
Problem Reports
Data Access Policy
Narrative Documents
Project Information
Data Activity or Cruise Information
Fixed Station Information
BODC Quality Flags
SeaDataNet Quality Flags
Metadata Summary
Data Description |
|||||||||||||||||||||||||||||||||||||||||||||||||||||||||||||||||||||||||
|
|||||||||||||||||||||||||||||||||||||||||||||||||||||||||||||||||||||||||
Data Identifiers |
|||||||||||||||||||||||||||||||||||||||||||||||||||||||||||||||||||||||||
|
|||||||||||||||||||||||||||||||||||||||||||||||||||||||||||||||||||||||||
Time Co-ordinates(UT) |
|||||||||||||||||||||||||||||||||||||||||||||||||||||||||||||||||||||||||
|
|||||||||||||||||||||||||||||||||||||||||||||||||||||||||||||||||||||||||
Spatial Co-ordinates | |||||||||||||||||||||||||||||||||||||||||||||||||||||||||||||||||||||||||
|
|||||||||||||||||||||||||||||||||||||||||||||||||||||||||||||||||||||||||
Parameters |
|||||||||||||||||||||||||||||||||||||||||||||||||||||||||||||||||||||||||
|
|||||||||||||||||||||||||||||||||||||||||||||||||||||||||||||||||||||||||
|
|||||||||||||||||||||||||||||||||||||||||||||||||||||||||||||||||||||||||
Problem Reports
No Problem Report Found in the Database
RRS Discovery Surface Hydrography Quality Control Report
Sea Surface Temperature
The remote underway sea surface temperature data readings have been found to display a consistent variable offset when compared to CTD temperature readings at the same depth. As this is a general occurance, the remote underway temperature data should be used with caution if they have not been calibrated against in situ CTD temperature values.
RRS Discovery cruise DY112 surface hydrography quality control report
Conductivity
Non-toxic flow minimal until 18/01/2020 ~1700. (BODC assessment)
Salinity
Non-toxic flow minimal until 18/01/2020 ~1700. (BODC assessment)
The salinity calibration obtained post-station (from 22/01/2020 00:00:00) was calculated with only two sample points. Users should use the calibration with caution.
Housing temperature
Non-toxic flow minimal until 18/01/2020 ~1700. (BODC assessment)
Remote temperature
Non-toxic flow minimal until 18/01/2020 ~1700. Half degree increases in SST were observed on 20/01/2020 ~12000. It was unclear if these were valid and thus not flagged as bad. (BODC assessment)
The sea surface temprature calibration applied was obtained from the previous cruise where high bias was observed. Users should use the calibration with caution.
Fluorometer
Non-toxic flow minimal until 18/01/2020 ~1700. (BODC assessment)
Transmissometer
Non-toxic flow minimal until 18/01/2020 ~1700.
Readings affected by bubbles until 19/01/2020 ~2330. (BODC assessment)
Data Access Policy
Open Data
These data have no specific confidentiality restrictions for users. However, users must acknowledge data sources as it is not ethical to publish data without proper attribution. Any publication or other output resulting from usage of the data should include an acknowledgment.
If the Information Provider does not provide a specific attribution statement, or if you are using Information from several Information Providers and multiple attributions are not practical in your product or application, you may consider using the following:
"Contains public sector information licensed under the Open Government Licence v1.0."
Narrative Documents
SeaBird Digital Oceanographic Thermometer SBE38
The SBE38 is an ultra-stable thermistor that can be integrated as a remote temperature sensor with an SBE21 Thermosalinograph or an SBE 45 Micro TSG, or as a secondary temperature sensor with an SBE 16 plus, 16plus-IM, 16plus V2, 16plus-IM V2 or 19plus V2 SEACAT CTD.
Temperature is determined by applying an AC excitation to reference resistances and an ultra-stable aged thermistor. The reference resistor is a hermetically sealed VISHAY. AC excitation and ratiometric comparison using a common processing channel removes measurement errors due to parasitic thermocouples, offset voltages, leakage currents and gain errors.
The SBE38 can operate in polled sampling, where it takes one sample and transmits the data, or in continuous sampling.
Specifications
| Depth rating | up to 10500 m |
| Temperature range | -5 to 35°C |
| Initial accuracy | ± 0.001°C |
| Resolution | 0.00025°C |
| Stability | 0.001°C in 6 months |
| Response time | 500 ms |
| Self-heating error | < 200 µK |
Further details can be found in the manufacturer's specification sheet.
WET Labs WETStar Fluorometers
WET Labs WETStar fluorometers are miniature flow-through fluorometers, designed to measure relative concentrations of chlorophyll, CDOM, uranine, rhodamineWT dye, or phycoerythrin pigment in a sample of water. The sample is pumped through a quartz tube, and excited by a light source tuned to the fluorescence characteristics of the object substance. A photodiode detector measures the portion of the excitation energy that is emitted as fluorescence.
Specifications
By model:
| Chlorophyll WETStar | CDOM WETStar | Uranine WETStar | Rhodamine WETStar | Phycoerythrin WETStar | |
|---|---|---|---|---|---|
| Excitation wavelength | 460 nm | 370 nm | 485 nm | 470 nm | 525 nm |
| Emission wavelength | 695 nm | 460 nm | 530 nm | 590 nm | 575 nm |
| Sensitivity | 0.03 µg l-1 | 0.100 ppb QSD | 1 µg l-1 | - | - |
| Range | 0.03-75 µg l-1 | 0-100 ppb; 0-250 ppb | 0-4000 µg l-1 | - | - |
All models:
| Temperature range | 0-30°C |
|---|---|
| Depth rating | 600 m |
| Response time | 0.17 s analogue; 0.125 s digital |
| Output | 0-5 VDC analogue; 0-4095 counts digital |
Further details can be found in the manufacturer's specification sheet, and in the instrument manual.
WETLabs C-Star transmissometer
This instrument is designed to measure beam transmittance by submersion or with an optional flow tube for pumped applications. It can be used in profiles, moorings or as part of an underway system.
Two models are available, a 25 cm pathlength, which can be built in aluminum or co-polymer, and a 10 cm pathlength with a plastic housing. Both have an analog output, but a digital model is also available.
This instrument has been updated to provide a high resolution RS232 data output, while maintaining the same design and characteristics.
Specifications
| Pathlength | 10 or 25 cm |
| Wavelength | 370, 470, 530 or 660 nm |
| Bandwidth | ~ 20 nm for wavelengths of 470, 530 and 660 nm ~ 10 to 12 nm for a wavelength of 370 nm |
| Temperature error | 0.02 % full scale °C-1 |
| Temperature range | 0 to 30°C |
| Rated depth | 600 m (plastic housing) 6000 m (aluminum housing) |
Further details are available in the manufacturer's specification sheet or user guide.
RRS Discovery cruise DY112 surface hydrography instrumentation
Instrumentation
The sea surface hydrographical suite of sensors was fed by the pumped-seawater, non-toxic supply. The depth of the seawater intake was at 5.5 m.
The following surface hydrology sensors were fitted:
| Make/model | Serial number | Last calibration date | Orientation | Status | Comments |
|---|---|---|---|---|---|
| WetLabs WS3S | WS3S-351P | 05-Aug-2019 | |||
| WetLabs CST | CST-1852PR | 19-Mar-2018 | |||
| Sea-Bird Scientific SBE 45 | 4548881-0230 | 27/06/2019 | Calibrated by sensor firmware | 1yr of operation within 2yr of cal date - Expires 04/09/2020 | |
| Sea-Bird Scientific SBE 38 | 3854115-0487 | 26-Jul-2019 | Calibrated by sensor firmware |
SeaBird MicroTSG Thermosalinograph SBE 45
The SBE45 MicroTSG is an externally powered instrument designed for shipboard measurement of temperature and conductivity of pumped near-surface water samples. The instrument can also compute salinity and sound velocity internally.
The MicroTSG comprises a platinum-electrode glass conductivity cell and a stable, pressure-protected thermistor temperature sensor. It also contains an RS-232 port for appending the output of a remote temperature sensor, allowing for direct measurement of sea surface temperature.
The instrument can operate in Polled, Autonomous and Serial Line Sync sampling modes:
- Polled sampling: the instrument takes one sample on command
- Autonomous sampling: the instrument samples at preprogrammed intervals and does not enter quiescence (sleep) state between samples
- Serial Line Sync: a pulse on the serial line causes the instrument to wake up, sample and re-enter quiescent state automatically
Specifications
| Conductivity | Temperature | Salinity | |
|---|---|---|---|
| Range | 0 to 7 Sm-1 | -5 to 35°C | |
| Initial accuracy | 0.0003 Sm-1 | 0.002°C | 0.005 (typical) |
| Resolution | 0.00001 Sm-1 | 0.0001°C | 0.0002 (typical) |
| Typical stability (per month) | 0.0003 Sm-1 | 0.0002°C | 0.003 (typical) |
Further details can be found in the manufacturer's specification sheet.
RRS Discovery cruise DY112 surface hydrography data processing procedures
Originator's Data Processing
The data were logged by the TECHSAS (TECHnical and Scientific sensors Acquisition System) system into daily NetCDF files. The TECHSAS system is used as the main data logging system on NMF-SS operated reserach vessels. The daily TECHSAS NetCDF files provided to BODC were used for BODC processing. Data were additionally logged into the RVS Level-C format files which have been archived at BODC.
Files delivered to BODC
| Filename | Function | Format | Resolution | Start time | End time | Comments |
|---|---|---|---|---|---|---|
| *-Surf-*-SM_*.SURFMETv3 | Fluo, trans, flow | TECHSAS | 1 Hz | 14-Jan-2020 14:59:33 | 24-Jan-2020 22:01:32 | |
| *-SBE45-SBE45_*.TSG | TSG | TECHSAS | 1 Hz | 14-Jan-2020 14:59:33 | 22-Jan-2020 13:35:54 |
BODC Data Processing
The files were reformatted to BODC internal format using standard data banking procedures. All files were averaged to 60 second intervals. The following table shows how the variables within the files were mapped to appropriate BODC parameter codes:
| Source file | Originator's variable | Units | Description | BODC code | BODC unit | Converion | Comments |
|---|---|---|---|---|---|---|---|
| *-SBE45-SBE45_*.TSG | temp_h | deg C | Temperature (housing) | TMESSG01 | deg C | ||
| *-SBE45-SBE45_*.TSG | cond | S/m | Conductivity | CNDCSG01 | S/m | ||
| *-SBE45-SBE45_*.TSG | salin | PSU | Practical salinity | PSALSU01 | PSU | ||
| *-SBE45-SBE45_*.TSG | temp_r | deg C | Temperature (remote) | TEMPHU01 | deg C | ||
| *-Surf-*-SM_*.SURFMETv3 | fluo | V | Raw fluoresence output | FVLTWS01 | V | ||
| *-Surf-*-SM_*.SURFMETv3 | trans | V | Raw transmissometer output | TVLtdR01 | V | ||
| *-Surf-*-SM_*.SURFMETv3 | flow1 | l/min | Water flow through system | INFLTF01 | l/min | ||
| Beam transmission | POPtdR01 | % | Derived at BODC | ||||
| Beam attenuation | ATTNDR01 | m-1 | Derived at BODC | ||||
| Chlorophyll fluorescence | CPHLUMTF | ug/L | Derived at BODC |
Manufacturers Calibrations
Transmissometer
The transmissometer voltage channel was converted to beam transmission ( beamtrans ) and beam attenuation ( atten ) as follows:
beamtrans [%] = ([ volts - Vdark ] / [ Vref - Vdark ])100
atten [per m] = (-1/ pathlength ) ln( beamtrans /100)
where Vdark = 0.004 V, Vref = 4.7 V and pathlength = 0.25 m.
Fluorometer
The fluorescence voltage channel was converted to engineering units ( chla ) using the following calibration:
chla [µg/L]= SF ( volts - CWO )
where SF = 11.4 µg/L/V and CWO = 0.045 V.
Processing
All the reformatted data were visualised using the in-house EDSERPLO software. Suspect data were marked by adding an appropriate quality control flag.
Field Calibrations
Sea surface salinity
Sea surface salinity (SSS) was calibrated against independent salinity bottle samples extracted from the non-toxic pumped-seawater supply during the cruise. Offsets (n = 14) between bottle salinity and corresponding SSS measurements were calculated, revealing the bias in salinity measurements varied during the cruise:
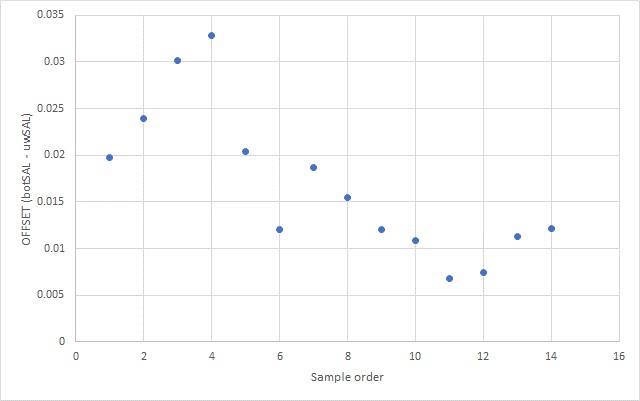
Following discussions with the originator the calibration for salinity was split into 3 sections: pre-station, on-station and post-station. Two outliers were removed and the following calibrations were obtained:
Pre-station (to 19/01/2020 23:59:59)
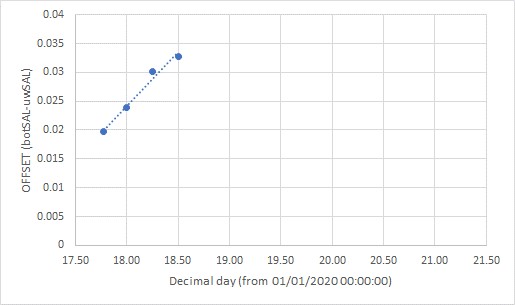
(a + (b * day)) + old salinity
where a = -0.3117, b = 0.01866 and day = decimal day since 01/01/2020 00:00:00 (P = 0.01, n = 4, adjR2 = 0.9672).
On-station (20/01/2020 00:00:00 to 21/01/2020 23:59:59)
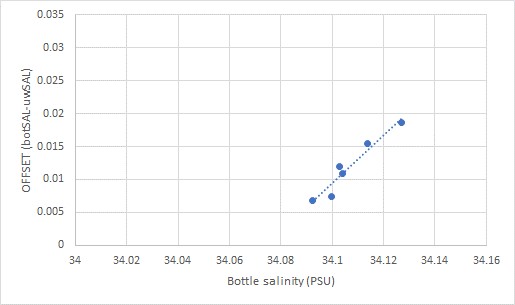
(a + (b * sal)) + old salinity
where a = -19.8426, b = 1.5823 and sal = old (uncalibrated) salinity (P = 0.002, n = 6, adjR2 = 0.9081).
After-station (From 22/01/2020 00:00:00)
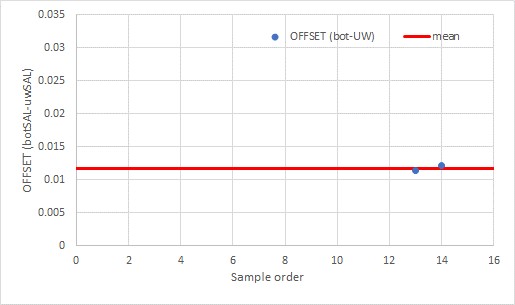
old salinity + a
where a = mean offset of 0.0117 (n = 2, +/- 0.0004 S.E.).
Sea surface temperature
No CTD casts were available to investigate the temperature bias. Following discussions with the originator, the bias observed on the preceding cruise (DY111) was applied:
old temperature + a
where a = offset of -0.3 (+/- 0.15). See DY111 cruise report p53.
Project Information
Carbon Uptake and Seasonal Traits of Antarctic Remineralisation Depth (CUSTARD)
Carbon Uptake and Seasonal Traits of Antarctic Remineralisation Depth (CUSTARD) is a £1.8 million, four-year (2018-2022) research project funded by the Natural Environment Research Council (NERC).
The main aim of the CUSTARD project is to quantify the seasonal drivers of carbon fluxes in a region of the Southern Ocean upper limb, and estimate how long different quantities of carbon are kept out of the atmosphere based on the water flow routes at the observed remineralisation depths. Please visit the CUSTARD web page for more information
CUSTARD is one of three projects funded as part of the Role of the Southern Ocean in the Earth System (RoSES) programme, also known as the Southern Ocean programme. Please see the RoSES project document for more information on the wider programme and the research projects associated with it.
Background
The upper limb of the Antarctic Circumpolar Current (ACC) represents an important junction in the marine carbon cycle, as the fate of carbon fixed by surface phytoplankton will differ according to how deep it penetrates before being remineralised. If shallow remineralisation occurs, carbon will follow the upper limb circulation and upwell further north, escaping into the atmosphere within decades. On the other hand, deep remineralisation will result in carbon entering the lower limb circulation, with the potential of being retained in the ocean for hundreds of years. Seasonality in plankton dynamics play an important role in remineralisation depth, and CUSTARD aims to resolve all factors contributing to the carbon export out of the region.
Participants
Six different UK-based organisations are directly involved in research for CUSTARD:
- National Oceanography Centre (NOC)
- NERC British Antarctic Survey (BAS)
- University of Southampton
- University of Oxford
- Plymouth University
- University of East Anglia (UEA)
CUSTARD collaborates closely with the US Ocean Observatories Initiative (OOI) program through sharing of instruments and platforms at and around the Global Southern Ocean Array. OOI is funded by the National Science Foundation (NSF) and is managed by the Woods Hole Oceanographic Institution. Rutgers University maintains the cyberinfrastructure component, working alongside CUSTARD scientists in the handling and distribution of shared observational data.
Research details
Four Work Packages have been funded by the CUSTARD project, each addressing a separate project objective within the region of study in the south eastern Pacific ocean. These are described briefly below:
-
Work Package 1: Obtain an accurate picture of the seasonal air-sea flux and macronutrient drawdown.
This work package aims at determining the magnitude and variability of air-sea CO2 fluxes and their physical and biogeochemical drivers. High-resolution carbon measurements in the water column, CO2 flux estimates and daily resolved nitrate and silicate observations are combined to better understand the link between seasonal changes in CO2 fluxes and biological variability. -
Work Package 2: Quantify the link between iron and silicate availability and remineralisation depth.
This work package investigates the annual cycle of phytoplankton dynamics, net production and export of organic material in conjunction with iron availability. -
Work Package 3: Observationally determine the seasonal cycle in remineralisation depth.
This work package assesses remineralisation depth and its variability using marine snow catchers deployed during the process cruise, and backscatter measurements carried out year-round by gliders. -
Work Package 4: Examine the link between seasonality and remineralisation depth and the trajectory of carbon from the surface out of the upper limb.
This work package aims to ingest all CUSTARD observational data into models to determine whether seasonal variability in phytoplankton composition is reflected in changes in remineralisation depth, which in turn leads to seasonal variability in the fate of organic carbon leaving the Southern Ocean via the upper limb.
Fieldwork and data collection
All the observational data from the project is collected at and south of the Ocean Observatories Initiative (OOI) Global Southern Ocean Array, located south-west of Chile. Data collection activities span from November 2018 to January 2020, and include three cruises, four glider missions, and one mooring.
Cruises
All cruises depart from and return to Punta Arenas (Chile). Cruise activities include deployments and recovery of gliders and a mooring, Conductivity, Temperature and Depth (CTD), trace metal clean GoFlo bottle sampling, Red Camera Frame, Marine Snow Catcher and Underwater Vision Profiler deployments, as well as laboratory incubations with sea water samples. See cruise details below:
| Cruise identifier | Research ship | Cruise dates | Comments |
|---|---|---|---|
| DY096 | RRS Discovery | November - December 2018 | Deployment cruise |
| DY111 | RRS Discovery | December 2019 - January 2020 | Process cruise |
| DY112 | RRS Discovery | January 2020 | Mooring recovery cruise |
Gliders
Two Slocum 1000 MARS gliders (Pancake and Churchill) are deployed from DY096, to collect data continuously for one year until recovery on DY111. The gliders are mounted with CTD sensors, an optode, a fluorometer, and twin backscatter sensors. Pancake failed and its mission ended early in February 2019.
One Rutgers University glider is deployed from DY111, to collect data until recovery at the end of the same cruise. The glider is owned by Rutgers University and the data is shared with CUSTARD. It carries CTD sensors, an optode, a fluorometer, a backscatter sensor and a particle size analyser.
Mooring
Deployment of Global Surface Mooring GS01SUMO-00004 (SUMO-4) during DY096, to take continuous measurements for approximately one year until recovery during DY112. Its location is roughly 54 28 S, 89 02 W. This is an OOI mooring provided and deployed by WHOI, and adapted to integrate NOC lab-on-chip nitrate and silicate sensors.
Contacts
Dr. Adrian Marin (National Oceanography Centre, UK) - Lead Principal Investigator and lead of Work Package 4
Dr. Dorothee Bakker (University of East Anglia, UK) - Lead of Work Package 1
Prof. Mark Moore (University of Southampton, UK) - Lead of Work Package 2
Dr. Stephanie Henson (National Oceanography Centre / University of Southampton, UK) - Lead of Work Package 3
Data Activity or Cruise Information
Cruise
| Cruise Name | DY112 |
| Departure Date | 2020-01-16 |
| Arrival Date | 2020-01-25 |
| Principal Scientist(s) | Sheri White (Woods Hole Oceanographic Institution Department of Applied Ocean Physics and Engineering) |
| Ship | RRS Discovery |
Complete Cruise Metadata Report is available here
Fixed Station Information
No Fixed Station Information held for the Series
BODC Quality Control Flags
The following single character qualifying flags may be associated with one or more individual parameters with a data cycle:
| Flag | Description |
|---|---|
| Blank | Unqualified |
| < | Below detection limit |
| > | In excess of quoted value |
| A | Taxonomic flag for affinis (aff.) |
| B | Beginning of CTD Down/Up Cast |
| C | Taxonomic flag for confer (cf.) |
| D | Thermometric depth |
| E | End of CTD Down/Up Cast |
| G | Non-taxonomic biological characteristic uncertainty |
| H | Extrapolated value |
| I | Taxonomic flag for single species (sp.) |
| K | Improbable value - unknown quality control source |
| L | Improbable value - originator's quality control |
| M | Improbable value - BODC quality control |
| N | Null value |
| O | Improbable value - user quality control |
| P | Trace/calm |
| Q | Indeterminate |
| R | Replacement value |
| S | Estimated value |
| T | Interpolated value |
| U | Uncalibrated |
| W | Control value |
| X | Excessive difference |
SeaDataNet Quality Control Flags
The following single character qualifying flags may be associated with one or more individual parameters with a data cycle:
| Flag | Description |
|---|---|
| 0 | no quality control |
| 1 | good value |
| 2 | probably good value |
| 3 | probably bad value |
| 4 | bad value |
| 5 | changed value |
| 6 | value below detection |
| 7 | value in excess |
| 8 | interpolated value |
| 9 | missing value |
| A | value phenomenon uncertain |
| B | nominal value |
| Q | value below limit of quantification |
