Metadata Report for BODC Series Reference Number 2049617
Metadata Summary
Problem Reports
Data Access Policy
Narrative Documents
Project Information
Data Activity or Cruise Information
Fixed Station Information
BODC Quality Flags
SeaDataNet Quality Flags
Metadata Summary
Data Description |
|||||||||||||||||||||||||||||||||||||
|
|||||||||||||||||||||||||||||||||||||
Data Identifiers |
|||||||||||||||||||||||||||||||||||||
|
|||||||||||||||||||||||||||||||||||||
Time Co-ordinates(UT) |
|||||||||||||||||||||||||||||||||||||
|
|||||||||||||||||||||||||||||||||||||
Spatial Co-ordinates | |||||||||||||||||||||||||||||||||||||
|
|||||||||||||||||||||||||||||||||||||
Parameters |
|||||||||||||||||||||||||||||||||||||
|
|||||||||||||||||||||||||||||||||||||
Definition of BOTTFLAG | |||||||||||||||||||||||||||||||||||||
| BOTTFLAG | Definition |
|---|---|
| 0 | The sampling event occurred without any incident being reported to BODC. |
| 1 | The filter in an in-situ sampling pump physically ruptured during sample resulting in an unquantifiable loss of sampled material. |
| 2 | Analytical evidence (e.g. surface water salinity measured on a sample collected at depth) indicates that the water sample has been contaminated by water from depths other than the depths of sampling. |
| 3 | The feedback indicator on the deck unit reported that the bottle closure command had failed. General Oceanics deck units used on NERC vessels in the 80s and 90s were renowned for reporting misfires when the bottle had been closed. This flag is also suitable for when a trigger command is mistakenly sent to a bottle that has previously been fired. |
| 4 | During the sampling deployment the bottle was fired in an order other than incrementing rosette position. Indicative of the potential for errors in the assignment of bottle firing depth, especially with General Oceanics rosettes. |
| 5 | Water was reported to be escaping from the bottle as the rosette was being recovered. |
| 6 | The bottle seals were observed to be incorrectly seated and the bottle was only part full of water on recovery. |
| 7 | Either the bottle was found to contain no sample on recovery or there was no bottle fitted to the rosette position fired (but SBE35 record may exist). |
| 8 | There is reason to doubt the accuracy of the sampling depth associated with the sample. |
| 9 | The bottle air vent had not been closed prior to deployment giving rise to a risk of sample contamination through leakage. |
Definition of Rank |
|
|
Problem Reports
No Problem Report Found in the Database
Data Access Policy
Open Data
These data have no specific confidentiality restrictions for users. However, users must acknowledge data sources as it is not ethical to publish data without proper attribution. Any publication or other output resulting from usage of the data should include an acknowledgment.
If the Information Provider does not provide a specific attribution statement, or if you are using Information from several Information Providers and multiple attributions are not practical in your product or application, you may consider using the following:
"Contains public sector information licensed under the Open Government Licence v1.0."
Narrative Documents
SPX Bran+Luebbe Autoanalyser 3
The instrument uses continuous flow analysis (CFA) with a continuous stream of material divided by air bubbles into discrete segments in which chemical reactions occur. The continuous stream of liquid samples and reagents are combined and transported in tubing and mixing coils. The tubing passes the samples from one apparatus to the other with each apparatus performing different functions, such as distillation, dialysis, extraction, ion exchange, heating, incubation, and subsequent recording of a signal.
An essential principle of the system is the introduction of air bubbles. The air bubbles segment each sample into discrete packets and act as a barrier between packets to prevent cross contamination as they travel down the length of the tubing. The air bubbles also assist mixing by creating turbulent flow (bolus flow), and provide operators with a quick and easy check of the flow characteristics of the liquid.
Samples and standards are treated in an exactly identical manner as they travel the length of the tubing, eliminating the necessity of a steady state signal, however, since the presence of bubbles create an almost square wave profile, bringing the system to steady state does not significantly decrease throughput and is desirable in that steady state signals (chemical equilibrium) are more accurate and reproducible.
The autoanalyzer can consist of different modules including a sampler, pump, mixing coils, optional sample treatments (dialysis, distillation, heating, etc), a detector, and data generator. Most continuous flow analyzers depend on color reactions using a flow through colorimeter, however other methods have been developed that use ISE, flame photometry, ICAP, fluorometry, and so forth.
More details can be found in the manufacturer's introduction to autoanalysers andinstrument description.
Niskin Bottle
The Niskin bottle is a device used by oceanographers to collect subsurface seawater samples. It is a plastic bottle with caps and rubber seals at each end and is deployed with the caps held open, allowing free-flushing of the bottle as it moves through the water column.
Standard Niskin
The standard version of the bottle includes a plastic-coated metal spring or elastic cord running through the interior of the bottle that joins the two caps, and the caps are held open against the spring by plastic lanyards. When the bottle reaches the desired depth the lanyards are released by a pressure-actuated switch, command signal or messenger weight and the caps are forced shut and sealed, trapping the seawater sample.
Lever Action Niskin
The Lever Action Niskin Bottle differs from the standard version, in that the caps are held open during deployment by externally mounted stainless steel springs rather than an internal spring or cord. Lever Action Niskins are recommended for applications where a completely clear sample chamber is critical or for use in deep cold water.
Clean Sampling
A modified version of the standard Niskin bottle has been developed for clean sampling. This is teflon-coated and uses a latex cord to close the caps rather than a metal spring. The clean version of the Levered Action Niskin bottle is also teflon-coated and uses epoxy covered springs in place of the stainless steel springs. These bottles are specifically designed to minimise metal contamination when sampling trace metals.
Deployment
Bottles may be deployed singly clamped to a wire or in groups of up to 48 on a rosette. Standard bottles and Lever Action bottles have a capacity between 1.7 and 30 L. Reversing thermometers may be attached to a spring-loaded disk that rotates through 180° on bottle closure.
Nutrient (Phosphate, Nitrate + Nitrite, Nitrite, Silicate), Helium, and Neon - CTD water samples for Cruise JC156
Originator's Protocol for Data Acquisition and Analysis
Nutrients
Acid clean 60 ml HDPE Nalgene bottles were used for all the nutrient sampling, these were initially aged, acid washed and cleaned, and then stored with a 10 % acid solution between samplings. Water column depth profile samples were taken from the OTE bottles from the Trace Metal CTD system and sub-sampled into the Nalgene nutrient bottles from within the trace metal clean laboratory onboard the RRS James Cook. The sample bottles were washed 3 times before taking the final sample, and being capped tightly. These were then taken immediately to the nutrient analysers in the chemistry lab and analysis was conducted as soon as possible after sampling. Nutrient free (Semperguard) gloves were used and other clean handling protocols were adopted as close as possible to the GO-SHIP protocols.
Analysis:
The micro-molar segmented flow colorimetric auto-analyser used was the PML 5- channel (nitrate, nitrite, phosphate, silicate, and ammonium) Bran and Luebbe AAIII system, using classical proven analytical techniques. The instrument was calibrated with home produced nutrient stock standards and then compared regularly against Nutrient Reference Materials, from KANSO Technos, Japan for quality control and checking of analytical standardisation. Batches CA and BU were used during the cruise. The analytical chemical methodologies used were according to Brewer and Riley (1965) for nitrate, Grasshoff (1976) for nitrite, Kirkwood (1989) for silicate and phosphate, and Mantoura and Woodward (1983) for dissolved ammonium. Nanomolar analysis was carried out for ammonium using a fluorimetric detection differential gas diffusion technique, based on Jones R.D, 1991. Nanomolar nitrate, nitrite, and phosphate were analysed using segmented flow colorimetric techniques with 2 metre Liquid waveguides as the analytical flow cells to improve the analytical detection limits. Nitrate and nitrite used the same colorimetric methods as for the micromolar system and for phosphate we used the Zhang and Chi (2002) method.
Helium and Neon
Helium isotope, and helium and neon concentrations were measured on samples drawn from Niskin bottles via tygon tubing and stored in crimped 5/8 " copper tubing using the technique described by Young and Lupton (1983). The gas samples were quantitatively extracted on shore using a water vapor extraction method into 25 ml aluminosilicate glass ampoules (Lott and Jenkins, 1998).
Analysis:
The noble gas abundance measurements were made on a custom designed and built automated cryogenic and vacuum system that incorporated a HIDEN quadrupole mass spectrometer (P/N PCI 1000 1.2HAL/3F 1301-9 PIC type 570309), equipped with an electron impact ion source, triple quadrupole mass filter, and a pulse counting secondary electron multiplier (SEM). As described by Jenkins et al (2019), helium and neon concentrations were determined by ion current peak-height manometry against a calibrated marine air standard and corrected quadratically for size-non-linearity. Helium was measured to 0.3 % and neon was determined to 0.55 %. Earlier methodological details (superseded by the later paper) were presented by Stanley et al, (2009). Helium isotope measurements were made on the same samples using a custom designed and built magnetic sector, dual-collecting mass spectrometer described by Lott and Jenkins (1984); referenced to marine air to an accuracy of 0.15 % or better, and corrected for instrumental non-linearity (dependence of isotope ratio determination on sample size). Similarly, the tritium measurements were made using the He-3 regrowth method devised by Clarke et al (1976) and a second, dedicated magnetic sector, dual-collecting mass spectrometer. All uncertainties were confirmed by replicate analyses of water samples and standards.
References Cited
Brewer P.G. and Riley J.P., 1965. The automatic determination of nitrate in seawater. Deep SeaResearch, 12, 765-72.
Clarke, W.B., Jenkins, W.J. and Top, Z., 1976. Determination of tritium by spectrometric measurement of 3He. International Journal of Applied Radiation and Isotopes, 27: 515-525.
Grasshoff K., 1976. Methods of seawater analysis. Verlag Chemie, Weinheim and New York,317pp.
Kirkwood D., 1989. Simultaneous determination of selected nutrients in seawater. ICES CM1989/C:29.
Lott, D.E., 2001. Improvements in noble gas separation methodology: a nude cryogenic trap. Geochemistry, Geophysics, Geosystems 2, doi: 10.129/2001GC000202.
Lott, D.E., Jenkins, W.J., 1984. An automated cryogenic charcoal trap system for helium isotope mass spectrometry. Review of Scientific Instruments 55, 1982-1988. doi: 10.1063/1.1137692
Lott, D.E., Jenkins, W.J., 1998. Advances in the analysis and shipboard processing of tritium and helium samples. International WOCE Newsletter 30, 27-30.
Mantoura, R.F.C and Woodward, E.M.S, 1983. Estuarine, Coastal and Shelf Science, 17, 219-224.
Jenkins, W.J., Lott, D.E., III and Cahill, K.L., 2019. A Determination of Atmospheric Helium, Neon, Argon, Krypton, and Xenon Solubility Concentrations in Water and Seawater. Marine Chemistry, 211(1): 94-107.
Jones, R. D. 1991. Limnology and Oceanography, 36(4), 814-819.
Jia-Zhong Z. and Jie C., 2002. Automated Analysis of Nanomolar Concentrations of Phosphatein Natural Waters with Liquid Waveguide. Environ. Sci. Technol., 36 (5), pp 1048-1053
Stanley, R.H.R., Baschek, B., Lott, D.E., III and Jenkins, W.J., 2009. A new automated method for measuring noble gases and their isotopic ratios in water samples. Geochemistry Geophysics Geosystems, 10(5): Q05008, doi:10.1029/2009GC002429.
Young, C., Lupton, J.E., 1983. An ultratight fluid sampling system using cold-welded copper tubing. EOS Transactions AGU 64, 735.
JC156 Cruise report
Further information can be found in the JC156 Cruise report.
BODC Data Processing Procedures
Data were submitted containing dissolved and low-level dissolved nutrient sample measurements of ammonium, phosphate, silicate, nitrate + nitrite, and nitrite data, as well as dissolved helium and neon and delta 3-helium measurements. Additional metadata such as station, position, date, time, CTD cast number, CTD bottle number and depth (m) were also included in the file. The data were reformatted and assigned BODC parameter codes. Quality control checks were made and BODC applied flags were applicable. The data were then loaded into the BODC database using established BODC data banking procedures.
A parameter mapping table is provided below:
| Originator's Variable | Originator's Units | BODC Parameter Code | BODC Unit | Comments |
|---|---|---|---|---|
| Nitrate + Nitrate | umol/l | NTRZAATX | umol/l | - |
| Nitrate + Nitrate (low-level) | nmol/l | NTRZLWTX | umol/l | Conversion /1000 |
| Nitrite | umol/l | NTRIAATX | umol/l | - |
| Nitrite (low-level) | nmol/l | NTRILWTX | umol/l | Conversion /1000 |
| Silicate | umol/l | SLCAAATX | umol/l | - |
| Phosphate | umol/l | PHOSAATX | umol/l | - |
| Phosphate (low-level) | nmol/l | PHOSLWTX | umol/l | Conversion /1000 |
| Helium (delta 3He) | % | D3HEMXDG | % | - |
| Helium (dissolved) | mol/kg | HEXCMX01 | nmol/kg | Conversion *109 |
| Neon (dissolved) | mol/kg | NECNMASS | nmol/kg | Conversion *109 |
Data Quality Report
BODC performed quality control checks on the data. Any data values deemed suspicious by the Originator were applied an 'L' flag. Any data values which were below the detection limit of the instrument were applied a '<' flag.
Project Information
FRidge: The impact of Mid-Ocean Ridges on the Ocean's Iron cycle
FRidge is a research project funded by the UK Natural Environment Research Council (NERC). It aims to explore hypotheses regarding the mechanisms that shape ocean iron distribution and in particular, the role of hydrothermal inputs from distinct vent sites along the Mid-Atlantic Ridge.
The project is part of the UK contribution to the international GEOTRACES programme. Research will take place along the GEOTRACES International Section GA13.
Introduction
Photosynthesis by marine phytoplankton contributes to the partitioning of carbon dioxide between the atmosphere and the ocean. Iron is essential for phytoplankton growth as it is required for a number of important enzymes that participate in both photosynthesis and respiration. Mid-ocean ridges are significant sources of iron to the ocean due to hydrothermal activity, with dramatic iron plumes that persist for thousands of kilometres away from the ridge.
The impact of hydrothermal iron on the ocean carbon cycle depends both on the longevity of the iron plumes and the mixing of iron into surface waters, with both aspects poorly constrained. Thus our understanding of how the ocean iron cycle functions is incomplete. This is important as the influence of ocean biology on ocean-atmosphere carbon dioxide exchanges via the biological pump is controlled by iron availability over large parts of the ocean.
Scientific Objectives
The main objectives of the project are to:
1. Document the changes in iron supply, cycling and speciation along the diverse hydrothermal systems of the northern Mid-Atlantic Ridge.
2. Link observational science with state of the art ocean modelling to assess the global influence of mid-ocean ridges on the ocean iron cycle and the sustenance of surface productivity.
To deliver on these objectives, a research expedition to the Atlantic Ocean was carried out to measure trace metals, nutrients and ocean physics over and around the Mid-Atlantic Ridge. Ultimately this will be able to address the broader question of how the amount of iron from mid-ocean ridges can influence phytoplankton growth in the open ocean.
Fieldwork
The FRidge cruise was completed aboard RRS James Cook cruise JC156, which ran between Southampton and Guadeloupe from the 20th of December 2017 to the 1st of February 2018. See the table below for details on what was sampled:
| Data Type | Description | Units |
| Trace elements | Dissolved trace metals (from Ti-Rosette) | nmol/L |
| Trace elements | Particulate trace metals (from Ti rosette) | µmol/L |
| Trace elements | Particulate trace metals (from SAPS) | µmol/L |
| Other chemical oceanographic elements | Helium | fmol/L |
| Phosphate | Phosphate (from SSR and Ti-Rosette) | µmol/L |
| Silicate | Silicate (from SSR and Ti-Rosette) | µmol/L |
| Nitrate | Nitrate (from SSR and Ti-Rosette) | µmol/L |
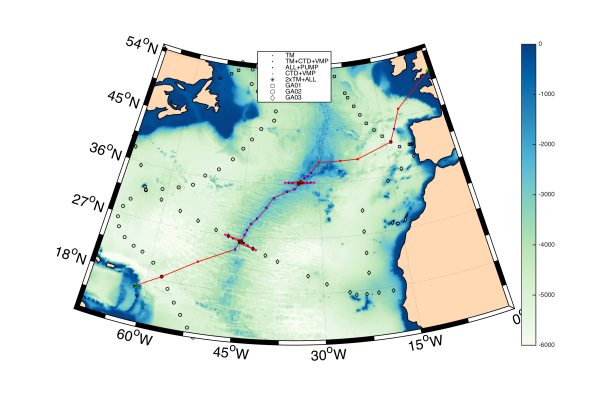
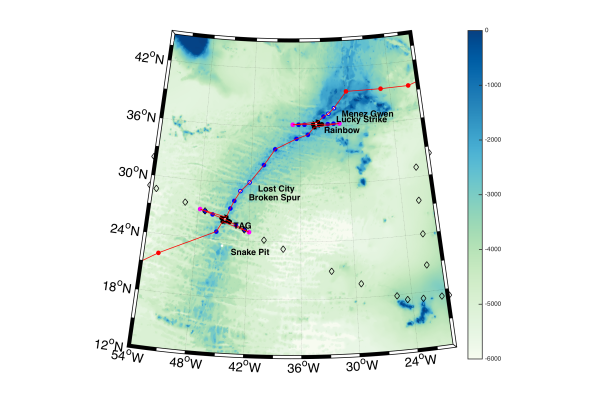
The above images show the locations of known hydrothermal vent systems and the dots represent locations where sampling took place.
Project Collaborators
The science delivered as part of this GEOTRACES section is greatly enhanced by the collaboration with a number of scientists from the following institutions:
- University of Southampton
- University of Liverpool
- Plymouth Marine Laboratory
- Oxford University
- University of South Florida
- University of Washington
- University of California Santa Barbara
- Woods Hole Oceanographic Institute
Scientific Personnel
- Alessandro Tagliabue (Cruise Chief Scientist, University of Liverpool, UK)
- Maeve Lohan (University of Southampton, UK)
- Andy Heath (University of Liverpool, UK)
- Alastair Lough (University of Southampton, UK)
- Shaun Rigby (University of Liverpool, UK)
Project Partners
- Alex Baker (University of East Anglia)
- William Jenkins (Woods Hole Oceanographic Institute)
- Brandy Toner (University of Minnesota)
Funding
This is a NERC funded research project. Funding was provided in the form of two fellowship and training grants.Total value of £527,588. The lead/parent grant reference number is NE/N010396/1 led by Maeve Lohan and the child grant NE/N009525/1 is led by Alessandro Tagliabue.
Period of Award: 4 Sep 2017 - 3 Mar 2020
Data Activity or Cruise Information
Data Activity
| Start Date (yyyy-mm-dd) | 2018-01-09 |
| End Date (yyyy-mm-dd) | 2018-01-09 |
| Organization Undertaking Activity | National Oceanography Centre, Southampton |
| Country of Organization | United Kingdom |
| Originator's Data Activity Identifier | JC156_CTD_CTD039 |
| Platform Category | lowered unmanned submersible |
BODC Sample Metadata Report for JC156_CTD_CTD039
| Sample reference number | Nominal collection volume(l) | Bottle rosette position | Bottle firing sequence number | Minimum pressure sampled (dbar) | Maximum pressure sampled (dbar) | Depth of sampling point (m) | Bottle type | Sample quality flag | Bottle reference | Comments |
|---|---|---|---|---|---|---|---|---|---|---|
| 1573295 | 1 | 2650.00 | 2651.00 | 2614.60 | Niskin bottle | No problem reported | 913 | |||
| 1573298 | 2 | 2588.90 | 2589.90 | 2554.60 | Niskin bottle | No problem reported | 914 | |||
| 1573301 | 3 | 2538.30 | 2539.30 | 2505.00 | Niskin bottle | No problem reported | 915 | |||
| 1573304 | 4 | 2485.60 | 2486.60 | 2453.30 | Niskin bottle | No problem reported | 916 | |||
| 1573307 | 5 | 2437.80 | 2438.80 | 2406.40 | Niskin bottle | No problem reported | 917 | |||
| 1573310 | 6 | 2386.00 | 2387.00 | 2355.60 | Niskin bottle | No problem reported | 918 | |||
| 1573313 | 7 | 2334.70 | 2335.70 | 2305.20 | Niskin bottle | No problem reported | 919 | |||
| 1573316 | 8 | 2283.90 | 2284.90 | 2255.30 | Niskin bottle | No problem reported | 920 | |||
| 1573319 | 9 | 2234.20 | 2235.20 | 2206.50 | Niskin bottle | No problem reported | 921 | |||
| 1573322 | 10 | 2080.50 | 2081.50 | 2055.50 | Niskin bottle | No problem reported | 922 | |||
| 1573325 | 11 | 1826.80 | 1827.80 | 1806.00 | Niskin bottle | No problem reported | 923 | |||
| 1573328 | 12 | 1419.80 | 1420.80 | 1405.10 | Niskin bottle | No problem reported | 924 | |||
| 1573331 | 13 | 1214.90 | 1215.90 | 1203.00 | Niskin bottle | No problem reported | 925 | |||
| 1573334 | 14 | 1115.20 | 1116.20 | 1104.50 | Niskin bottle | No problem reported | 926 | |||
| 1573337 | 15 | 913.60 | 914.60 | 905.40 | Niskin bottle | No problem reported | 927 | |||
| 1573340 | 16 | 701.10 | 702.10 | 695.30 | Niskin bottle | No problem reported | 928 | |||
| 1573343 | 17 | 510.10 | 511.10 | 506.20 | Niskin bottle | No problem reported | 929 | |||
| 1573346 | 18 | 358.90 | 359.90 | 356.50 | Niskin bottle | No problem reported | 930 | |||
| 1573349 | 19 | 257.30 | 258.30 | 255.70 | Niskin bottle | No problem reported | 931 | |||
| 1573352 | 20 | 157.00 | 158.00 | 156.30 | Niskin bottle | No problem reported | 932 | |||
| 1573355 | 21 | 125.00 | 126.00 | 124.50 | Niskin bottle | No problem reported | 933 | |||
| 1573358 | 22 | 85.80 | 86.80 | 85.60 | Niskin bottle | No problem reported | 934 | |||
| 1573361 | 23 | 46.00 | 47.00 | 46.20 | Niskin bottle | No problem reported | 935 | |||
| 1573364 | 24 | 25.10 | 26.10 | 25.40 | Niskin bottle | No problem reported | 936 |
Please note:the supplied parameters may not have been sampled from all the bottle firings described in the table above. Cross-match the Sample Reference Number above against the SAMPRFNM value in the data file to identify the relevant metadata.
Related Data Activity activities are detailed in Appendix 1
Cruise
| Cruise Name | JC156 (FRidGE, GA13) |
| Departure Date | 2017-12-20 |
| Arrival Date | 2018-02-01 |
| Principal Scientist(s) | Alessandro Tagliabue (National Oceanography Centre, Southampton) |
| Ship | RRS James Cook |
Complete Cruise Metadata Report is available here
Fixed Station Information
No Fixed Station Information held for the Series
BODC Quality Control Flags
The following single character qualifying flags may be associated with one or more individual parameters with a data cycle:
| Flag | Description |
|---|---|
| Blank | Unqualified |
| < | Below detection limit |
| > | In excess of quoted value |
| A | Taxonomic flag for affinis (aff.) |
| B | Beginning of CTD Down/Up Cast |
| C | Taxonomic flag for confer (cf.) |
| D | Thermometric depth |
| E | End of CTD Down/Up Cast |
| G | Non-taxonomic biological characteristic uncertainty |
| H | Extrapolated value |
| I | Taxonomic flag for single species (sp.) |
| K | Improbable value - unknown quality control source |
| L | Improbable value - originator's quality control |
| M | Improbable value - BODC quality control |
| N | Null value |
| O | Improbable value - user quality control |
| P | Trace/calm |
| Q | Indeterminate |
| R | Replacement value |
| S | Estimated value |
| T | Interpolated value |
| U | Uncalibrated |
| W | Control value |
| X | Excessive difference |
SeaDataNet Quality Control Flags
The following single character qualifying flags may be associated with one or more individual parameters with a data cycle:
| Flag | Description |
|---|---|
| 0 | no quality control |
| 1 | good value |
| 2 | probably good value |
| 3 | probably bad value |
| 4 | bad value |
| 5 | changed value |
| 6 | value below detection |
| 7 | value in excess |
| 8 | interpolated value |
| 9 | missing value |
| A | value phenomenon uncertain |
| B | nominal value |
| Q | value below limit of quantification |
Appendix 1: JC156_CTD_CTD039
Related series for this Data Activity are presented in the table below. Further information can be found by following the appropriate links.
If you are interested in these series, please be aware we offer a multiple file download service. Should your credentials be insufficient for automatic download, the service also offers a referral to our Enquiries Officer who may be able to negotiate access.
| Series Identifier | Data Category | Start date/time | Start position | Cruise |
|---|---|---|---|---|
| 2048976 | Water sample data | 2018-01-09 06:04:00 | 36.381 N, 33.694 W | RRS James Cook JC156 (FRidGE, GA13) |
