Metadata Report for BODC Series Reference Number 2056442
Metadata Summary
Problem Reports
Data Access Policy
Narrative Documents
Project Information
Data Activity or Cruise Information
Fixed Station Information
BODC Quality Flags
SeaDataNet Quality Flags
Metadata Summary
Data Description |
|||||||||||||||||||||||||||||||||
|
|||||||||||||||||||||||||||||||||
Data Identifiers |
|||||||||||||||||||||||||||||||||
|
|||||||||||||||||||||||||||||||||
Time Co-ordinates(UT) |
|||||||||||||||||||||||||||||||||
|
|||||||||||||||||||||||||||||||||
Spatial Co-ordinates | |||||||||||||||||||||||||||||||||
|
|||||||||||||||||||||||||||||||||
Parameters |
|||||||||||||||||||||||||||||||||
|
|||||||||||||||||||||||||||||||||
Definition of BOTTFLAG | |||||||||||||||||||||||||||||||||
| BOTTFLAG | Definition |
|---|---|
| 0 | The sampling event occurred without any incident being reported to BODC. |
| 1 | The filter in an in-situ sampling pump physically ruptured during sample resulting in an unquantifiable loss of sampled material. |
| 2 | Analytical evidence (e.g. surface water salinity measured on a sample collected at depth) indicates that the water sample has been contaminated by water from depths other than the depths of sampling. |
| 3 | The feedback indicator on the deck unit reported that the bottle closure command had failed. General Oceanics deck units used on NERC vessels in the 80s and 90s were renowned for reporting misfires when the bottle had been closed. This flag is also suitable for when a trigger command is mistakenly sent to a bottle that has previously been fired. |
| 4 | During the sampling deployment the bottle was fired in an order other than incrementing rosette position. Indicative of the potential for errors in the assignment of bottle firing depth, especially with General Oceanics rosettes. |
| 5 | Water was reported to be escaping from the bottle as the rosette was being recovered. |
| 6 | The bottle seals were observed to be incorrectly seated and the bottle was only part full of water on recovery. |
| 7 | Either the bottle was found to contain no sample on recovery or there was no bottle fitted to the rosette position fired (but SBE35 record may exist). |
| 8 | There is reason to doubt the accuracy of the sampling depth associated with the sample. |
| 9 | The bottle air vent had not been closed prior to deployment giving rise to a risk of sample contamination through leakage. |
Definition of Rank |
|
|
Problem Reports
No Problem Report Found in the Database
Data Access Policy
Open Data
These data have no specific confidentiality restrictions for users. However, users must acknowledge data sources as it is not ethical to publish data without proper attribution. Any publication or other output resulting from usage of the data should include an acknowledgment.
If the Information Provider does not provide a specific attribution statement, or if you are using Information from several Information Providers and multiple attributions are not practical in your product or application, you may consider using the following:
"Contains public sector information licensed under the Open Government Licence v1.0."
Narrative Documents
Thermo Scientific DELTA V Mass Spectrometer
The Thermo Scientific DELTA V series of isotope ratio mass spectrometers includes the DELTA V Advantage and the DELTA V Plus models. The two models are built on the same platform and offer all standard applications, including H2 analysis under helium carrier gas load. The DELTA V Advantage can be upgraded to the DELTA V Plus which has additional functionality for a wider scope of applications. Features of the DELTA V generation include use with up to ten detectors, use with a wide range of sample preparation devices, Dual Inlet system, a wide range of collector configurations and integrated signal amplifiers and digitizers. In addition, the DELTA V design includes a weld-free monolithic analyzer with fixed alignment of all ion optical components, including the electro magnet.
The ion source is computer controlled, supporting manual and automatic tuning and the Dual Inlet system enables close comparison of clean sample and reference gases under viscous flow conditions. The magnet is precision-mounted into the monolithic analyser with intrinsic alignment, its pole faces determining the free flight space for the ions, thus eliminating the traditional flight tube. The gain in ion beam height directly translates into increased sensitivity. The magnet is designed for fast mass switching which is further supported by a fast jump control between consecutive measurements of multiple gases within one run. The sample gas is introduced at ground potential, eliminating the need for insulation of the flow path, ensuring 100 % transfer into the ion source. Three or more isotope ratios can be in a single sample injection. The amplifiers register ion beams up to 50 V; the dynamic range can be further extended by switching between two feedback resistors. The DELTA V series of mass spectrometers are controlled by an automated, integrated Isodat software suite.
Analytical solutions for gas chromatography, HPLC and elemental analyzers enable fully automated isotope ratio analysis on the DETLA V. The Thermo Scientific ConFlo IV Universal Interface is the most widely used interface for coupling elemental analyzers with isotope ratio mass spectrometers. The Thermo Scientific LC IsoLink is commonly used for HPLC separations and the Thermo Scientific GC IsoLink is used for compound specific isotope analysis of complex mixtures separated on a capillary GC column. The DELTA V can be used with the Thermo Scientific GasBench II, a flexible continuous flow preparation device and inlet system with Repetitive Loop Injection of gases. The Thermo Scientific PreCon trace gas pre-concentrator can be connected to the GC IsoLink or the GasBench II for atmospheric trace-gas research in the ppm and ppb range.
The universal triple collector is standard on the Thermo Scientific DELTA V platform and is suitable for all standard applications involving N2, CO, NO, O2, CO2, N2O and SO2. Additional collectors include the D/H collector and individual collector arrangements.
| Performance | DELTA V Plus | DELTA V Advantage |
|---|---|---|
| Sensitivity Dual inlet mode | 800 M/l | 1200 M/l |
| Molecules CO2 / mass 44 ion translates to Sample Consumption for 5 nA signal at mass 44 | 0.04 nmol s -1 | 0.06 nmol s-1 |
| Sensitivity continuous flow mode | 1100 M/l | 1500 M/l |
| Molecules CO2 / mass 44 ion with Isotope Ratio Linearity | 0.02 per mil/nA | 0.02 per mil/nA |
| Mass range at 3kV | 1-96 Dalton | 1-80 Dalton |
| Mass Resolution (10% valley) | 110 | 110 |
| Effective Magnetic Deflection Radius | 191 mm | 191 mm |
| System Stability | <10 ppm | <10 ppm |
| H3 + Factor | <10 ppm /nA | <10 ppm /nA |
| H3 + Factor Stability | <0.03 ppm/nA/h | <0.03 ppm/nA/h |
| Noise Level | <50 dB | <50 dB |
Further details can be found in the manufacturer's manual.
Niskin Bottle
The Niskin bottle is a device used by oceanographers to collect subsurface seawater samples. It is a plastic bottle with caps and rubber seals at each end and is deployed with the caps held open, allowing free-flushing of the bottle as it moves through the water column.
Standard Niskin
The standard version of the bottle includes a plastic-coated metal spring or elastic cord running through the interior of the bottle that joins the two caps, and the caps are held open against the spring by plastic lanyards. When the bottle reaches the desired depth the lanyards are released by a pressure-actuated switch, command signal or messenger weight and the caps are forced shut and sealed, trapping the seawater sample.
Lever Action Niskin
The Lever Action Niskin Bottle differs from the standard version, in that the caps are held open during deployment by externally mounted stainless steel springs rather than an internal spring or cord. Lever Action Niskins are recommended for applications where a completely clear sample chamber is critical or for use in deep cold water.
Clean Sampling
A modified version of the standard Niskin bottle has been developed for clean sampling. This is teflon-coated and uses a latex cord to close the caps rather than a metal spring. The clean version of the Levered Action Niskin bottle is also teflon-coated and uses epoxy covered springs in place of the stainless steel springs. These bottles are specifically designed to minimise metal contamination when sampling trace metals.
Deployment
Bottles may be deployed singly clamped to a wire or in groups of up to 48 on a rosette. Standard bottles and Lever Action bottles have a capacity between 1.7 and 30 L. Reversing thermometers may be attached to a spring-loaded disk that rotates through 180° on bottle closure.
d15N, d13C, PON and POC samples from CTD bottles for Cruise JR16006
Originator's Protocol for Data Acquisition and Analysis
Seawater samples for the analysis of d15N-PN, d13C-PC, PON and POC were collected from up to 8 depths within the top 300 m of the water column (or full water column if depth was less than 300 m) at 23 stations in the Barents Sea during cruise JR16006. Sample water was collected from CTD niskin bottles directly from the nozzle, but ensuring that there was no contact between the carboy and niskin nozzle, into acid cleaned 10 L carboys that were rinsed 3 times with sample prior to collection. Carboys were wrapped in black plastic and kept dark prior to filtration. Samples were gently vacuum filtered within 4 h of collection through combusted GF/Fs (4 h, 450 °C, Whatman, 25 mm, nominal pore size 0.7 µm) until a distinct colour was achieved. The volume filtered was recorded to allow for PON and POC concentrations to be calculated in µg/L. Filters were placed in 50 mm petri-dishes lined with combusted foil (4 h, 450 °C) and stored at -80 °C until analysis.
Analytical methodology
Prior to analysis, the filters were freeze-dried. Additionally, samples for d13C-PC and POC were de-carbonated using an overnight acid-fuming protocol. Filters were then wrapped in foil cones (OEA Laboratories) and pelletised. d15N-PN and d13C-PC were determined by EA-IRMS using a Costech Instruments Elemental Analyser coupled to Thermo Scientific Delta V Advantage mass spectrometer fitted with Conflo IV gas handling system. The instrumentation was operated using ISODAT 3.0 isotope ratio MS software. L-glutamic acid standards USGS 40 and USGS 41a (US Geological Survey, Reston Stable Isotope Laboratory) were run alongside the samples and were used both for data processing and to assess the performance of the instrumentation. An internal standard consisting of freeze-dried, finely powdered prawn was also used as a further 'check standard'. A 10-point calibration using standard USGS 40 was measured to provide the linear regression equation which was used to derive PON and POC concentrations from the respective peak areas. µg/L concentrations were then then calculated using concentration obtained from the whole filter and volume of seawater filtered. The detection limit for PON was 10 µg.
BODC Data Processing Procedures
Data received were loaded into the BODC database using established BODC data banking procedures. A parameter mapping table is provided below:
| Originator's Variable | Originator's Units | BODC Parameter Code | BODC Unit | Comments |
|---|---|---|---|---|
| d15N-PN | per mil | D15NMTP1 | ppt | - |
| Vol filtered | ml | VOLWBSMP | m^3 | /1e6 |
| PON | ug/l | NTOTCAP1 | umol/l | /14.00672 |
| POC | ug/l | CORGCAP1 | umol/l | /12.01078 |
| d13C-PC | null | D13CMOP1 | ppt | - |
Project Information
Changing Arctic Ocean: Implications for marine biology and biogeochemistry
Changing Arctic Ocean (CAO) is a £16 million, five year (2017-2022) research programme initially funded by the Natural Environment Research Council (NERC). The aim of the CAO programme is to understand how change in the physical environment (ice and ocean) will affect the large-scale ecosystem structure and biogeochemical functioning of the Arctic Ocean, the potential major impacts and provide projections for future ecosystem services. In July 2018, additional projects were added to the programme that were jointly funded by NERC and the German Federal Ministry of Education and Research.
Background
The Arctic Ocean is responding to global climate change in ways that are not yet fully understood and in some cases, not yet identified. The impacts of change in the Arctic are global in range and international in importance. To achieve the aim, the programme has two key research challenges:
- To develop quantified understanding of the structure and functioning of Arctic ecosystems.
- To understand the sensitivity of Arctic ecosystem structure, functioning and services to multiple stressors and the development of projections of the impacts of change.
The decision to fund the CAO project was both scientific and political and is the second largest research programme funded by NERC.
The programme involves 33 organisations, the majority of which are research institutions in the UK and Germany, and over 170 scientists. The programme consists of four large projects with an additional 12 research projects added in July 2018.
Further information can be found on the Changing Arctic Ocean website.
Participants
There are 33 organisations involved in the Changing Arctic Ocean project, these are:
- Alfred Wegener Institut (AWI)
- Bangor University
- British Antarctic Survey (BAS)
- Centre for Environment, Fisheries and Aquaculture Science (CEFAS)
- Durham University
- GEOMAR
- Helmholtz-Zentrum Geesthacht Centre for Materials and Coastal Research
- Lancaster University
- Marine Biological Association (MBA)
- Max Planck Institute for the Science of Human History
- National Oceanography Centre (NOC)
- Newcastle University
- Northumbria University
- Ocean Atmosphere Systems GmbH
- Plymouth Marine Laboratory (PML)
- Scottish Association for Marine Science (SAMS)
- Scottish Universities Environmental Research Centre (SUERC)
- Université Libre de Bruxelles
- University College London (UCL)
- University of Bristol
- University of East Anglia (UEA)
- University of Edinburgh
- University of Glasgow
- University of Huddersfield
- University of Leeds
- University of Liverpool
- University of Manchester
- University of Oldenburg
- University of Oxford
- University of Southampton
- University of St Andrews
- University of Stirling
- University of Strathclyde
In addition to the core organisation, there are a number of international collaborators.
Research Details
The four large projects funded by NERC are:
- Arctic Productivity in the seasonal Ice Zone (Arctic PRIZE)
- Can we detect changes in Arctic ecosystems? (ARISE)
- The Changing Arctic Ocean Seafloor (ChAOS) - How changing sea ice conditions impact biological communities, biogeochemical processes and ecosystems
- Mechanistic understanding of the role of diatoms in the success of the Arctic Calanus complex and implications for a warmer Arctic (DIAPOD)
The additional 12 projects added in July 2018 funded jointly by NERC and the German Federal Ministry of Education and Research are:
- Advective Pathways of nutrients and key Ecological substances in the Arctic (APEAR)
- How will changing freshwater export and terrestrial permafrost thaw influence the Arctic Ocean? (CACOON)
- Chronobiology of changing Arctic Sea Ecosystems (CHASE)
- Potential benefits and risks of borealisation for fish stocks and ecosystems in a changing Arctic Ocean (Coldfish)
- Diatom Autecological Responses with Changes To Ice Cover (Diatom-ARCTIC)
- Ecosystem functions controlled by sea ice and light in a changing Arctic (Eco-Light)
- Effects of ice stressors and pollutants on the Arctic marine cryosphere (EISPAC)
- Linking Oceanography and Multi-specific, spatially-Variable Interactions of seabirds and their prey in the Arctic (LOMVIA)
- Understanding the links between pelagic microbial ecosystems and organic matter cycling in the changing Arctic (Micro-ARC)
- Microbes to Megafauna Modelling of Arctic Seas (MiMeMo)
- Primary productivity driven by escalating Arctic nutrient fluxes? (PEANUTS)
- Pathways and emissions of climate-relevant trace gases in a changing Arctic Ocean (PETRA)
Fieldwork and Data Collection
The programme consists of seven core cruises that survey areas in the Barents Sea and the Fram Strait on board the NERC research vessel RRS James Clark Ross. Measurements will include temperature, salinity, dissolved oxygen, dissolved inorganic carbon, total alkalinity, inorganic nutrients, oxygen and carbon isotopes and underway meteorological and surface ocean observations. In addition to ship based cruise datasets gliders, moorings and animal tags are part of the fieldwork. Further data are collected from model runs.
Data Activity or Cruise Information
Data Activity
| Start Date (yyyy-mm-dd) | 2017-07-15 |
| End Date (yyyy-mm-dd) | 2017-07-15 |
| Organization Undertaking Activity | National Oceanography Centre, Liverpool |
| Country of Organization | United Kingdom |
| Originator's Data Activity Identifier | JR16006_CTD_CTD016 |
| Platform Category | lowered unmanned submersible |
BODC Sample Metadata Report for JR16006_CTD_CTD016
| Sample reference number | Nominal collection volume(l) | Bottle rosette position | Bottle firing sequence number | Minimum pressure sampled (dbar) | Maximum pressure sampled (dbar) | Depth of sampling point (m) | Bottle type | Sample quality flag | Bottle reference | Comments |
|---|---|---|---|---|---|---|---|---|---|---|
| 1257827 | 20.00 | 1 | 1 | 129.60 | Niskin bottle | No problem reported | ||||
| 1257830 | 20.00 | 2 | 2 | 129.50 | Niskin bottle | No problem reported | ||||
| 1257833 | 20.00 | 3 | 3 | 100.70 | Niskin bottle | No problem reported | ||||
| 1257836 | 20.00 | 4 | 4 | 75.60 | Niskin bottle | No problem reported | ||||
| 1257839 | 20.00 | 5 | 5 | 62.70 | Niskin bottle | No problem reported | ||||
| 1257842 | 20.00 | 6 | 6 | 62.70 | Niskin bottle | No problem reported | ||||
| 1257845 | 20.00 | 7 | 7 | 50.70 | Niskin bottle | No problem reported | ||||
| 1257848 | 20.00 | 8 | 8 | 50.70 | Niskin bottle | No problem reported | ||||
| 1257851 | 20.00 | 9 | 9 | 37.70 | Niskin bottle | No problem reported | ||||
| 1257854 | 20.00 | 10 | 10 | 37.70 | Niskin bottle | No problem reported | ||||
| 1257857 | 20.00 | 11 | 11 | 30.80 | Niskin bottle | No problem reported | ||||
| 1257860 | 20.00 | 12 | 12 | 30.80 | Niskin bottle | No problem reported | ||||
| 1257863 | 20.00 | 13 | 13 | 25.60 | Niskin bottle | No problem reported | ||||
| 1257866 | 20.00 | 14 | 14 | 25.60 | Niskin bottle | No problem reported | ||||
| 1257869 | 20.00 | 15 | 15 | 15.70 | Niskin bottle | No problem reported | ||||
| 1257872 | 20.00 | 16 | 16 | 15.70 | Niskin bottle | No problem reported | ||||
| 1257875 | 20.00 | 17 | 17 | 15.70 | Niskin bottle | No problem reported | ||||
| 1257878 | 20.00 | 18 | 18 | 12.80 | Niskin bottle | No problem reported | ||||
| 1257881 | 20.00 | 19 | 19 | 10.70 | Niskin bottle | No problem reported | ||||
| 1257884 | 20.00 | 20 | 20 | 10.70 | Niskin bottle | No problem reported | ||||
| 1257887 | 20.00 | 21 | 21 | 6.70 | Niskin bottle | No problem reported | ||||
| 1257890 | 20.00 | 22 | 22 | 3.80 | Niskin bottle | No problem reported | ||||
| 1257893 | 20.00 | 23 | 23 | 3.60 | Niskin bottle | No problem reported |
Please note:the supplied parameters may not have been sampled from all the bottle firings described in the table above. Cross-match the Sample Reference Number above against the SAMPRFNM value in the data file to identify the relevant metadata.
Related Data Activity activities are detailed in Appendix 1
Cruise
| Cruise Name | JR16006 |
| Departure Date | 2017-06-30 |
| Arrival Date | 2017-08-15 |
| Principal Scientist(s) | Jo Hopkins (National Oceanography Centre, Liverpool) |
| Ship | RRS James Clark Ross |
Complete Cruise Metadata Report is available here
Fixed Station Information
Fixed Station Information
| Station Name | CAO-B12 |
| Category | Offshore location |
| Latitude | 75° 30.00' N |
| Longitude | 26° 0.00' E |
| Water depth below MSL | 139.0 m |
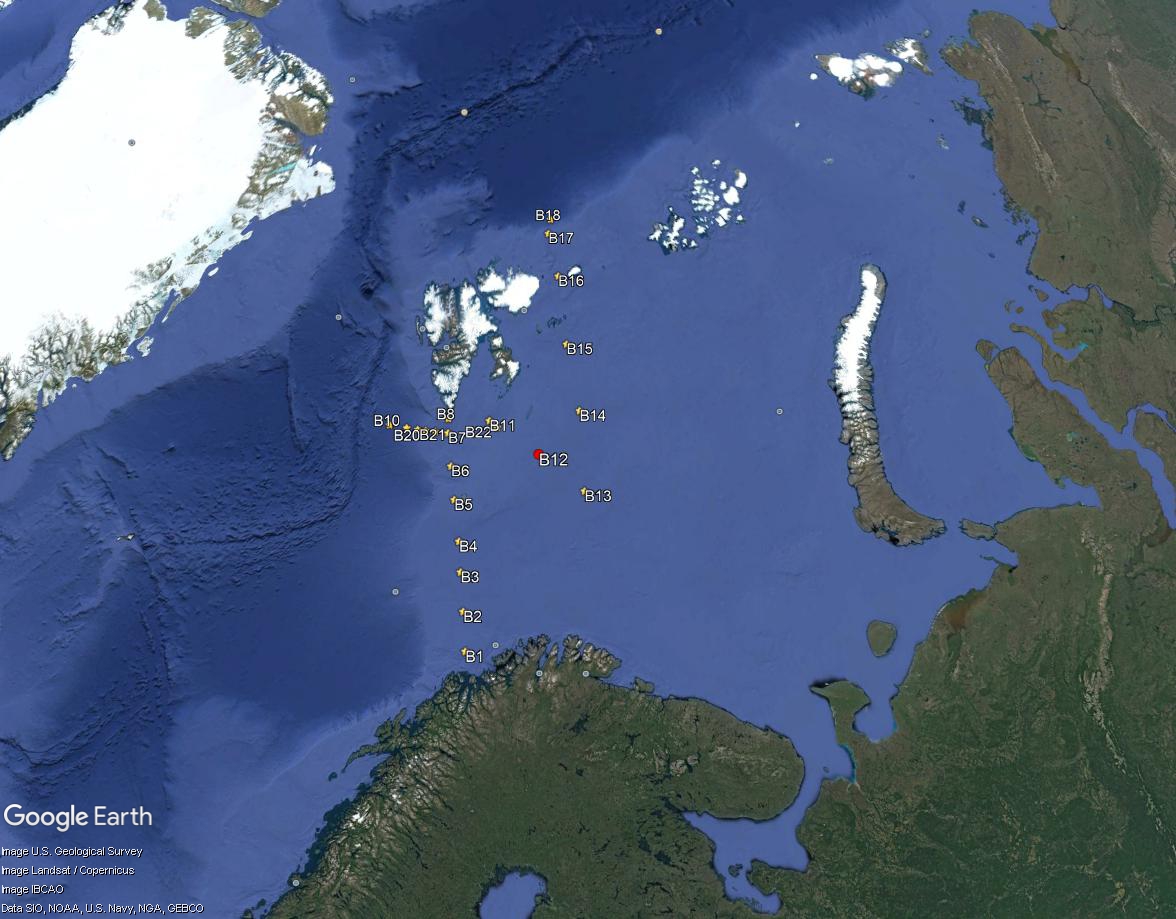
Changing Arctic Ocean Fixed Station B12
This station is one of several sites sampled on the Barents Sea as part of the Changing Arctic Ocean programme. The station has a mean water depth 139 m at the following co-ordinates:
| Latitude | Longitude |
|---|---|
| 75.5° N | 26° E |
The position of this station relative to the other Changing Arctic Ocean sites can be seen from the figure below (in red).
Sampling History
| JR16006 | |
|---|---|
| CTD casts | 2 |
| Shallow Underwater Camera System (SUCS) | 1 |
| Stand Alone Pump Systems (SAPS) | 2 |
| Zooplankton net hauls | 2 |
Related Fixed Station activities are detailed in Appendix 2
BODC Quality Control Flags
The following single character qualifying flags may be associated with one or more individual parameters with a data cycle:
| Flag | Description |
|---|---|
| Blank | Unqualified |
| < | Below detection limit |
| > | In excess of quoted value |
| A | Taxonomic flag for affinis (aff.) |
| B | Beginning of CTD Down/Up Cast |
| C | Taxonomic flag for confer (cf.) |
| D | Thermometric depth |
| E | End of CTD Down/Up Cast |
| G | Non-taxonomic biological characteristic uncertainty |
| H | Extrapolated value |
| I | Taxonomic flag for single species (sp.) |
| K | Improbable value - unknown quality control source |
| L | Improbable value - originator's quality control |
| M | Improbable value - BODC quality control |
| N | Null value |
| O | Improbable value - user quality control |
| P | Trace/calm |
| Q | Indeterminate |
| R | Replacement value |
| S | Estimated value |
| T | Interpolated value |
| U | Uncalibrated |
| W | Control value |
| X | Excessive difference |
SeaDataNet Quality Control Flags
The following single character qualifying flags may be associated with one or more individual parameters with a data cycle:
| Flag | Description |
|---|---|
| 0 | no quality control |
| 1 | good value |
| 2 | probably good value |
| 3 | probably bad value |
| 4 | bad value |
| 5 | changed value |
| 6 | value below detection |
| 7 | value in excess |
| 8 | interpolated value |
| 9 | missing value |
| A | value phenomenon uncertain |
| B | nominal value |
| Q | value below limit of quantification |
Appendix 1: JR16006_CTD_CTD016
Related series for this Data Activity are presented in the table below. Further information can be found by following the appropriate links.
If you are interested in these series, please be aware we offer a multiple file download service. Should your credentials be insufficient for automatic download, the service also offers a referral to our Enquiries Officer who may be able to negotiate access.
| Series Identifier | Data Category | Start date/time | Start position | Cruise |
|---|---|---|---|---|
| 2012924 | Water sample data | 2017-07-15 07:16:30 | 75.50024 N, 26.00177 E | RRS James Clark Ross JR16006 |
| 2043020 | Water sample data | 2017-07-15 07:16:30 | 75.50024 N, 26.00177 E | RRS James Clark Ross JR16006 |
| 2052164 | Water sample data | 2017-07-15 07:16:30 | 75.50024 N, 26.00177 E | RRS James Clark Ross JR16006 |
| 2056208 | Water sample data | 2017-07-15 07:16:30 | 75.50024 N, 26.00177 E | RRS James Clark Ross JR16006 |
| 1980699 | Water sample data | 2017-07-15 07:17:00 | 75.50024 N, 26.00177 E | RRS James Clark Ross JR16006 |
| 1980884 | Water sample data | 2017-07-15 07:17:00 | 75.50024 N, 26.00177 E | RRS James Clark Ross JR16006 |
| 1981654 | Water sample data | 2017-07-15 07:17:00 | 75.50024 N, 26.00177 E | RRS James Clark Ross JR16006 |
Appendix 2: CAO-B12
Related series for this Fixed Station are presented in the table below. Further information can be found by following the appropriate links.
If you are interested in these series, please be aware we offer a multiple file download service. Should your credentials be insufficient for automatic download, the service also offers a referral to our Enquiries Officer who may be able to negotiate access.
| Series Identifier | Data Category | Start date/time | Start position | Cruise |
|---|---|---|---|---|
| 1837719 | CTD or STD cast | 2017-07-15 07:03:00 | 75.5002 N, 26.0017 E | RRS James Clark Ross JR16006 |
| 2012924 | Water sample data | 2017-07-15 07:16:30 | 75.50024 N, 26.00177 E | RRS James Clark Ross JR16006 |
| 2043020 | Water sample data | 2017-07-15 07:16:30 | 75.50024 N, 26.00177 E | RRS James Clark Ross JR16006 |
| 2052164 | Water sample data | 2017-07-15 07:16:30 | 75.50024 N, 26.00177 E | RRS James Clark Ross JR16006 |
| 2056208 | Water sample data | 2017-07-15 07:16:30 | 75.50024 N, 26.00177 E | RRS James Clark Ross JR16006 |
| 1980699 | Water sample data | 2017-07-15 07:17:00 | 75.50024 N, 26.00177 E | RRS James Clark Ross JR16006 |
| 1980884 | Water sample data | 2017-07-15 07:17:00 | 75.50024 N, 26.00177 E | RRS James Clark Ross JR16006 |
| 1981654 | Water sample data | 2017-07-15 07:17:00 | 75.50024 N, 26.00177 E | RRS James Clark Ross JR16006 |
| 1838016 | CTD or STD cast | 2017-08-01 23:07:00 | 75.4999 N, 25.9991 E | RRS James Clark Ross JR16006 |
| 2043321 | Water sample data | 2017-08-01 23:14:30 | 75.49987 N, 25.99929 E | RRS James Clark Ross JR16006 |
| 1918888 | CTD or STD cast | 2018-07-02 22:22:00 | 75.4999 N, 25.9999 E | RRS James Clark Ross JR17006 |
