Metadata Report for BODC Series Reference Number 2078081
Metadata Summary
Problem Reports
Data Access Policy
Narrative Documents
Project Information
Data Activity or Cruise Information
Fixed Station Information
BODC Quality Flags
SeaDataNet Quality Flags
Metadata Summary
Data Description |
|||||||||||||||||||||||||||||||||||||||||||||||||||||||||
|
|||||||||||||||||||||||||||||||||||||||||||||||||||||||||
Data Identifiers |
|||||||||||||||||||||||||||||||||||||||||||||||||||||||||
|
|||||||||||||||||||||||||||||||||||||||||||||||||||||||||
Time Co-ordinates(UT) |
|||||||||||||||||||||||||||||||||||||||||||||||||||||||||
|
|||||||||||||||||||||||||||||||||||||||||||||||||||||||||
Spatial Co-ordinates | |||||||||||||||||||||||||||||||||||||||||||||||||||||||||
|
|||||||||||||||||||||||||||||||||||||||||||||||||||||||||
Parameters |
|||||||||||||||||||||||||||||||||||||||||||||||||||||||||
|
|||||||||||||||||||||||||||||||||||||||||||||||||||||||||
Definition of BOTTFLAG | |||||||||||||||||||||||||||||||||||||||||||||||||||||||||
| BOTTFLAG | Definition |
|---|---|
| 0 | The sampling event occurred without any incident being reported to BODC. |
| 1 | The filter in an in-situ sampling pump physically ruptured during sample resulting in an unquantifiable loss of sampled material. |
| 2 | Analytical evidence (e.g. surface water salinity measured on a sample collected at depth) indicates that the water sample has been contaminated by water from depths other than the depths of sampling. |
| 3 | The feedback indicator on the deck unit reported that the bottle closure command had failed. General Oceanics deck units used on NERC vessels in the 80s and 90s were renowned for reporting misfires when the bottle had been closed. This flag is also suitable for when a trigger command is mistakenly sent to a bottle that has previously been fired. |
| 4 | During the sampling deployment the bottle was fired in an order other than incrementing rosette position. Indicative of the potential for errors in the assignment of bottle firing depth, especially with General Oceanics rosettes. |
| 5 | Water was reported to be escaping from the bottle as the rosette was being recovered. |
| 6 | The bottle seals were observed to be incorrectly seated and the bottle was only part full of water on recovery. |
| 7 | Either the bottle was found to contain no sample on recovery or there was no bottle fitted to the rosette position fired (but SBE35 record may exist). |
| 8 | There is reason to doubt the accuracy of the sampling depth associated with the sample. |
| 9 | The bottle air vent had not been closed prior to deployment giving rise to a risk of sample contamination through leakage. |
Definition of Rank |
|
|
Problem Reports
No Problem Report Found in the Database
Data Access Policy
Open Data
These data have no specific confidentiality restrictions for users. However, users must acknowledge data sources as it is not ethical to publish data without proper attribution. Any publication or other output resulting from usage of the data should include an acknowledgment.
If the Information Provider does not provide a specific attribution statement, or if you are using Information from several Information Providers and multiple attributions are not practical in your product or application, you may consider using the following:
"Contains public sector information licensed under the Open Government Licence v1.0."
Narrative Documents
Lachat QuikChem 8500 flow injection analyzer (FIA) and Ion Chromatography (IC) system
The Lachat QuikChem 8500 can operate FIA and IC simultaneously and independently on the same instrument platform. FIA and IC are complementary analytical techniques that are commonly used in the same laboratory.
Instrument includes - sampler, dilutor, sampling pump, electronics unit, and data station.
Flow injection analysis is ideally suited for processing relatively large numbers of samples. Ion Chromatography adds the power to profile samples for a class of ionic species.
FIA Productivity Characteristics
- Fast Startup - ~5 minutes
- Rapid Analysis - 20 to 60 seconds is typical
- High Sample Throughput - 60 to 120 samples per hour is typical
- Broad Working Range - Parts per trillion to percents
- Complete Baseline Resolution - No carryover between samples
- Wide Dynamic Range - 2 to 3 decades is typical
- Fast Shutdown - ~5 minutes
- Rapid Method Changeover - ~10 minutes
New FIA Features
- Run up to 5 channels for high productivity analysis or dedicated operation.
- New 2-cm flow cell methods allow more signal for detection at lower levels.
- Run Omnion 3.0 software on Windows XP, Vista, or Windows 7 operating systems.
- Interface Omnion software in multiple languages - including Spanish, German, French, Portuguese, and Italian.
For more information about this model see the manufactures data sheet - Lachat QuikChem 8500.
SPX Bran+Luebbe Autoanalyser 3
The instrument uses continuous flow analysis (CFA) with a continuous stream of material divided by air bubbles into discrete segments in which chemical reactions occur. The continuous stream of liquid samples and reagents are combined and transported in tubing and mixing coils. The tubing passes the samples from one apparatus to the other with each apparatus performing different functions, such as distillation, dialysis, extraction, ion exchange, heating, incubation, and subsequent recording of a signal.
An essential principle of the system is the introduction of air bubbles. The air bubbles segment each sample into discrete packets and act as a barrier between packets to prevent cross contamination as they travel down the length of the tubing. The air bubbles also assist mixing by creating turbulent flow (bolus flow), and provide operators with a quick and easy check of the flow characteristics of the liquid.
Samples and standards are treated in an exactly identical manner as they travel the length of the tubing, eliminating the necessity of a steady state signal, however, since the presence of bubbles create an almost square wave profile, bringing the system to steady state does not significantly decrease throughput and is desirable in that steady state signals (chemical equilibrium) are more accurate and reproducible.
The autoanalyzer can consist of different modules including a sampler, pump, mixing coils, optional sample treatments (dialysis, distillation, heating, etc), a detector, and data generator. Most continuous flow analyzers depend on color reactions using a flow through colorimeter, however other methods have been developed that use ISE, flame photometry, ICAP, fluorometry, and so forth.
More details can be found in the manufacturer's introduction to autoanalysers andinstrument description.
Niskin Bottle
The Niskin bottle is a device used by oceanographers to collect subsurface seawater samples. It is a plastic bottle with caps and rubber seals at each end and is deployed with the caps held open, allowing free-flushing of the bottle as it moves through the water column.
Standard Niskin
The standard version of the bottle includes a plastic-coated metal spring or elastic cord running through the interior of the bottle that joins the two caps, and the caps are held open against the spring by plastic lanyards. When the bottle reaches the desired depth the lanyards are released by a pressure-actuated switch, command signal or messenger weight and the caps are forced shut and sealed, trapping the seawater sample.
Lever Action Niskin
The Lever Action Niskin Bottle differs from the standard version, in that the caps are held open during deployment by externally mounted stainless steel springs rather than an internal spring or cord. Lever Action Niskins are recommended for applications where a completely clear sample chamber is critical or for use in deep cold water.
Clean Sampling
A modified version of the standard Niskin bottle has been developed for clean sampling. This is teflon-coated and uses a latex cord to close the caps rather than a metal spring. The clean version of the Levered Action Niskin bottle is also teflon-coated and uses epoxy covered springs in place of the stainless steel springs. These bottles are specifically designed to minimise metal contamination when sampling trace metals.
Deployment
Bottles may be deployed singly clamped to a wire or in groups of up to 48 on a rosette. Standard bottles and Lever Action bottles have a capacity between 1.7 and 30 L. Reversing thermometers may be attached to a spring-loaded disk that rotates through 180° on bottle closure.
JR17005 dissolved nutrient samples from CTD bottles
Originator's Protocol for Data Acquisition and Analysis
Dissolved nutrient samples of ammonium, phosphate, silicate, nitrate+nitrite and nitrite were collected during cruise JR17005 for the Changing Arctic Ocean programme. Ammonium and silicate samples were collected in acid cleaned PE 50 mL centrifuge vials, that were rinsed three times with sample prior to collection. Sample water was collected from CTD niskin bottles using a short length of silicon rubber tube with a filter end of 200 um nylon mesh to remove larger plankton material. Samples were run within 24 hours of collection and were allowed to rise to room temperature in the dark before analysis. For phosphate, nitrate and nitrite measurements, samples were collected from the CTD Niskin bottles in 100 mL acid cleaned HDPE bottles using an AcroPak filter capsule (0.45 um pore size) and rinsed three times prior to collection. Samples were frozen at -20?C immediately after collection.
Ammonium and silicate measurements were measured on board using a Lachat Quik Chem 8500 Flow injection analyser using the manufacturers recommended methods for brackish or seawater: Ammonium 31-107-06-1-B and Silicate 31-114-27-1-A. Samples were run in triplicate in batch sizes of between 10 and 25 samples with a standard calibration range made from stock nutrient standards diluted with OSIL low nutrient seawater using grade A volumetric flasks. Stock nutrient standard solutions were made prior to the cruise from pre-dried pure grade reagents and made up to concentrations of around 10 mmol L-1. A mid range standard was run during and at the end of the analysis batch and a linear incremental drift correction was made to each sample result. Analytical accuracy and precision performance were conducted on every sample batch by triplicate analysis of KANSO certified reference seawater (lot CD) nutrient solutions at the start of the analysis. Phosphate, nitrate+nitrite and nitrite measurements were conducted at the University of Liverpool using a Bran and Luebbe, QuAAtro 5-channel continuous flow analyser. Manufacturer recommended methods for detection in seawater were used: Phosphate Q-064-05 Rev. 2, Nitrate + Nitrite using a Cd coil Q-068-05 Rev. 2, Nitrite Q-070-05 Rev. 2. Samples were defrosted overnight in the dark and allowed to come to room temperature prior to analysis. Samples were run in triplicate in batch sizes of between 20 and 30 with an initial standard calibration range made from stock nutrient standards diluted with artificial seawater made up as prescribed in the manufacturer methods. Primary nutrient standard stocks were made up to concentrations of 10 mmol L-1 from analytical/pure grade reagents and working standards were freshly made daily. Kanso certified reference material (CRM) for nutrients in seawater (Kanso Co Ltd, Lot CI) were used during every run. CRMs were run in triplicate every five samples, including the start and end.
Data quality performance for ammonium and silicate was conducted by analysing Kanso CRM Lot CD in triplicate at the start of each batch analysis. Data quality performance for phosphate, nitrate+nitrite and nitrite were conducted on each sample batch analysis using KANSO CRM Lot CI.
Instrumentation Description
Lachat Quik Chem 8500 Flow Injection Analyser
Bran and Luebbe, QuAAtro 5-channel continuous flow analyser
BODC Data Processing Procedures
Data were submitted in an .xlsx spreadsheet containing dissolved nutrient sample measurements of ammonium, phosphate, silicate, nitrate+nitrite and nitrite data with their associated standard deviations. Additional metadata such as station, position, date, time, CTD cast number, CTD bottle number and depth (m) were also included in the file.
The data were reformatted and assigned BODC parameter codes. Quality control checks were made and BODC applied flags were applicable. The data were then loaded into the BODC database using established BODC data banking procedures.
A parameter mapping table is provided below:
| Originator's Parameter | Unit | BODC Parameter Code | BODC Unit | Comments |
|---|---|---|---|---|
| Ammonium | umol L-1 | AMONAAD1 | umol L-1 | Equivalent units |
| Error | umol L-1 | SDAMAAD1 | umol L-1 | Equivalent units |
| Silicate | umol L-1 | SLCAAAD1 | umol L-1 | Equivalent units |
| Error | umol L-1 | SDSLAAD1 | umol L-1 | Equivalent units |
| Nitrate+nitrite | umol L-1 | NTRZAAD1 | umol L-1 | Equivalent units |
| Error | umol L-1 | SDNZAAD1 | umol L-1 | Equivalent units |
| Phosphate | umol L-1 | PHOSAAD1 | umol L-1 | Equivalent units |
| Error | umol L-1 | SDPHAAD1 | umol L-1 | Equivalent units |
| Nitrite | umol L-1 | NTRIAAD1 | umol L-1 | Equivalent units |
| Error | umol L-1 | SDNIAAD1 | umol L-1 | Equivalent units |
The data were also submitted in umol kg L-1 and data in these units are available on request.
Data Quality Report
BODC performed quality control checks on the data. Any data values which the orignator highlighted as being below the detection limit of the instrument were applied a '<' flag.
Project Information
Changing Arctic Ocean: Implications for marine biology and biogeochemistry
Changing Arctic Ocean (CAO) is a £16 million, five year (2017-2022) research programme initially funded by the Natural Environment Research Council (NERC). The aim of the CAO programme is to understand how change in the physical environment (ice and ocean) will affect the large-scale ecosystem structure and biogeochemical functioning of the Arctic Ocean, the potential major impacts and provide projections for future ecosystem services. In July 2018, additional projects were added to the programme that were jointly funded by NERC and the German Federal Ministry of Education and Research.
Background
The Arctic Ocean is responding to global climate change in ways that are not yet fully understood and in some cases, not yet identified. The impacts of change in the Arctic are global in range and international in importance. To achieve the aim, the programme has two key research challenges:
- To develop quantified understanding of the structure and functioning of Arctic ecosystems.
- To understand the sensitivity of Arctic ecosystem structure, functioning and services to multiple stressors and the development of projections of the impacts of change.
The decision to fund the CAO project was both scientific and political and is the second largest research programme funded by NERC.
The programme involves 33 organisations, the majority of which are research institutions in the UK and Germany, and over 170 scientists. The programme consists of four large projects with an additional 12 research projects added in July 2018.
Further information can be found on the Changing Arctic Ocean website.
Participants
There are 33 organisations involved in the Changing Arctic Ocean project, these are:
- Alfred Wegener Institut (AWI)
- Bangor University
- British Antarctic Survey (BAS)
- Centre for Environment, Fisheries and Aquaculture Science (CEFAS)
- Durham University
- GEOMAR
- Helmholtz-Zentrum Geesthacht Centre for Materials and Coastal Research
- Lancaster University
- Marine Biological Association (MBA)
- Max Planck Institute for the Science of Human History
- National Oceanography Centre (NOC)
- Newcastle University
- Northumbria University
- Ocean Atmosphere Systems GmbH
- Plymouth Marine Laboratory (PML)
- Scottish Association for Marine Science (SAMS)
- Scottish Universities Environmental Research Centre (SUERC)
- Université Libre de Bruxelles
- University College London (UCL)
- University of Bristol
- University of East Anglia (UEA)
- University of Edinburgh
- University of Glasgow
- University of Huddersfield
- University of Leeds
- University of Liverpool
- University of Manchester
- University of Oldenburg
- University of Oxford
- University of Southampton
- University of St Andrews
- University of Stirling
- University of Strathclyde
In addition to the core organisation, there are a number of international collaborators.
Research Details
The four large projects funded by NERC are:
- Arctic Productivity in the seasonal Ice Zone (Arctic PRIZE)
- Can we detect changes in Arctic ecosystems? (ARISE)
- The Changing Arctic Ocean Seafloor (ChAOS) - How changing sea ice conditions impact biological communities, biogeochemical processes and ecosystems
- Mechanistic understanding of the role of diatoms in the success of the Arctic Calanus complex and implications for a warmer Arctic (DIAPOD)
The additional 12 projects added in July 2018 funded jointly by NERC and the German Federal Ministry of Education and Research are:
- Advective Pathways of nutrients and key Ecological substances in the Arctic (APEAR)
- How will changing freshwater export and terrestrial permafrost thaw influence the Arctic Ocean? (CACOON)
- Chronobiology of changing Arctic Sea Ecosystems (CHASE)
- Potential benefits and risks of borealisation for fish stocks and ecosystems in a changing Arctic Ocean (Coldfish)
- Diatom Autecological Responses with Changes To Ice Cover (Diatom-ARCTIC)
- Ecosystem functions controlled by sea ice and light in a changing Arctic (Eco-Light)
- Effects of ice stressors and pollutants on the Arctic marine cryosphere (EISPAC)
- Linking Oceanography and Multi-specific, spatially-Variable Interactions of seabirds and their prey in the Arctic (LOMVIA)
- Understanding the links between pelagic microbial ecosystems and organic matter cycling in the changing Arctic (Micro-ARC)
- Microbes to Megafauna Modelling of Arctic Seas (MiMeMo)
- Primary productivity driven by escalating Arctic nutrient fluxes? (PEANUTS)
- Pathways and emissions of climate-relevant trace gases in a changing Arctic Ocean (PETRA)
Fieldwork and Data Collection
The programme consists of seven core cruises that survey areas in the Barents Sea and the Fram Strait on board the NERC research vessel RRS James Clark Ross. Measurements will include temperature, salinity, dissolved oxygen, dissolved inorganic carbon, total alkalinity, inorganic nutrients, oxygen and carbon isotopes and underway meteorological and surface ocean observations. In addition to ship based cruise datasets gliders, moorings and animal tags are part of the fieldwork. Further data are collected from model runs.
Data Activity or Cruise Information
Data Activity
| Start Date (yyyy-mm-dd) | 2018-05-18 |
| End Date (yyyy-mm-dd) | 2018-05-18 |
| Organization Undertaking Activity | University of Stirling, Institute of Aquaculture |
| Country of Organization | United Kingdom |
| Originator's Data Activity Identifier | JR17005_CTD_CTD012 |
| Platform Category | lowered unmanned submersible |
BODC Sample Metadata Report for JR17005_CTD_CTD012
| Sample reference number | Nominal collection volume(l) | Bottle rosette position | Bottle firing sequence number | Minimum pressure sampled (dbar) | Maximum pressure sampled (dbar) | Depth of sampling point (m) | Bottle type | Sample quality flag | Bottle reference | Comments |
|---|---|---|---|---|---|---|---|---|---|---|
| 1359089 | 20.00 | 1 | 1211.90 | Niskin bottle | No problem reported | |||||
| 1359092 | 20.00 | 2 | 1100.70 | Niskin bottle | No problem reported | |||||
| 1359095 | 20.00 | 3 | 900.60 | Niskin bottle | No problem reported | |||||
| 1359098 | 20.00 | 4 | 751.50 | Niskin bottle | No problem reported | |||||
| 1359101 | 20.00 | 5 | 622.30 | Niskin bottle | No problem reported | |||||
| 1359104 | 20.00 | 6 | 531.40 | Niskin bottle | No problem reported | |||||
| 1359107 | 20.00 | 7 | 438.00 | Niskin bottle | No problem reported | |||||
| 1359110 | 20.00 | 8 | 402.40 | Niskin bottle | No problem reported | |||||
| 1359113 | 20.00 | 9 | 252.70 | Niskin bottle | No problem reported | |||||
| 1359116 | 20.00 | 10 | 233.20 | Niskin bottle | No problem reported | |||||
| 1359119 | 20.00 | 11 | 203.50 | Niskin bottle | No problem reported | |||||
| 1359122 | 20.00 | 12 | 202.50 | Niskin bottle | No problem reported | |||||
| 1359125 | 20.00 | 13 | 152.70 | Niskin bottle | No problem reported | |||||
| 1359128 | 20.00 | 14 | 138.60 | Niskin bottle | No problem reported | |||||
| 1359131 | 20.00 | 15 | 103.50 | Niskin bottle | No problem reported | |||||
| 1359134 | 20.00 | 16 | 103.70 | Niskin bottle | No problem reported | |||||
| 1359137 | 20.00 | 17 | 76.40 | Niskin bottle | No problem reported | |||||
| 1359140 | 20.00 | 18 | 76.00 | Niskin bottle | No problem reported | |||||
| 1359143 | 20.00 | 19 | 51.40 | Niskin bottle | No problem reported | |||||
| 1359146 | 20.00 | 20 | 26.60 | Niskin bottle | No problem reported | |||||
| 1359149 | 20.00 | 21 | 17.00 | Niskin bottle | No problem reported | |||||
| 1359152 | 20.00 | 22 | 16.70 | Niskin bottle | No problem reported | |||||
| 1359155 | 20.00 | 23 | 5.80 | Niskin bottle | No problem reported | |||||
| 1359158 | 20.00 | 24 | 5.60 | Niskin bottle | No problem reported |
Please note:the supplied parameters may not have been sampled from all the bottle firings described in the table above. Cross-match the Sample Reference Number above against the SAMPRFNM value in the data file to identify the relevant metadata.
Related Data Activity activities are detailed in Appendix 1
Cruise
| Cruise Name | JR17005 |
| Departure Date | 2018-05-08 |
| Arrival Date | 2018-06-08 |
| Principal Scientist(s) | David Pond (University of Stirling, Institute of Aquaculture) |
| Ship | RRS James Clark Ross |
Complete Cruise Metadata Report is available here
Fixed Station Information
Fixed Station Information
| Station Name | CAO NT6 |
| Category | Offshore location |
| Latitude | 76° 6.15' N |
| Longitude | 8° 25.12' W |
| Water depth below MSL | 1256.0 m |
Changing Arctic Ocean Fixed Station NT6
JR17005 cruise was part of the NERC Changing Arctic Ocean inolving ARISE and DIAPOD projects, surveying sections of the Fram Strait at pre-determined locations in the Arctic.
Station NT6 formed part of the N line transect, and was a 24 hour station which involved multiple scientific deployments (see Table 2).
Table 1. Station Summary
| Station | Latitude | Longitude | Water Depth (m) |
|---|---|---|---|
| NT6 | 76.1025 | -8.4187 | 1185 |
Table 2. Sampling History
| Deployments | |
|---|---|
| CTD casts | 1 |
| Bongo | 2 |
| Stand Alone Pump Systems (SAPS) | 0 |
| MOCNESS | 2 |
| Zooplankton Ring Net | 0 |
| Mega Corer | 3 |
| Day Grab | 0 |
The JR17005 cruise track (Figure 1) displays all stations visited during the cruise including fixed stations (super stations) and skinny stations for reference purposes only.
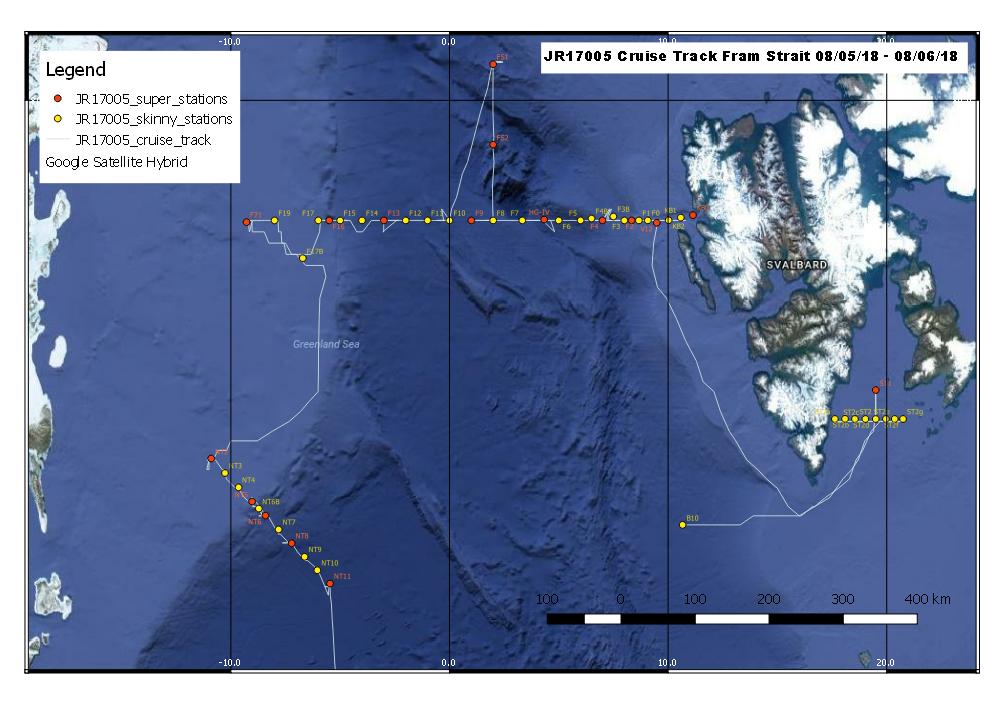
Figure 1. JR17005 Cruise Track
Fixed stations occured at various transects across the survey area, as shown in Figure 2.
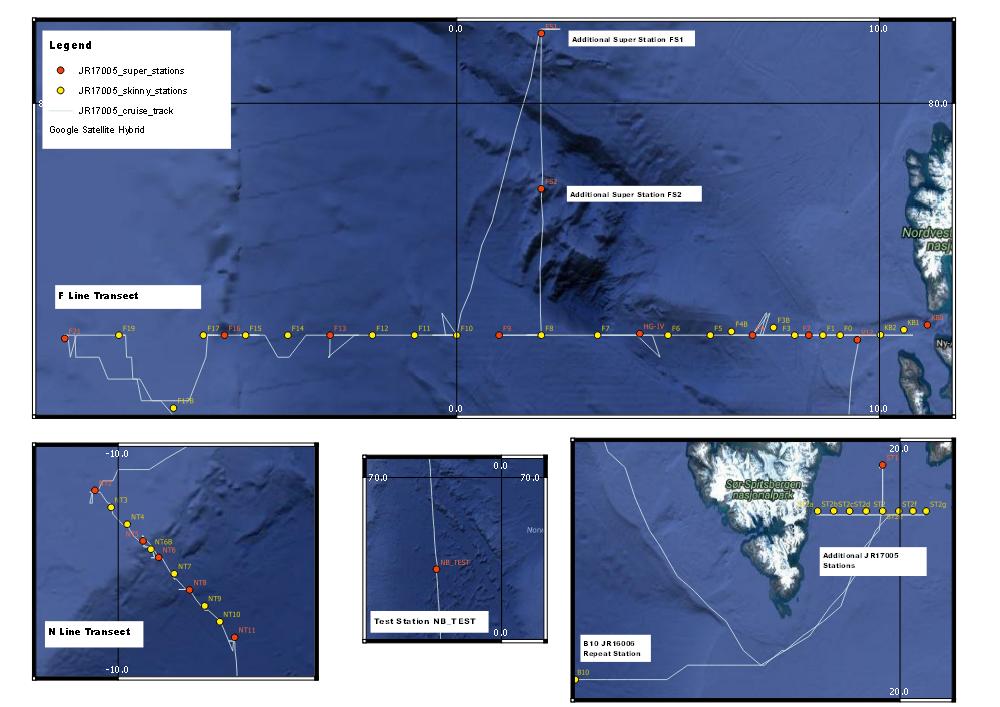
Figure 2. Summary of JR17005 fixed stations (super stations). Skinny stations have been included for reference purposes only.
Related Fixed Station activities are detailed in Appendix 2
BODC Quality Control Flags
The following single character qualifying flags may be associated with one or more individual parameters with a data cycle:
| Flag | Description |
|---|---|
| Blank | Unqualified |
| < | Below detection limit |
| > | In excess of quoted value |
| A | Taxonomic flag for affinis (aff.) |
| B | Beginning of CTD Down/Up Cast |
| C | Taxonomic flag for confer (cf.) |
| D | Thermometric depth |
| E | End of CTD Down/Up Cast |
| G | Non-taxonomic biological characteristic uncertainty |
| H | Extrapolated value |
| I | Taxonomic flag for single species (sp.) |
| K | Improbable value - unknown quality control source |
| L | Improbable value - originator's quality control |
| M | Improbable value - BODC quality control |
| N | Null value |
| O | Improbable value - user quality control |
| P | Trace/calm |
| Q | Indeterminate |
| R | Replacement value |
| S | Estimated value |
| T | Interpolated value |
| U | Uncalibrated |
| W | Control value |
| X | Excessive difference |
SeaDataNet Quality Control Flags
The following single character qualifying flags may be associated with one or more individual parameters with a data cycle:
| Flag | Description |
|---|---|
| 0 | no quality control |
| 1 | good value |
| 2 | probably good value |
| 3 | probably bad value |
| 4 | bad value |
| 5 | changed value |
| 6 | value below detection |
| 7 | value in excess |
| 8 | interpolated value |
| 9 | missing value |
| A | value phenomenon uncertain |
| B | nominal value |
| Q | value below limit of quantification |
Appendix 1: JR17005_CTD_CTD012
Related series for this Data Activity are presented in the table below. Further information can be found by following the appropriate links.
If you are interested in these series, please be aware we offer a multiple file download service. Should your credentials be insufficient for automatic download, the service also offers a referral to our Enquiries Officer who may be able to negotiate access.
| Series Identifier | Data Category | Start date/time | Start position | Cruise |
|---|---|---|---|---|
| 2056651 | Water sample data | 2018-05-18 16:08:30 | 76.10225 N, 8.41915 W | RRS James Clark Ross JR17005 |
| 2056940 | Water sample data | 2018-05-18 16:08:30 | 76.10225 N, 8.41915 W | RRS James Clark Ross JR17005 |
| 2073666 | Water sample data | 2018-05-18 16:08:30 | 76.10225 N, 8.41915 W | RRS James Clark Ross JR17005 |
| 1965027 | Water sample data | 2018-05-18 16:09:00 | 76.10225 N, 8.41915 W | RRS James Clark Ross JR17005 |
| 1980128 | Water sample data | 2018-05-18 16:09:00 | 76.10225 N, 8.41915 W | RRS James Clark Ross JR17005 |
Appendix 2: CAO NT6
Related series for this Fixed Station are presented in the table below. Further information can be found by following the appropriate links.
If you are interested in these series, please be aware we offer a multiple file download service. Should your credentials be insufficient for automatic download, the service also offers a referral to our Enquiries Officer who may be able to negotiate access.
| Series Identifier | Data Category | Start date/time | Start position | Cruise |
|---|---|---|---|---|
| 1844347 | CTD or STD cast | 2018-05-18 15:33:00 | 76.1022 N, 8.4192 W | RRS James Clark Ross JR17005 |
| 2056651 | Water sample data | 2018-05-18 16:08:30 | 76.10225 N, 8.41915 W | RRS James Clark Ross JR17005 |
| 2056940 | Water sample data | 2018-05-18 16:08:30 | 76.10225 N, 8.41915 W | RRS James Clark Ross JR17005 |
| 2073666 | Water sample data | 2018-05-18 16:08:30 | 76.10225 N, 8.41915 W | RRS James Clark Ross JR17005 |
| 1965027 | Water sample data | 2018-05-18 16:09:00 | 76.10225 N, 8.41915 W | RRS James Clark Ross JR17005 |
| 1980128 | Water sample data | 2018-05-18 16:09:00 | 76.10225 N, 8.41915 W | RRS James Clark Ross JR17005 |
