Metadata Report for BODC Series Reference Number 2093495
Metadata Summary
Problem Reports
Data Access Policy
Narrative Documents
Project Information
Data Activity or Cruise Information
Fixed Station Information
BODC Quality Flags
SeaDataNet Quality Flags
Metadata Summary
Data Description |
|||||||||||||||||||||||||
|
|||||||||||||||||||||||||
Data Identifiers |
|||||||||||||||||||||||||
|
|||||||||||||||||||||||||
Time Co-ordinates(UT) |
|||||||||||||||||||||||||
|
|||||||||||||||||||||||||
Spatial Co-ordinates | |||||||||||||||||||||||||
|
|||||||||||||||||||||||||
Parameters |
|||||||||||||||||||||||||
|
|||||||||||||||||||||||||
Definition of BOTTFLAG | |||||||||||||||||||||||||
| BOTTFLAG | Definition |
|---|---|
| 0 | The sampling event occurred without any incident being reported to BODC. |
| 1 | The filter in an in-situ sampling pump physically ruptured during sample resulting in an unquantifiable loss of sampled material. |
| 2 | Analytical evidence (e.g. surface water salinity measured on a sample collected at depth) indicates that the water sample has been contaminated by water from depths other than the depths of sampling. |
| 3 | The feedback indicator on the deck unit reported that the bottle closure command had failed. General Oceanics deck units used on NERC vessels in the 80s and 90s were renowned for reporting misfires when the bottle had been closed. This flag is also suitable for when a trigger command is mistakenly sent to a bottle that has previously been fired. |
| 4 | During the sampling deployment the bottle was fired in an order other than incrementing rosette position. Indicative of the potential for errors in the assignment of bottle firing depth, especially with General Oceanics rosettes. |
| 5 | Water was reported to be escaping from the bottle as the rosette was being recovered. |
| 6 | The bottle seals were observed to be incorrectly seated and the bottle was only part full of water on recovery. |
| 7 | Either the bottle was found to contain no sample on recovery or there was no bottle fitted to the rosette position fired (but SBE35 record may exist). |
| 8 | There is reason to doubt the accuracy of the sampling depth associated with the sample. |
| 9 | The bottle air vent had not been closed prior to deployment giving rise to a risk of sample contamination through leakage. |
Definition of Rank |
|
|
Problem Reports
No Problem Report Found in the Database
Data Access Policy
Open Data
These data have no specific confidentiality restrictions for users. However, users must acknowledge data sources as it is not ethical to publish data without proper attribution. Any publication or other output resulting from usage of the data should include an acknowledgment.
If the Information Provider does not provide a specific attribution statement, or if you are using Information from several Information Providers and multiple attributions are not practical in your product or application, you may consider using the following:
"Contains public sector information licensed under the Open Government Licence v1.0."
Narrative Documents
Niskin Bottle
The Niskin bottle is a device used by oceanographers to collect subsurface seawater samples. It is a plastic bottle with caps and rubber seals at each end and is deployed with the caps held open, allowing free-flushing of the bottle as it moves through the water column.
Standard Niskin
The standard version of the bottle includes a plastic-coated metal spring or elastic cord running through the interior of the bottle that joins the two caps, and the caps are held open against the spring by plastic lanyards. When the bottle reaches the desired depth the lanyards are released by a pressure-actuated switch, command signal or messenger weight and the caps are forced shut and sealed, trapping the seawater sample.
Lever Action Niskin
The Lever Action Niskin Bottle differs from the standard version, in that the caps are held open during deployment by externally mounted stainless steel springs rather than an internal spring or cord. Lever Action Niskins are recommended for applications where a completely clear sample chamber is critical or for use in deep cold water.
Clean Sampling
A modified version of the standard Niskin bottle has been developed for clean sampling. This is teflon-coated and uses a latex cord to close the caps rather than a metal spring. The clean version of the Levered Action Niskin bottle is also teflon-coated and uses epoxy covered springs in place of the stainless steel springs. These bottles are specifically designed to minimise metal contamination when sampling trace metals.
Deployment
Bottles may be deployed singly clamped to a wire or in groups of up to 48 on a rosette. Standard bottles and Lever Action bottles have a capacity between 1.7 and 30 L. Reversing thermometers may be attached to a spring-loaded disk that rotates through 180° on bottle closure.
Dissolved and Particulate Trace Metals for TWEED campaign and RRS Challenger cruises.
Document History
Converted from CDROM documentation.
Content of data series
| AGCNICP2 | Particulate silver content |
| Acid leach then ICP-MS (0.4/0.45 µm pore filtered) | |
| Parts per million | |
| AGXXICP2 | Particulate silver |
| Acid leach then ICP-MS (0.4/0.45 µm pore filtered) | |
| Nanomoles per litre | |
| ALCNICP2 | Particulate aluminium content |
| Acid leach then ICP-MS (0.4/0.45 µm pore filtered) | |
| Per cent | |
| ALXXICP2 | Particulate aluminium |
| Acid leach then ICP-MS (0.4/0.45 µm pore filtered) | |
| Nanomoles per litre | |
| ALXXLGD2 | Dissolved aluminium |
| Lumogallion (0.4/0.45 µm pore filtered) | |
| Nanomoles per litre | |
| BACNICP2 | Particulate barium content |
| Acid leach then ICP-MS (0.4/0.45 µm pore filtered) | |
| Parts per million | |
| BAXXICP2 | Particulate barium |
| Acid leach then ICP-MS (0.4/0.45 µm pore filtered) | |
| Nanomoles per litre | |
| CAXXAAP2 | Particulate calcium |
| Acid leach then atomic absorption (0.4/0.45 µm pore filtered) | |
| Nanomoles per litre | |
| CDCNAAP2 | Particulate cadmium content |
| Acid leach then atomic absorption (0.4/0.45 µm pore filtered) | |
| Parts per million | |
| CDCNICP2 | Particulate cadmium content |
| Acid leach then ICP-MS (0.4/0.45 µm pore filtered) | |
| Parts per million | |
| CDKDRDX2 | Cadmium distribution coefficient |
| Radiotracer incubation in the dark: phases split by 0.4/0.45 µm pore filtration | |
| Litres per kilogram | |
| CDXXAAP2 | Particulate cadmium |
| Acid leach then atomic absorption (0.4/0.45 µm pore filtered) | |
| Nanomoles per litre | |
| CDXXCVDX | Dissolved cadmium |
| Cathodic stripping voltammetry (UV digested) | |
| Nanomoles per litre | |
| CDXXFXD2 | Dissolved cadmium |
| Solvent extraction of chelated metal then atomic absorption (0.4/0.45 µm pore filtered) | |
| Nanomoles per litre | |
| CDXXICD2 | Dissolved cadmium |
| Inductively-coupled plasma mass spectrometry (0.4/0.45 µm pore filtered) | |
| Nanomoles per litre | |
| CDXXICP2 | Particulate cadmium |
| Acid leach then ICP-MS (0.4/0.45 µm pore filtered) | |
| Nanomoles per litre | |
| COCNICP2 | Particulate cobalt content |
| Acid leach then ICP-MS (0.4/0.45 µm pore filtered) | |
| Parts per million | |
| COXXAAP2 | Particulate cobalt |
| Acid leach then atomic absorption (0.4/0.45 µm pore filtered) | |
| Nanomoles per litre | |
| COXXICP2 | Particulate cobalt |
| Acid leach then ICP-MS (0.4/0.45 µm pore filtered) | |
| Nanomoles per litre | |
| CSKDRDX2 | Caesium distribution coefficient |
| Radiotracer incubation in the dark: phases split by 0.4/0.45 µm pore filtration | |
| Litres per kilogram | |
| CUCNAAP2 | Particulate copper content |
| Acid leach then atomic absorption (0.4/0.45 µm pore filtered) | |
| Parts per million | |
| CUCNICP2 | Particulate copper content |
| Acid leach then ICP-MS (0.4/0.45 µm pore filtered) | |
| Parts per million | |
| CUXXAAP2 | Particulate copper |
| Acid leach then atomic absorption (0.4/0.45 µm pore filtered) | |
| Nanomoles per litre | |
| CUXXCVDX | Dissolved copper |
| Cathodic stripping voltammetry (UV digested) | |
| Nanomoles per litre | |
| CUXXFXD2 | Dissolved copper |
| Solvent extraction of chelated metal then atomic absorption (0.4/0.45 µm pore filtered) | |
| Nanomoles per litre | |
| CUXXICD2 | Dissolved copper |
| Inductively-coupled plasma mass spectrometry (0.4/0.45 µm pore filtered) | |
| Nanomoles per litre | |
| CUXXICP2 | Particulate copper |
| Acid leach then ICP-MS (0.4/0.45 µm pore filtered) | |
| Nanomoles per litre | |
| FECNAAP2 | Particulate total iron content |
| Acid leach then atomic absorption (0.4/0.45 µm pore filtered) | |
| Per cent | |
| FECNICP2 | Particulate total iron content |
| Acid leach then ICP-MS (0.4/0.45 µm pore filtered) | |
| Per cent | |
| FEXXAAP2 | Particulate total iron |
| Acid leach then atomic absorption (0.4/0.45 µm pore filtered) | |
| Nanomoles per litre | |
| FEXXFXD2 | Dissolved total iron |
| Solvent extraction of chelated metal then atomic absorption (0.4/0.45 µm pore filtered) | |
| Nanomoles per litre | |
| FEXXICD2 | Dissolved total iron |
| Inductively-coupled plasma mass spectrometry (0.4/0.45 µm pore filtered) | |
| Nanomoles per litre | |
| FEXXICP2 | Particulate total iron |
| Acid leach then ICP-MS (0.4/0.45 µm pore filtered) | |
| Nanomoles per litre | |
| MNCNAAP2 | Particulate total manganese content |
| Acid leach then atomic absorption (0.4/0.45 µm pore filtered) | |
| Per cent | |
| MNKDRDX2 | Manganese distribution coefficient |
| Radiotracer incubation in the dark: phases split by 0.4/0.45 µm pore filtration | |
| Litres per kilogram | |
| MNXXAAP2 | Particulate total manganese |
| Acid leach then atomic absorption (0.4/0.45 µm pore filtered) | |
| Nanomoles per litre | |
| MNXXFXD2 | Dissolved total manganese |
| Solvent extraction of chelated metal then atomic absorption (0.4/0.45 µm pore filtered) | |
| Nanomoles per litre | |
| MNXXICD2 | Dissolved total manganese |
| Inductively-coupled plasma mass spectrometry (0.4/0.45 µm pore filtered) | |
| Nanomoles per litre | |
| NICNAAP2 | Particulate nickel content |
| Acid leach then atomic absorption (0.4/0.45 µm pore filtered) | |
| Parts per million | |
| NICNICP2 | Particulate nickel content |
| Acid leach then ICP-MS (0.4/0.45 µm pore filtered) | |
| Parts per million | |
| NIXXCVDX | Dissolved nickel |
| Cathodic stripping voltammetry (UV digested) | |
| Nanomoles per litre | |
| NIXXFXD2 | Dissolved nickel |
| Solvent extraction of chelated metal then atomic absorption (0.4/0.45 µm pore filtered) | |
| Nanomoles per litre | |
| NIXXICD2 | Dissolved nickel |
| Inductively-coupled plasma mass spectrometry (0.4/0.45 µm pore filtered) | |
| Nanomoles per litre | |
| NIXXICP2 | Particulate nickel |
| Acid leach then ICP-MS (0.4/0.45 µm pore filtered) | |
| Nanomoles per litre | |
| PBCNAAP2 | Particulate lead content |
| Acid leach then atomic absorption (0.4/0.45 µm pore filtered) | |
| Parts per million | |
| PBCNICP2 | Particulate lead content |
| Acid leach then ICP-MS (0.4/0.45 µm pore filtered) | |
| Parts per million | |
| PBXXAAP2 | Particulate lead |
| Acid leach then atomic absorption (0.4/0.45 µm pore filtered) | |
| Nanomoles per litre | |
| PBXXFXD2 | Dissolved lead |
| Solvent extraction of chelated metal then atomic absorption (0.4/0.45 µm pore filtered) | |
| Nanomoles per litre | |
| PBXXICD2 | Dissolved lead |
| Inductively-coupled plasma mass spectrometry (0.4/0.45 µm pore filtered) | |
| Nanomoles per litre | |
| PBXXICP2 | Particulate lead |
| Acid leach then ICP-MS (0.4/0.45 µm pore filtered) | |
| Nanomoles per litre | |
| SRCNICP2 | Particulate strontium content |
| Acid leach then ICP-MS (0.4/0.45 µm pore filtered) | |
| Parts per million | |
| SRXXICP2 | Particulate strontium |
| Acid leach then ICP-MS (0.4/0.45 µm pore filtered) | |
| Nanomoles per litre | |
| ZNCNAAP2 | Particulate zinc content |
| Acid leach then atomic absorption (0.4/0.45 µm pore filtered) | |
| Parts per million | |
| ZNCNICP2 | Particulate zinc content |
| Acid leach then ICP-MS (0.4/0.45 µm pore filtered) | |
| Parts per million | |
| ZNKDRDX2 | Zinc distribution coefficient |
| Radiotracer incubation in the dark: phases split by 0.4/0.45 µm pore filtration | |
| Litres per kilogram | |
| ZNXXAAP2 | Particulate zinc |
| Acid leach then atomic absorption (0.4/0.45 µm pore filtered) | |
| Nanomoles per litre | |
| ZNXXFXD2 | Dissolved zinc |
| Solvent extraction of chelated metal then atomic absorption (0.4/0.45 µm pore filtered) | |
| Nanomoles per litre | |
| ZNXXICP2 | Particulate zinc |
| Acid leach then ICP-MS (0.4/0.45 µm pore filtered) | |
| Nanomoles per litre |
Data Originator
Dr Reg Uncles, Plymouth Marine Laboratory, UK.
Sampling strategy and methodology
Tweed campaigns TWEED02, TWEED03, TWEED04, TWEED05, TWEED06, TWEED07, TWEED08, TWEED10, TWEED12 and TWEED13.
RRS Challenger cruises CH99, CH115B, CH115C and CH119A.
Challenger Dissolved Aluminium
Water samples were taken from either the CTD rosette or the ship's non-toxic supply. The samples were filtered through a 0.45-micron pore filter and aluminium was determined following complexation by lumogallion and fluorimetric determination of the Al complex (Hydes and Liss, 1976). All analytical work was undertaken on board ship.
Tweed Dissolved Trace Metals
The water samples were collected manually in acid-cleaned plastic bottles, filtered through 0.45-micron pore filters and acidified. Prior to analysis the samples were processed using the method of Danielsson et al. (1982) to remove interfering matrix. The modified samples were analysed using an Inductively Coupled Plasma Mass Spectrometer (ICP-MS).
The data were supplied expressed as parts per billion (PPB), which is equivalent to ng/l. They were converted to nM at BODC through division by their atomic weights. The atomic weights used were 112.4 for cadmium, 63.55 for copper, 55.85 for iron, 207.2 for lead, 54.94 for manganese and 58.69 for nickel.
References
Achterberg, E. P. and van den Berg, C.M.G., 1994. Automated voltammetric system for shipboard determination of metal speciation in sea water. Anal. Chim. Acta 284, 463-471.
Colombo, C and van den Berg, C.M.G., 1997. Simultaneous determination of several trace metals in seawater using cathodic stripping voltammetry with mixed ligands. Anal. Chim. Acta 337, 29-40.
Heron, S.J. and Burton, J.D., 1987. Evaluation of a Spectrofluorimetric Method for Aluminium by Lumogallion. Final Report on Department of Environment Contract No. PECD 7/7/173. Department of Oceanography, University of Southampton. January 1987, 22 pp.
Hydes, D.J. and Liss, P.S., 1976. A fluorimetric method for the determination of low concentrations of dissolved aluminium in natural waters. Analyst 101, 922 931.
Morley, N.H., Statham P.J. and Fay, C., 1988. Design and use of a clean shipboard handling system for seawater samples. In: Advances in Underwater Technology, Ocean Science and Offshore Engineering, Volume 16 (Oceanology '88), Graham and Trotman, London, 283-290.
Nimmo, M., van den Berg, C.M.G. and Brown, J., 1989. The chemical speciation of dissolved nickel, copper, vanadium and iron in Liverpool Bay, Irish Sea. Coastal Shelf Res. 29, 57-74.
Pihlar, B., Valenta, P. and Nurnberg, H.W., 1981. New high-performance analytical procedure for the voltammetric determination of nickel in routine analysis of waters, biological materials and food. Fres. Z. Anal. Chem. 307, 337-346.
Tappin, A.D., Millward, G.E., Burton, J.D., Statham, P.J. and Morris, A.W., 1995. Trace metals in the central and southern North Sea. Estuarine, Coastal and Shelf Science 41, 275-323.
Project Information
LOIS River-Atmosphere-Coast Study (LOIS - RACS)
Introduction
The Land-Ocean Interaction Study (LOIS) was a NERC research programme designed to study processes in the coastal zone. The Rivers, Atmosphere and Coasts Study (RACS) was a major component of LOIS that looked at land-sea interactions in the coastal zone and the major exchanges (physical, chemical and biological) between rivers and estuaries and the atmosphere. The study focused on the east coast of the UK from the Wash to the Tweed.
RACS included several sub-components
- BIOTA - A study of salt marshes of the Humber and Wash
- RACS (A) - An atmospheric chemistry study looking at air mass changes from the Wash into East Anglia
- RACS (C) - A study of the estuaries, coasts and coastal waters between Great Yarmouth and Berwick upon Tweed.
1. The coastal oceangraphic survey
2. The Humber estuarine study
3. The Tweed estuarine study
4. The Holderness experiment - RACS (R) - A study of rivers that drain into the North Sea
RACS (A) was coordinated by the University of East Anglia and RACS (C) by the Plymouth Marine Laboratory.
RACS (A)
The bulk of the RACS (A) data set was collected during two field campaigns in the winter (October/November) of 1994 and the summer (May/June) of 1995. During these campaigns data were collected continuously from the University of East Anglia Atmospheric Observatory at Weybourne on the north Norfolk coast. An instrumented vessel was stationed offshore to provide a second sampling site to allow changes in a given air mass to be monitored. The Imperial College Jetstream research aircraft made one flight during each campaign to provide a link between the two surface stations. The Jetstream made four additional flights in 1996 and 1997.
RACS (C)
The coastal oceanographic survey
The coastal oceanographic data set was collected during a series of 17 RRS Challenger cruise legs. Most cruises covered two survey grids. One from Great Yarmouth to the Humber designed around the distribution of the sandbanks and a second simple zig-zag grid from the Humber to Berwick on Tweed. A large number of anchor stations, usually over one or two tidal cycles, were worked in the area of the Humber mouth or the Holderness coast.
The Humber estuarine study
The Humber estuarine data set was collected during a series of 33 campaigns on the Environment Agency vessels Sea Vigil and Water Guardian in the Humber, Trent and Ouse river systems at approximately monthly intervals between June 1993 and December 1996. Each campaign consisted of two or three one-day cruises. The tracks covered the estuary from the tidal limits of both Trent and Ouse to Spurn Point. Instrumental and sample data are available from a series of fixed stations that were sampled during every campaign.
The Tweed estuarine study
The Tweed estuarine data set was collected during a series of 13 campaigns using RV Tamaris in association with a rigid inflatable vessel at approximately monthly intervals between July 1996 and July 1997. Each campaign covered the tidal reaches of the River Tweed.
The Holderness experiment
The Holderness Experiment was designed to monitor the process of sediment transport along the Holderness coastline. It consisted of three moored instrument deployments during the winters of 1993-1994, 1994-1995 and 1995-1996. Mooring platforms were deployed at eight stations along two lines off the Holderness coast. A northerly and a southerly line of four stations each were used (N1 - N4 and S1 to S4) with the lowest numbers being inshore. Both lines were approximately perpendicular to the coast, although the S4 station lay to the south of the S line, off Spurn Head.
Data Activity or Cruise Information
Data Activity
| Start Date (yyyy-mm-dd) | 1992-12-16 |
| End Date (yyyy-mm-dd) | 1992-12-16 |
| Organization Undertaking Activity | Plymouth Marine Laboratory |
| Country of Organization | United Kingdom |
| Originator's Data Activity Identifier | CH99_CTD_CTD82 |
| Platform Category | lowered unmanned submersible |
BODC Sample Metadata Report for CH99_CTD_CTD82
| Sample reference number | Nominal collection volume(l) | Bottle rosette position | Bottle firing sequence number | Minimum pressure sampled (dbar) | Maximum pressure sampled (dbar) | Depth of sampling point (m) | Bottle type | Sample quality flag | Bottle reference | Comments |
|---|---|---|---|---|---|---|---|---|---|---|
| 364179 | 10.00 | 6.00 | 6.20 | 4.80 | Niskin bottle | No problem reported |
Please note:the supplied parameters may not have been sampled from all the bottle firings described in the table above. Cross-match the Sample Reference Number above against the SAMPRFNM value in the data file to identify the relevant metadata.
Cruise
| Cruise Name | CH99 |
| Departure Date | 1992-12-07 |
| Arrival Date | 1992-12-21 |
| Principal Scientist(s) | Alan W Morris (Plymouth Marine Laboratory) |
| Ship | RRS Challenger |
Complete Cruise Metadata Report is available here
Fixed Station Information
Fixed Station Information
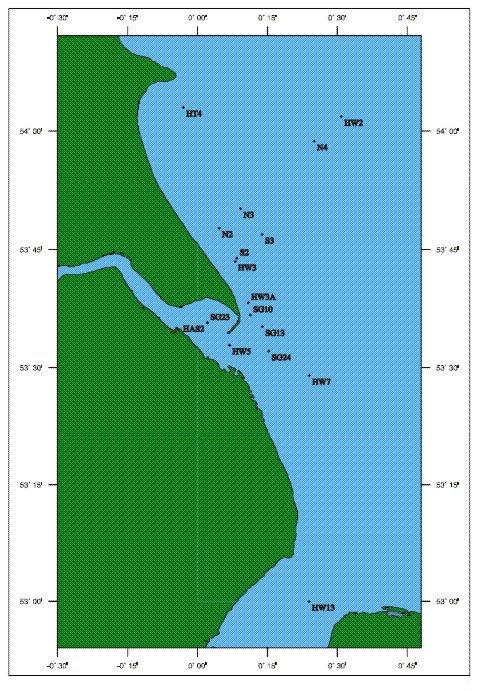
| Station Name | LOIS RACS anchor station HAS1/SG23 |
| Category | Offshore location |
| Latitude | 53° 35.40' N |
| Longitude | 0° 2.22' E |
| Water depth below MSL |
LOIS (RACS) anchor station HAS2/SG23
Several anchor stations were worked by the LOIS RACS Challenger cruises with the ship at anchor for periods of between 12 and 24 hours. The anchor station designations are of something of a mixed bag. Some correspond to stations on either the Humber-Wash (HW) or Humber-Tweed (HT) grids, the N and S stations are mooring site designations for the RACS Holderness Experiment and the SG station designations were unique to Challenger cruise CH119A.
HAS2, also know as SG23, is an anchor station at position 53.59°N, 0.037°E worked during the Challenger cruises CH99 and CH119A (no CTD profiles were collected during CH119A).
On most cruises the ship's instruments (including nutrients) monitored the surface water from the non-toxic supply. In addition, CTD profiles were collected at regular intervals at each anchor station, however the sampling strategy varied from cruise to cruise. Typically, the minimum coverage was a CTD cast every hour with water samples taken from the rosette, however sometimes additional casts without water sampling were taken to increase the sampling frequency to every 30 minutes or even 15 minutes.
Related Fixed Station activities are detailed in Appendix 1
BODC Quality Control Flags
The following single character qualifying flags may be associated with one or more individual parameters with a data cycle:
| Flag | Description |
|---|---|
| Blank | Unqualified |
| < | Below detection limit |
| > | In excess of quoted value |
| A | Taxonomic flag for affinis (aff.) |
| B | Beginning of CTD Down/Up Cast |
| C | Taxonomic flag for confer (cf.) |
| D | Thermometric depth |
| E | End of CTD Down/Up Cast |
| G | Non-taxonomic biological characteristic uncertainty |
| H | Extrapolated value |
| I | Taxonomic flag for single species (sp.) |
| K | Improbable value - unknown quality control source |
| L | Improbable value - originator's quality control |
| M | Improbable value - BODC quality control |
| N | Null value |
| O | Improbable value - user quality control |
| P | Trace/calm |
| Q | Indeterminate |
| R | Replacement value |
| S | Estimated value |
| T | Interpolated value |
| U | Uncalibrated |
| W | Control value |
| X | Excessive difference |
SeaDataNet Quality Control Flags
The following single character qualifying flags may be associated with one or more individual parameters with a data cycle:
| Flag | Description |
|---|---|
| 0 | no quality control |
| 1 | good value |
| 2 | probably good value |
| 3 | probably bad value |
| 4 | bad value |
| 5 | changed value |
| 6 | value below detection |
| 7 | value in excess |
| 8 | interpolated value |
| 9 | missing value |
| A | value phenomenon uncertain |
| B | nominal value |
| Q | value below limit of quantification |
Appendix 1: LOIS RACS anchor station HAS1/SG23
Related series for this Fixed Station are presented in the table below. Further information can be found by following the appropriate links.
If you are interested in these series, please be aware we offer a multiple file download service. Should your credentials be insufficient for automatic download, the service also offers a referral to our Enquiries Officer who may be able to negotiate access.
| Series Identifier | Data Category | Start date/time | Start position | Cruise |
|---|---|---|---|---|
| 844638 | CTD or STD cast | 1992-12-15 20:29:00 | 53.5955 N, 0.03533 E | RRS Challenger CH99 |
| 2093354 | Water sample data | 1992-12-15 20:31:30 | 53.59549 N, 0.0354 E | RRS Challenger CH99 |
| 844454 | CTD or STD cast | 1992-12-15 20:58:00 | 53.596 N, 0.03533 E | RRS Challenger CH99 |
| 2093366 | Water sample data | 1992-12-15 20:59:30 | 53.59601 N, 0.03529 E | RRS Challenger CH99 |
| 844466 | CTD or STD cast | 1992-12-15 21:28:00 | 53.5955 N, 0.03583 E | RRS Challenger CH99 |
| 2093378 | Water sample data | 1992-12-15 21:30:30 | 53.59553 N, 0.03581 E | RRS Challenger CH99 |
| 844651 | CTD or STD cast | 1992-12-15 21:58:00 | 53.59567 N, 0.03633 E | RRS Challenger CH99 |
| 2093391 | Water sample data | 1992-12-15 22:00:00 | 53.59563 N, 0.03634 E | RRS Challenger CH99 |
| 844663 | CTD or STD cast | 1992-12-15 22:27:00 | 53.59567 N, 0.03633 E | RRS Challenger CH99 |
| 2093409 | Water sample data | 1992-12-15 22:30:30 | 53.5956 N, 0.03639 E | RRS Challenger CH99 |
| 844675 | CTD or STD cast | 1992-12-15 22:58:00 | 53.59483 N, 0.03733 E | RRS Challenger CH99 |
| 2093410 | Water sample data | 1992-12-15 23:01:00 | 53.59488 N, 0.03736 E | RRS Challenger CH99 |
| 844687 | CTD or STD cast | 1992-12-15 23:28:00 | 53.59483 N, 0.0365 E | RRS Challenger CH99 |
| 844699 | CTD or STD cast | 1992-12-16 00:01:00 | 53.59433 N, 0.03683 E | RRS Challenger CH99 |
| 2093422 | Water sample data | 1992-12-16 00:05:00 | 53.59438 N, 0.03679 E | RRS Challenger CH99 |
| 844706 | CTD or STD cast | 1992-12-16 00:32:00 | 53.5945 N, 0.03667 E | RRS Challenger CH99 |
| 2094161 | Water sample data | 1992-12-16 00:34:30 | 53.59455 N, 0.03675 E | RRS Challenger CH99 |
| 844718 | CTD or STD cast | 1992-12-16 00:59:00 | 53.5945 N, 0.03683 E | RRS Challenger CH99 |
| 2093434 | Water sample data | 1992-12-16 01:02:30 | 53.59452 N, 0.03681 E | RRS Challenger CH99 |
| 844731 | CTD or STD cast | 1992-12-16 01:37:00 | 53.59467 N, 0.03683 E | RRS Challenger CH99 |
| 844743 | CTD or STD cast | 1992-12-16 02:02:00 | 53.59467 N, 0.03633 E | RRS Challenger CH99 |
| 2093446 | Water sample data | 1992-12-16 02:05:00 | 53.59465 N, 0.03637 E | RRS Challenger CH99 |
| 844755 | CTD or STD cast | 1992-12-16 02:32:00 | 53.5945 N, 0.03633 E | RRS Challenger CH99 |
| 844478 | CTD or STD cast | 1992-12-16 03:01:00 | 53.5945 N, 0.0365 E | RRS Challenger CH99 |
| 2093458 | Water sample data | 1992-12-16 03:05:00 | 53.59446 N, 0.03644 E | RRS Challenger CH99 |
| 844491 | CTD or STD cast | 1992-12-16 03:32:00 | 53.5945 N, 0.03683 E | RRS Challenger CH99 |
| 844282 | CTD or STD cast | 1992-12-16 04:02:00 | 53.5955 N, 0.03667 E | RRS Challenger CH99 |
| 2093471 | Water sample data | 1992-12-16 04:05:00 | 53.59555 N, 0.03671 E | RRS Challenger CH99 |
| 844509 | CTD or STD cast | 1992-12-16 04:32:00 | 53.5955 N, 0.03617 E | RRS Challenger CH99 |
| 844510 | CTD or STD cast | 1992-12-16 05:01:00 | 53.59583 N, 0.03567 E | RRS Challenger CH99 |
| 2093483 | Water sample data | 1992-12-16 05:05:00 | 53.59591 N, 0.03559 E | RRS Challenger CH99 |
| 844522 | CTD or STD cast | 1992-12-16 05:31:00 | 53.5955 N, 0.03567 E | RRS Challenger CH99 |
| 844534 | CTD or STD cast | 1992-12-16 06:00:00 | 53.59533 N, 0.03517 E | RRS Challenger CH99 |
| 844036 | CTD or STD cast | 1992-12-16 06:32:00 | 53.59533 N, 0.035 E | RRS Challenger CH99 |
| 844048 | CTD or STD cast | 1992-12-16 06:59:00 | 53.5955 N, 0.03533 E | RRS Challenger CH99 |
| 2093502 | Water sample data | 1992-12-16 07:02:00 | 53.59555 N, 0.03533 E | RRS Challenger CH99 |
| 844546 | CTD or STD cast | 1992-12-16 07:32:00 | 53.59533 N, 0.03517 E | RRS Challenger CH99 |
| 2094185 | Water sample data | 1992-12-16 07:35:00 | 53.59532 N, 0.0352 E | RRS Challenger CH99 |
| 844061 | CTD or STD cast | 1992-12-16 08:02:00 | 53.5955 N, 0.035 E | RRS Challenger CH99 |
| 2093514 | Water sample data | 1992-12-16 08:05:00 | 53.5955 N, 0.03498 E | RRS Challenger CH99 |
| 844073 | CTD or STD cast | 1992-12-16 08:32:00 | 53.59567 N, 0.0355 E | RRS Challenger CH99 |
| 844085 | CTD or STD cast | 1992-12-16 09:00:00 | 53.59583 N, 0.0355 E | RRS Challenger CH99 |
| 2093526 | Water sample data | 1992-12-16 09:05:00 | 53.59575 N, 0.03553 E | RRS Challenger CH99 |
| 844558 | CTD or STD cast | 1992-12-16 09:29:00 | 53.59533 N, 0.03533 E | RRS Challenger CH99 |
| 844097 | CTD or STD cast | 1992-12-16 11:39:00 | 53.595 N, 0.037 E | RRS Challenger CH99 |
| 2093538 | Water sample data | 1992-12-16 11:42:00 | 53.59494 N, 0.03697 E | RRS Challenger CH99 |
