Metadata Report for BODC Series Reference Number 2160362
Metadata Summary
Problem Reports
Data Access Policy
Narrative Documents
Project Information
Data Activity or Cruise Information
Fixed Station Information
BODC Quality Flags
SeaDataNet Quality Flags
Metadata Summary
Data Description |
|||||||||||||||||||||||||||||||||
|
|||||||||||||||||||||||||||||||||
Data Identifiers |
|||||||||||||||||||||||||||||||||
|
|||||||||||||||||||||||||||||||||
Time Co-ordinates(UT) |
|||||||||||||||||||||||||||||||||
|
|||||||||||||||||||||||||||||||||
Spatial Co-ordinates | |||||||||||||||||||||||||||||||||
|
|||||||||||||||||||||||||||||||||
Parameters |
|||||||||||||||||||||||||||||||||
|
|||||||||||||||||||||||||||||||||
|
|||||||||||||||||||||||||||||||||
Problem Reports
No Problem Report Found in the Database
Data Access Policy
GEOTRACES - data access conditions
Access to this data is currently restricted and it is not available via BODC's normal delivery mechanisms.
GEOTRACES data are published via the GEOTRACES IDP, available at:
Narrative Documents
MD188 CTD Instrumentation
The CTD was fitted with the following sensors:
| Sensor | Serial Number | Calibration Date | Comments |
|---|---|---|---|
| Sea-Bird SBE 911plus CTD | - | - | - |
| Sea-Bird SBE 3plus (SBE 3P) temperature sensor | - | - | - |
| Sea-Bird SBE 4C conductivity sensor | - | - | - |
| Aanderaa optode | - | - | - |
| WET Labs {Sea-Bird WETLabs} ECO FLNTUS combined fluorometer and turbidity sensor | - | - | - |
| WET Labs {Sea-Bird WETLabs} C-Star transmissometer | - | - | - |
Some information is unavailable.
Sea-Bird Electronics SBE 911 and SBE 917 series CTD profilers
The SBE 911 and SBE 917 series of conductivity-temperature-depth (CTD) units are used to collect hydrographic profiles, including temperature, conductivity and pressure as standard. Each profiler consists of an underwater unit and deck unit or SEARAM. Auxiliary sensors, such as fluorometers, dissolved oxygen sensors and transmissometers, and carousel water samplers are commonly added to the underwater unit.
Underwater unit
The CTD underwater unit (SBE 9 or SBE 9 plus) comprises a protective cage (usually with a carousel water sampler), including a main pressure housing containing power supplies, acquisition electronics, telemetry circuitry, and a suite of modular sensors. The original SBE 9 incorporated Sea-Bird's standard modular SBE 3 temperature sensor and SBE 4 conductivity sensor, and a Paroscientific Digiquartz pressure sensor. The conductivity cell was connected to a pump-fed plastic tubing circuit that could include auxiliary sensors. Each SBE 9 unit was custom built to individual specification. The SBE 9 was replaced in 1997 by an off-the-shelf version, termed the SBE 9 plus, that incorporated the SBE 3 plus (or SBE 3P) temperature sensor, SBE 4C conductivity sensor and a Paroscientific Digiquartz pressure sensor. Sensors could be connected to a pump-fed plastic tubing circuit or stand-alone.
Temperature, conductivity and pressure sensors
The conductivity, temperature, and pressure sensors supplied with Sea-Bird CTD systems have outputs in the form of variable frequencies, which are measured using high-speed parallel counters. The resulting count totals are converted to numeric representations of the original frequencies, which bear a direct relationship to temperature, conductivity or pressure. Sampling frequencies for these sensors are typically set at 24 Hz.
The temperature sensing element is a glass-coated thermistor bead, pressure-protected inside a stainless steel tube, while the conductivity sensing element is a cylindrical, flow-through, borosilicate glass cell with three internal platinum electrodes. Thermistor resistance or conductivity cell resistance, respectively, is the controlling element in an optimized Wien Bridge oscillator circuit, which produces a frequency output that can be converted to a temperature or conductivity reading. These sensors are available with depth ratings of 6800 m (aluminium housing) or 10500 m (titanium housing). The Paroscientific Digiquartz pressure sensor comprises a quartz crystal resonator that responds to pressure-induced stress, and temperature is measured for thermal compensation of the calculated pressure.
Additional sensors
Optional sensors for dissolved oxygen, pH, light transmission, fluorescence and others do not require the very high levels of resolution needed in the primary CTD channels, nor do these sensors generally offer variable frequency outputs. Accordingly, signals from the auxiliary sensors are acquired using a conventional voltage-input multiplexed A/D converter (optional). Some Sea-Bird CTDs use a strain gauge pressure sensor (Senso-Metrics) in which case their pressure output data is in the same form as that from the auxiliary sensors as described above.
Deck unit or SEARAM
Each underwater unit is connected to a power supply and data logging system: the SBE 11 (or SBE 11 plus) deck unit allows real-time interfacing between the deck and the underwater unit via a conductive wire, while the submersible SBE 17 (or SBE 17 plus) SEARAM plugs directly into the underwater unit and data are downloaded on recovery of the CTD. The combination of SBE 9 and SBE 17 or SBE 11 are termed SBE 917 or SBE 911, respectively, while the combinations of SBE 9 plus and SBE 17 plus or SBE 11 plus are termed SBE 917 plus or SBE 911 plus.
Specifications
Specifications for the SBE 9 plus underwater unit are listed below:
| Parameter | Range | Initial accuracy | Resolution at 24 Hz | Response time |
|---|---|---|---|---|
| Temperature | -5 to 35°C | 0.001°C | 0.0002°C | 0.065 sec |
| Conductivity | 0 to 7 S m-1 | 0.0003 S m-1 | 0.00004 S m-1 | 0.065 sec (pumped) |
| Pressure | 0 to full scale (1400, 2000, 4200, 6800 or 10500 m) | 0.015% of full scale | 0.001% of full scale | 0.015 sec |
Further details can be found in the manufacturer's specification sheet.
WETLabs ECO-FLNTU(S) combined fluorometer and turbidity sensor
A combined fluorometer and turbidity sensor. The (S) designation signifies that this sensor has an integrated anti-fouling bio-wiper and copper faceplate. The instrument measures chlorophyll fluorescence at 470 nm and turbidity at 700 nm within the same volume. Chlorophyll is excited by the presence of an external light source, this excitement is detected as Chlorophyll-a fluorescence by a detector for a given sample volume of water. Turbidity is measured simultaneously by detecting the scattered light from an external light source. Key characteristics are two light sources: (1) two bright blue LEDs centred at 455 nm and modulated at 1 kHz (to excite Chlorophyll-a) and (2) one 700 nm LED (to scatter from particulate matter). Detectors for fluorescence and turbidity are positioned at a 140 degree angle to the light sources. The instrument is stable over a temperature range of 0 - 30 degC and is rated to a depth of 300 m as standard. The fluorometer can typically measure phytoplankton concentrations in the range 0.01 - 50 ug/l, with a sensitivity of 0.01 ug/l, at wavelengths of 470 (excitation) or 695 (emission) nm. The turbidity sensor can measure within the range 0.01 - 25 NTU, with a sensitivity of 0.01 NTU, at a wavelength of 700 nm.
For more information, please see this document: https://www.bodc.ac.uk/data/documents/nodb/pdf/FLNTU_Manual
WETLabs C-Star transmissometer
This instrument is designed to measure beam transmittance by submersion or with an optional flow tube for pumped applications. It can be used in profiles, moorings or as part of an underway system.
Two models are available, a 25 cm pathlength, which can be built in aluminum or co-polymer, and a 10 cm pathlength with a plastic housing. Both have an analog output, but a digital model is also available.
This instrument has been updated to provide a high resolution RS232 data output, while maintaining the same design and characteristics.
Specifications
| Pathlength | 10 or 25 cm |
| Wavelength | 370, 470, 530 or 660 nm |
| Bandwidth | ~ 20 nm for wavelengths of 470, 530 and 660 nm ~ 10 to 12 nm for a wavelength of 370 nm |
| Temperature error | 0.02 % full scale °C-1 |
| Temperature range | 0 to 30°C |
| Rated depth | 600 m (plastic housing) 6000 m (aluminum housing) |
Further details are available in the manufacturer's specification sheet or user guide.
CTD data profiles for Cruise MD188 (GIpr01)
Sampling Strategy
A total of 120 CTD casts were carried out during cruise MD188, on board R/V Marion Dufresne II, using a stainless steel CTD frame equipped with twenty-two 12 L Niskin bottles. The cruise surveyed GEOTRACES section GIpr01.
Originator's Data Processing Procedures
Data are upcast data, binned every metre. Conductivity data were corrected in comparison with the on board salinity analysis of water samples using a Portasal salinometer; low-pass filtering of data with a widow width of 10 decibars and resampling at 1 decibar. CTD-Fluorescence was calibrated by comparison with in situ measurement of total chlorophyll a (µg/L) from Niskin bottles. A regression was used to convert the fluorescence values to an actual chl-a concentration. As daylight fluorescence profiles are known to be affected by quenching, only values collected during night (06:00 pm to 06:00 am) were included in the analysis to determine the regression equation. The regression equation applied is:
Fluorescence_calib = Fluorescence * 1.2935 + 0.2886
MD188 Cruise report
Further information can be found in the MD188 Cruise report.
BODC Data Processing Procedures
Data received were converted to the BODC internal format (a netCDF subset). A parameter mapping table is provided below:
| Originator's Variable | Originator's Units | BODC Parameter Code | BODC Units | GEOTRACES Code | GEOTRACES Units | Comments |
|---|---|---|---|---|---|---|
| Pression | decibar | PRESPR01 | decibar | CTDPRS_T_VALUE_SENSOR | decibar | - |
| Temperature | °C | TEMPST01 | °C | CTDTMP_T_VALUE_SENSOR | °C | - |
| Salinity | PSU | PSALST01 | dimensionless | CTDSAL_D_CONC_SENSOR | PSS-78 | Units are equivalent. |
| Oxygen | µmol/kg | DOXMZZXX | µmol/kg | CTDOXY_D_CONC_SENSOR | µmol/kg | - |
| Fluorescence_calib | µg/l | CPHLPR01 | mg/m3 | CTDCHLA_T_CONC_SENSOR | mg/m3 | Units are equivalent. |
| xmiss | % | POPTZZ01 | % | CTDXMISS%_T_VALUE_SENSOR | % | - |
Following transfer the data were screened using BODC in-house visualisation software. Suspect data values were assigned the appropriate BODC data quality flag. Missing data values, where present, were changed to the missing data value and assigned a BODC data quality flag.
Data Quality Report
CTD casts 48 and 76 (profiles<20 decibars), and 90 and 92 (acquisition interrupted) are missing.
Project Information
GEOTRACES
Introduction
GEOTRACES is an international programme sponsored by SCOR which aims to improve our understanding of biogeochemical cycles and large-scale distribution of trace elements and their isotopes (TEIs) in the marine environment. The global field programme started in 2009 and will run for at least a decade. Before the official launch of GEOTRACES, fieldwork was carried out as part of the International Polar Year (IPY)(2007-2009) where 14 cruises were connected to GEOTRACES.
GEOTRACES is expected to become the largest programme to focus on the chemistry of the oceans and will improve our understanding of past, present and future distributions of TEIs and their relationships to important global processes.
This initiative was prompted by the increasing recognition that TEIs are playing a crucial role as regulators and recorders of important biogeochemical and physical processes that control the structure and productivity of marine ecosystems, the dispersion of contaminants in the marine environment, the level of greenhouse gases in the atmosphere, and global climate.
Scientific Objectives
GEOTRACES mission is: To identify processes and quantify fluxes that control the distribution of key trace elements and isotopes in the ocean, and to establish the sensitivity of these distributions to changing environmental conditions.
Three overriding goals support the GEOTRACES mission
- Determine ocean distributions of selected TEIs at all major ocean basins
- Evaluate the sources, sinks, and internal cycling of these TEIs and thereby characterize more completely their global biogeochemical cycles
- Provide a baseline distribution in the Polar Regions as reference for assessing past and future changes.
These goals will be pursued through complementary research strategies, including observations, experiments and modelling.
Fieldwork
The central component of GEOTRACES fieldwork will be a series of cruises spanning all Ocean basins see map below.
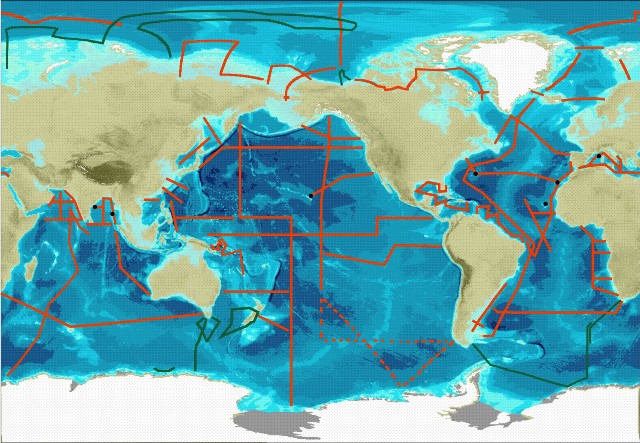
Three types of cruise are required to meet the goals set out by GEOTRACES. These are
- Section cruises - These will measure all the key parameters (see below) over the full depth of the water column. The sections were discussed and approved by the International GEOTRACES Scientific Steering Committee at the basin workshops.
- Process Studies - These will investigate a particular process relevant to the cycling of trace metal and isotopes. They must follow the "Criteria for Establishing GEOTRACES Process Studies" and be approved by the International GEOTRACES Scientific Steering Committee.
- Cruises collecting GEOTRACES compliant data - These will collect some trace element or isotope data. They must follow the GEOTRACES Intercalibration and Data Management protocols
IPY-GEOTRACES
The IPY-GEOTRACES programme comprised of 14 research cruises on ships from 7 nations; Australia, Canada, France, Germany, New Zealand, Japan and Russia. The cruises will not be classified in the same way as the full GEOTRACES programme since the intercalibration protocols and data management protocols had not been established before the start of the IPY. But IPY-GEOTRACES data will still be quality controlled by GDAC and in the majority of cases verified versus Intercalibration standards or protocols.
Key parameters
The key parameters as set out by the GEOTRACES science plan are as follows: Fe, Al, Zn, Mn, Cd, Cu; 15N, 13C; 230Th, 231Pa; Pb isotopes, Nd isotopes; stored sample, particles, aerosols.
Weblink:
http://www.bodc.ac.uk/geotraces/
http://www.geotraces.org/
Data Activity or Cruise Information
Cruise
| Cruise Name | MD188 (GIpr01, KEOPS II) |
| Departure Date | 2011-10-09 |
| Arrival Date | 2011-11-29 |
| Principal Scientist(s) | Stéphane Blain (Marseilles Oceanology Centre Luminy, Oceanography and Biogeochemistry Laboratory) |
| Ship | Marion Dufresne |
Complete Cruise Metadata Report is available here
Fixed Station Information
No Fixed Station Information held for the Series
BODC Quality Control Flags
The following single character qualifying flags may be associated with one or more individual parameters with a data cycle:
| Flag | Description |
|---|---|
| Blank | Unqualified |
| < | Below detection limit |
| > | In excess of quoted value |
| A | Taxonomic flag for affinis (aff.) |
| B | Beginning of CTD Down/Up Cast |
| C | Taxonomic flag for confer (cf.) |
| D | Thermometric depth |
| E | End of CTD Down/Up Cast |
| G | Non-taxonomic biological characteristic uncertainty |
| H | Extrapolated value |
| I | Taxonomic flag for single species (sp.) |
| K | Improbable value - unknown quality control source |
| L | Improbable value - originator's quality control |
| M | Improbable value - BODC quality control |
| N | Null value |
| O | Improbable value - user quality control |
| P | Trace/calm |
| Q | Indeterminate |
| R | Replacement value |
| S | Estimated value |
| T | Interpolated value |
| U | Uncalibrated |
| W | Control value |
| X | Excessive difference |
SeaDataNet Quality Control Flags
The following single character qualifying flags may be associated with one or more individual parameters with a data cycle:
| Flag | Description |
|---|---|
| 0 | no quality control |
| 1 | good value |
| 2 | probably good value |
| 3 | probably bad value |
| 4 | bad value |
| 5 | changed value |
| 6 | value below detection |
| 7 | value in excess |
| 8 | interpolated value |
| 9 | missing value |
| A | value phenomenon uncertain |
| B | nominal value |
| Q | value below limit of quantification |
