Metadata Report for BODC Series Reference Number 2225979
Metadata Summary
Problem Reports
Data Access Policy
Narrative Documents
Project Information
Data Activity or Cruise Information
Fixed Station Information
BODC Quality Flags
SeaDataNet Quality Flags
Metadata Summary
Data Description |
|||||||||||||||||||||||||||||||||||||||||||||||||||||||||||||||||||||||||
|
|||||||||||||||||||||||||||||||||||||||||||||||||||||||||||||||||||||||||
Data Identifiers |
|||||||||||||||||||||||||||||||||||||||||||||||||||||||||||||||||||||||||
|
|||||||||||||||||||||||||||||||||||||||||||||||||||||||||||||||||||||||||
Time Co-ordinates(UT) |
|||||||||||||||||||||||||||||||||||||||||||||||||||||||||||||||||||||||||
|
|||||||||||||||||||||||||||||||||||||||||||||||||||||||||||||||||||||||||
Spatial Co-ordinates | |||||||||||||||||||||||||||||||||||||||||||||||||||||||||||||||||||||||||
|
|||||||||||||||||||||||||||||||||||||||||||||||||||||||||||||||||||||||||
Parameters |
|||||||||||||||||||||||||||||||||||||||||||||||||||||||||||||||||||||||||
|
|||||||||||||||||||||||||||||||||||||||||||||||||||||||||||||||||||||||||
|
|||||||||||||||||||||||||||||||||||||||||||||||||||||||||||||||||||||||||
Problem Reports
No Problem Report Found in the Database
JR16005 DynOPO CTD Data Quality Report
All dissolved oxygen (DOXYUCKG and DOXYSU01) values below 1340 m depth of cast 092 have been flagged by BODC (BODC quality flag M). This is due to a reported issue with pump 1 which the sensor was attached to. The pump was subsequently replaced for cast 093 onwards.
Spikes in transmittance (POPTDR01) data recorded during casts 023, 047 and 102 have been flagged by BODC.
All altimeter (AHSFZZ01) values from all casts recorded when the sensor height was over 100 m from the seabed have not been flagged but should not be used. This is because the sensor does not accurately record measurements above this height. Where data values have been recorded while the sensor height was within 100 m from the seabed, the following casts have spikes due to incorrect values being recorded: 010, 038, 061, 062, 102, 114 and 117. The relevant data cycles from these casts have been flagged by BODC.
Data Access Policy
Open Data
These data have no specific confidentiality restrictions for users. However, users must acknowledge data sources as it is not ethical to publish data without proper attribution. Any publication or other output resulting from usage of the data should include an acknowledgment.
If the Information Provider does not provide a specific attribution statement, or if you are using Information from several Information Providers and multiple attributions are not practical in your product or application, you may consider using the following:
"Contains public sector information licensed under the Open Government Licence v1.0."
Narrative Documents
Sea-Bird Dissolved Oxygen Sensor SBE 43 and SBE 43F
The SBE 43 is a dissolved oxygen sensor designed for marine applications. It incorporates a high-performance Clark polarographic membrane with a pump that continuously plumbs water through it, preventing algal growth and the development of anoxic conditions when the sensor is taking measurements.
Two configurations are available: SBE 43 produces a voltage output and can be incorporated with any Sea-Bird CTD that accepts input from a 0-5 volt auxiliary sensor, while the SBE 43F produces a frequency output and can be integrated with an SBE 52-MP (Moored Profiler CTD) or used for OEM applications. The specifications below are common to both.
Specifications
| Housing | Plastic or titanium |
| Membrane | 0.5 mil- fast response, typical for profile applications 1 mil- slower response, typical for moored applications |
| Depth rating | 600 m (plastic) or 7000 m (titanium) 10500 m titanium housing available on request |
| Measurement range | 120% of surface saturation |
| Initial accuracy | 2% of saturation |
| Typical stability | 0.5% per 1000 h |
Further details can be found in the manufacturer's specification sheet.
JR16005 DynOPO CTD Data: Instrumentation
A Sea-Bird 911 plus CTD system was used on cruise JR16005. This was mounted on a SBE-32 carousel water sampler that was modified with four ChiPod instruments (two facing up, and two facing down) installed on the speed frame. The majority of the niskin bottles (1-6, and 13-24) were removed from the CTD frame in order to reduce the turbulence caused by the CTD to improve the quality of the ChiPods. The CTD was fitted with the following scientific sensors:
| Sensor unit | Serial Number | Calibration Date | Comments |
|---|---|---|---|
| Sea-Bird SBE 911plus CTD | 0458 | Whole cruise | |
| Paroscientific Digiquartz depth sensor | 0771 | 18/05/2016 | Whole cruise |
| Sea-Bird SBE 3plus (SBE 3P) temperature sensor 1 | 5623 | 19/05/2016 | Whole cruise |
| Sea-Bird SBE 3plus (SBE 3P) temperature sensor 2 | 4874 | 19/05/2016 | Whole cruise |
| Sea-Bird SBE 4C conductivity sensor 1 | 2813 / 4087 | 26/07/2016 / 20/05/2016 | 2813: Casts 001-003 / 4087: Casts 004-End |
| Sea-Bird SBE 4C conductivity sensor 2 | 3248 | 26/07/2016 | Whole cruise |
| Sea-Bird SBE 5T Pump 1 | 7966 / 2400 | 7966: Casts 001-092 / 2400: Cast 093-End | |
| Sea-Bird SBE 5T Pump 2 | 1807 | Whole cruise | |
| Sea-Bird SBE 35 Standards Thermometer | 0051 | 08/08/2016 | Whole cruise |
| WETLabs C-Star Transmissometer | CST-1505DR | 21/06/2016 | Whole cruise |
| Sea-Bird SBE 43 Dissolved Oxygen Sensor | 0620 / 0242 | 14/06/2016 / 25/05/2016 | 0620: Casts 001-039 / 0242: Casts 040-End |
| Biospherical QCP2350 photosynthetically active radiation (PAR) sensor | 70636 | 08/04/2016 | Whole cruise |
| Chelsea Technologies Group Aquatracka III fluorometer | 12-8513-003 | 26/04/2016 | Whole cruise |
| Tritech PA-200 Altimeter | 26993 | 04/05/2016 | Whole cruise |
| Teledyne RDI 300kHz Workhorse Monitor direct-reading ADCP Master | 14443 | Whole cruise | |
| Teledyne RDI 300kHz Workhorse Monitor direct-reading ADCP Slave | 14897 | Whole cruise | |
| CTD swivel linkage | 1961018 | Whole cruise | |
| Sea-Bird SBE 32 Pylon | 1106 | Whole cruise |
Some calibration dates are not available.
Sea-Bird Electronics SBE 911 and SBE 917 series CTD profilers
The SBE 911 and SBE 917 series of conductivity-temperature-depth (CTD) units are used to collect hydrographic profiles, including temperature, conductivity and pressure as standard. Each profiler consists of an underwater unit and deck unit or SEARAM. Auxiliary sensors, such as fluorometers, dissolved oxygen sensors and transmissometers, and carousel water samplers are commonly added to the underwater unit.
Underwater unit
The CTD underwater unit (SBE 9 or SBE 9 plus) comprises a protective cage (usually with a carousel water sampler), including a main pressure housing containing power supplies, acquisition electronics, telemetry circuitry, and a suite of modular sensors. The original SBE 9 incorporated Sea-Bird's standard modular SBE 3 temperature sensor and SBE 4 conductivity sensor, and a Paroscientific Digiquartz pressure sensor. The conductivity cell was connected to a pump-fed plastic tubing circuit that could include auxiliary sensors. Each SBE 9 unit was custom built to individual specification. The SBE 9 was replaced in 1997 by an off-the-shelf version, termed the SBE 9 plus, that incorporated the SBE 3 plus (or SBE 3P) temperature sensor, SBE 4C conductivity sensor and a Paroscientific Digiquartz pressure sensor. Sensors could be connected to a pump-fed plastic tubing circuit or stand-alone.
Temperature, conductivity and pressure sensors
The conductivity, temperature, and pressure sensors supplied with Sea-Bird CTD systems have outputs in the form of variable frequencies, which are measured using high-speed parallel counters. The resulting count totals are converted to numeric representations of the original frequencies, which bear a direct relationship to temperature, conductivity or pressure. Sampling frequencies for these sensors are typically set at 24 Hz.
The temperature sensing element is a glass-coated thermistor bead, pressure-protected inside a stainless steel tube, while the conductivity sensing element is a cylindrical, flow-through, borosilicate glass cell with three internal platinum electrodes. Thermistor resistance or conductivity cell resistance, respectively, is the controlling element in an optimized Wien Bridge oscillator circuit, which produces a frequency output that can be converted to a temperature or conductivity reading. These sensors are available with depth ratings of 6800 m (aluminium housing) or 10500 m (titanium housing). The Paroscientific Digiquartz pressure sensor comprises a quartz crystal resonator that responds to pressure-induced stress, and temperature is measured for thermal compensation of the calculated pressure.
Additional sensors
Optional sensors for dissolved oxygen, pH, light transmission, fluorescence and others do not require the very high levels of resolution needed in the primary CTD channels, nor do these sensors generally offer variable frequency outputs. Accordingly, signals from the auxiliary sensors are acquired using a conventional voltage-input multiplexed A/D converter (optional). Some Sea-Bird CTDs use a strain gauge pressure sensor (Senso-Metrics) in which case their pressure output data is in the same form as that from the auxiliary sensors as described above.
Deck unit or SEARAM
Each underwater unit is connected to a power supply and data logging system: the SBE 11 (or SBE 11 plus) deck unit allows real-time interfacing between the deck and the underwater unit via a conductive wire, while the submersible SBE 17 (or SBE 17 plus) SEARAM plugs directly into the underwater unit and data are downloaded on recovery of the CTD. The combination of SBE 9 and SBE 17 or SBE 11 are termed SBE 917 or SBE 911, respectively, while the combinations of SBE 9 plus and SBE 17 plus or SBE 11 plus are termed SBE 917 plus or SBE 911 plus.
Specifications
Specifications for the SBE 9 plus underwater unit are listed below:
| Parameter | Range | Initial accuracy | Resolution at 24 Hz | Response time |
|---|---|---|---|---|
| Temperature | -5 to 35°C | 0.001°C | 0.0002°C | 0.065 sec |
| Conductivity | 0 to 7 S m-1 | 0.0003 S m-1 | 0.00004 S m-1 | 0.065 sec (pumped) |
| Pressure | 0 to full scale (1400, 2000, 4200, 6800 or 10500 m) | 0.015% of full scale | 0.001% of full scale | 0.015 sec |
Further details can be found in the manufacturer's specification sheet.
Chelsea Technologies Group Aquatracka MKIII fluorometer
The Chelsea Technologies Group Aquatracka MKIII is a logarithmic response fluorometer. Filters are available to enable the instrument to measure chlorophyll, rhodamine, fluorescein and turbidity.
It uses a pulsed (5.5 Hz) xenon light source discharging along two signal paths to eliminate variations in the flashlamp intensity. The reference path measures the intensity of the light source whilst the signal path measures the intensity of the light emitted from the specimen under test. The reference signal and the emitted light signals are then applied to a ratiometric circuit. In this circuit, the ratio of returned signal to reference signal is computed and scaled logarithmically to achieve a wide dynamic range. The logarithmic conversion accuracy is maintained at better than one percent of the reading over the full output range of the instrument.
Two variants of the instrument are available, both manufactured in titanium, capable of operating in depths from shallow water down to 2000 m and 6000 m respectively. The optical characteristics of the instrument in its different detection modes are visible below:
| Excitation | Chlorophyll a | Rhodamine | Fluorescein | Turbidity |
|---|---|---|---|---|
| Wavelength (nm) | 430 | 500 | 485 | 440* |
| Bandwidth (nm) | 105 | 70 | 22 | 80* |
| Emission | Chlorophyll a | Rhodamine | Fluorescein | Turbidity |
| Wavelength (nm) | 685 | 590 | 530 | 440* |
| Bandwidth (nm) | 30 | 45 | 30 | 80* |
* The wavelengths for the turbidity filters are customer selectable but must be in the range 400 to 700 nm. The same wavelength is used in the excitation path and the emission path.
The instrument measures chlorophyll a, rhodamine and fluorescein with a concentration range of 0.01 µg l-1 to 100 µg l-1. The concentration range for turbidity is 0.01 to 100 FTU (other wavelengths are available on request).
The instrument accuracy is ± 0.02 µg l-1 (or ± 3% of the reading, whichever is greater) for chlorophyll a, rhodamine and fluorescein. The accuracy for turbidity, over a 0 - 10 FTU range, is ± 0.02 FTU (or ± 3% of the reading, whichever is greater).
Further details are available from the Aquatracka MKIII specification sheet.
Biospherical Instruments QCP-2350 [underwater] PAR sensor
A cosine-corrected PAR quantum irradiance profiling sensor. For use in underwater applications with 24 bit ADC systems. Measures light available for photosynthesis on a flat surface. Operation is by a single channel compressed analog output voltage that is proportional to the log of incident PAR (400-700 nm) irradiance. The sensor is designed for operation in waters to depths of up to 2,000 m (standard) or 6,800 m (optional).
For more information, please see this document: https://www.bodc.ac.uk/data/documents/nodb/pdf/Biospherical_QCP2300_QCP2350_Apr2014.pdf
Tritech Digital Precision Altimeter PA200
This altimeter is a sonar ranging device that gives the height above the sea bed when mounted vertically. When mounted in any other attitude the sensor provides a subsea distance. It can be configured to operate on its own or under control from an external unit and can be supplied with simultaneous analogue and digital outputs, allowing them to interface to PC devices, data loggers, telemetry systems and multiplexers.
These instruments can be supplied with different housings, stainless steel, plastic and aluminum, which will limit the depth rating. There are three models available: the PA200-20S, PA200-10L and the PA500-6S, whose transducer options differ slightly.
Specifications
| Transducer options | PA200-20S | P200-10L | PA500-6S |
| Frequency (kHz) | 200 | 200 | 500 |
| Beamwidth (°) | 20 Conical | 10 included conical beam | 6 Conical |
| Operating range | 1 to 100 m 0.7 to 50 m | - | 0.3 to 50 m 0.1 to 10 m |
Common specifications are presented below
| Digital resolution | 1 mm |
| Analogue resolution | 0.25% of range |
| Depth rating | 700 , 2000, 4000 and 6800 m |
| Operating temperature | -10 to 40°C |
Further details can be found in the manufacturer's specification sheet.
WETLabs C-Star transmissometer
This instrument is designed to measure beam transmittance by submersion or with an optional flow tube for pumped applications. It can be used in profiles, moorings or as part of an underway system.
Two models are available, a 25 cm pathlength, which can be built in aluminum or co-polymer, and a 10 cm pathlength with a plastic housing. Both have an analog output, but a digital model is also available.
This instrument has been updated to provide a high resolution RS232 data output, while maintaining the same design and characteristics.
Specifications
| Pathlength | 10 or 25 cm |
| Wavelength | 370, 470, 530 or 660 nm |
| Bandwidth | ~ 20 nm for wavelengths of 470, 530 and 660 nm ~ 10 to 12 nm for a wavelength of 370 nm |
| Temperature error | 0.02 % full scale °C-1 |
| Temperature range | 0 to 30°C |
| Rated depth | 600 m (plastic housing) 6000 m (aluminum housing) |
Further details are available in the manufacturer's specification sheet or user guide.
JR16005 DynOPO CTD Data: BODC Processing
The CTD data were supplied to BODC as 85 MSTAR formatted NetCDF files, which were then converted to the BODC internal QXF NetCDF format.
During transfer the originator's variables were mapped to unique BODC parameter codes. The following table shows the parameter mapping.
| Originator's variable | Units | BODC Code | Units | Comments |
|---|---|---|---|---|
| altimeter | m | AHSFZZ01 | m | - |
| cond | mS/cm | CNCLCCI1 | S/m | /10 conversion from mS/cm to S/m applied. |
| cond1 cond2 | mS/cm | CNCLCCI2 | S/m | cond1 and cond2 are the second sensor conductivity channels for all casts except 117 and 117 only respectively. Parameter dropped from final file but are available upon request. /10 conversion from mS/cm to S/m applied. |
| depth | m | DEPHPR01 | m | - |
| fluor | µg/l | CPHLPR01 | mg m-3 | Units equivalent, no conversion required. |
| oxygen | µmol/kg | DOXYUCKG | µmol/kg | |
| par | µE m-2 s-1 | IRRDUV01 | µE m-2 s-1 | - |
| press | dbar | PRESPR01 | dbar | - |
| pressure_temp | degc90 | TEMPPRES | °C | - |
| psal | pss-78 | PSALCC01 | dimensionless | - |
| psal1 psal2 | pss-78 | PSALCC02 | dimensionless | psal1 and psal2 are the second sensor practical salinity channels for all casts except 117 and 117 only respectively. Parameter dropped from final file but are available upon request. |
| temp | degc90 | TEMPCC01 | °C | - |
| temp1 temp2 | degc90 | TEMPCC02 | °C | temp1 and temp2 are the second sensor temperature channels for all casts except 117 and 117 only respectively. Parameter dropped from final file but are available upon request. |
| transmittance | percent | POPTDR01 | % | - |
| - | - | POTMCV01 | °C | Derived by BODC using TEMPCC01, PSALCC01 and PRESPR01. |
| - | - | SIGTPR01 | kg m-3 | Derived by BODC using POTMCV01 and PSALCC01. |
| - | - | TOKGPR01 | L kg-1 | Derived by BODC using SIGTPR01. |
| - | - | DOXYSU01 | µmol/L | Derived by BODC using TOKGPR01 and DOXYUCKG. |
| - | - | OXYSSU01 | % | Derived by BODC using DOXYSU01, TEMPCC01 and PSALCC01. |
The following originator's variables were not transferred to BODC internal format, but are available on request:
- potemp, potemp1, potemp2 - this parameter is derived by BODC instead.
Following transfer the data were screened using BODC in-house visualisation software. Improbable data values were assigned the appropriate BODC data quality flag. Missing data values, where present, were changed to the missing data value and assigned a BODC data quality flag.
JR16005 DynOPO CTD Data: Originator's Processing
Sampling Strategy
A Sea-Bird Scientific SBE911plus CTD was mounted on a rosette with a SBE32 carousel water sampler. In total, 85 CTD profiles were completed on cruise JR16005 to produce full depth vertical profiles of temperature, conductivity, salinity, dissolved oxygen, fluorescence, transmittance and irradiance. Casts were deployed between 20 March to 01 May 2017.
Originator's processing
The initial SeaBird data conversion, align, and cell thermal mass corrections (alpha = 0.03, tau = 7.0000 on both primary and secondary) were performed using SBE Data Processing software version 7.22.3. The network data drive, legdata, was linked to ctd/ASCII_FILES/jcrfs_ctd and ctd_linkscript was used to copy files to fola and set up additional symbolic links to filenames following mstar convention. For each cast, the following m-files were then run, using wrapper script ctd_all_part1: mctd_01, mctd_02a, mctd_02b, mctd_03, mdcs_01, mdcs_02. The processes completed by these scripts include:
- read ASCII cnv data from ctd/ASCII_FILES/ctd_jr16005_nnn.cnv
- convert variable names from SBE names to MEXEC names using jr16005_renamelist.csv
- copy raw file to 24 hz file
- average to 1 hz
- calculate derived variables psal, potemp
- extract information from bottom of cast identified by maximum pressure
Subsequently, mdcs_03g was run to inspect the profiles and hand-select cast start and end times. The way oxygen time lag is handled in the SBE align algorithm, and the weak dependence of oxygen calculation on salinity, means that when air is ingested into the conductivity cell at the end of the cast, the oxygen becomes biased for a few seconds earlier than the psal. After selecting the limits for start and end, ctd_all_part2 was then run, executing mctd_04, mfir_01, mfir_02, mfir_03, mfir_04, mwin_01, mwin_03, and mwin_04. The processes completed by these scripts include:
- extract downcasts and upcasts using scan numbers stored in dcs_jr16005_nnn, and average into 2 dbar files (2db and 2up)
- read the data/ctd/ASCII_FILES/ctd_jr6005_nnn.bl file and extract scan numbers corresponding to bottle firing events
- pastes these data into the master sample file data/ctd/sam_jr16005_nnn.nc
- loads winch telemetry data from winch SCS file
- adds winch wireout data to the fir_jr16005_nnn file
- pastes winch wireout data into the master sample file
Processed data could then be examined using mctd_checkplots to view sensor and up-down cast differences as well as compare nearby profiles, with particular attention paid to any drift in temperature or salinity (expected to be relatively stable) over time. The 24 hz data were checked for spikes in either of the temperature or conductivity sensors using mctd_rawshow and, if necessary, edited using mctd_rawedit.
When temperature and conductivity calibrations became available, they were applied to the 24 hz files using mctd_tempcal and mctd_condcal. A subset of scripts should then be rerun, specifically mctd_02b, mctd_tempcal with senscal = 1, mctd_tempcal with senscal = 2, mctd_condcal with senscal = 1, mctd_condcal with senscal = 2, mctd_03, mctd04, mfir_03, mfir_04, and msam_updateall.
Problems
The CTD performed well throughout the cruise, no significant problems with the CTD operations were reported. After the calibrations, it was recommended that the secondary sensor data for temperature and conductivity should be used. The exception of station 117 where conductivity and temperature data should be used from the primary sensor. The oxygen sensor was coupled to the primary sensors, so the results are based on the measurements of the primary sensors during the whole cruise.
Additional Information
For further information on the CTD layout, originators data processing and sensor calibrations, please see the JR16005 cruise report.
Project Information
Dynamics of Orkney Passage Outflow (DynOPO)
DynOPO is a five year research project that aims to understand how Antarctic Bottom Water is exported and modified through the Orkney Passage, the overflow's controlling dynamics, and its downstream impact on the Atlantic Ocean abyss.
Introduction
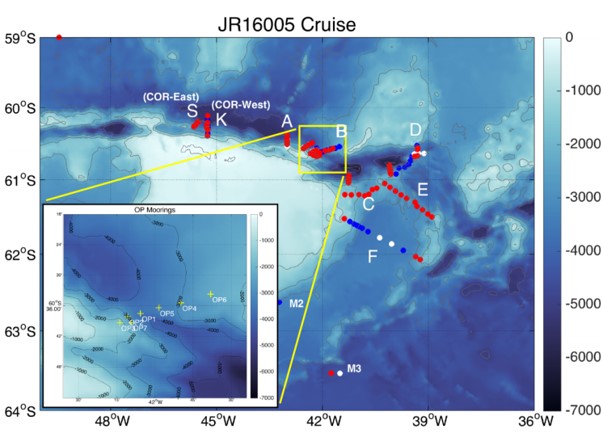
Mooring data collected for the DynOPO project are a component of a long term time series, in association with the Ocean Regulation of Climate by Heat and Carbon Sequestration and Transports (ORCHESTRA) project, led by Emily Shuckburgh (British Antarctic Survey) since 2016. The time series originally started out as part of the British Antarctic Survey's Long-Term Monitoring and Survey (LTMS) programme. Moorings were deployed on RRS James Clark Ross cruise JR20150309 (JR310 and JR272D) which ran from 09 March to 14 April 2015. RRS James Clark Ross cruise JR16005 ran from 17 March to 08 May 2017 and was the primary fieldwork element of the DynOPO project. The cruise had two main goals: (1) to conduct measurements of the hydrographic properties, velocity and turbulent processes of the Antarctic Bottom Water outflow along its pathway through the Orkney Passage region; and (2) to turn around a set of long-term moorings deployed in the area by British Antarctic Survey (BAS) and Lamont-Doherty Earth Observatory (LDEO) scientists, including recovery of additional instruments on some of the moorings deployed by JR20150309.
Project Collaborators
The project was led by the University of Southampton, and is an international collaboration with;
- UK: British Antarctic Survey (BAS), UK Meteorological Office, University of East Anglia and Newcastle University;
- Europe: University of Gothenburg (Sweden), University of Paris 6 (France);
- Australia: University of Tasmania;
- US: Lamont Doherty Earth Observatory, Woods Hole Oceanographic Institute, NOAA, University of California, Washington State University and Princeton University
Funding
The project was funded by the Natural Environment Research Council and ran from March 2015 to November 2018.
Data Activity or Cruise Information
Cruise
| Cruise Name | JR16005 |
| Departure Date | 2017-03-17 |
| Arrival Date | 2017-05-08 |
| Principal Scientist(s) | Alberto C Naveira Garabato (University of Southampton School of Ocean and Earth Science), Povl Abrahamsen (British Antarctic Survey) |
| Ship | RRS James Clark Ross |
Complete Cruise Metadata Report is available here
Fixed Station Information
No Fixed Station Information held for the Series
BODC Quality Control Flags
The following single character qualifying flags may be associated with one or more individual parameters with a data cycle:
| Flag | Description |
|---|---|
| Blank | Unqualified |
| < | Below detection limit |
| > | In excess of quoted value |
| A | Taxonomic flag for affinis (aff.) |
| B | Beginning of CTD Down/Up Cast |
| C | Taxonomic flag for confer (cf.) |
| D | Thermometric depth |
| E | End of CTD Down/Up Cast |
| G | Non-taxonomic biological characteristic uncertainty |
| H | Extrapolated value |
| I | Taxonomic flag for single species (sp.) |
| K | Improbable value - unknown quality control source |
| L | Improbable value - originator's quality control |
| M | Improbable value - BODC quality control |
| N | Null value |
| O | Improbable value - user quality control |
| P | Trace/calm |
| Q | Indeterminate |
| R | Replacement value |
| S | Estimated value |
| T | Interpolated value |
| U | Uncalibrated |
| W | Control value |
| X | Excessive difference |
SeaDataNet Quality Control Flags
The following single character qualifying flags may be associated with one or more individual parameters with a data cycle:
| Flag | Description |
|---|---|
| 0 | no quality control |
| 1 | good value |
| 2 | probably good value |
| 3 | probably bad value |
| 4 | bad value |
| 5 | changed value |
| 6 | value below detection |
| 7 | value in excess |
| 8 | interpolated value |
| 9 | missing value |
| A | value phenomenon uncertain |
| B | nominal value |
| Q | value below limit of quantification |
