Metadata Report for BODC Series Reference Number 380714
Metadata Summary
Problem Reports
Data Access Policy
Narrative Documents
Project Information
Data Activity or Cruise Information
Fixed Station Information
BODC Quality Flags
SeaDataNet Quality Flags
Metadata Summary
Data Description |
|||||||||||||||||||||||||
|
|||||||||||||||||||||||||
Data Identifiers |
|||||||||||||||||||||||||
|
|||||||||||||||||||||||||
Time Co-ordinates(UT) |
|||||||||||||||||||||||||
|
|||||||||||||||||||||||||
Spatial Co-ordinates | |||||||||||||||||||||||||
|
|||||||||||||||||||||||||
Parameters |
|||||||||||||||||||||||||
|
|||||||||||||||||||||||||
|
|||||||||||||||||||||||||
Problem Reports
No Problem Report Found in the Database
Data Access Policy
Public domain data
These data have no specific confidentiality restrictions for users. However, users must acknowledge data sources as it is not ethical to publish data without proper attribution. Any publication or other output resulting from usage of the data should include an acknowledgment.
The recommended acknowledgment is
"This study uses data from the data source/organisation/programme, provided by the British Oceanographic Data Centre and funded by the funding body."
Narrative Documents
Neil Brown MK3 CTD
The Neil Brown MK3 conductivity-temperature-depth (CTD) profiler consists of an integral unit containing pressure, temperature and conductivity sensors with an optional dissolved oxygen sensor in a pressure-hardened casing. The most widely used variant in the 1980s and 1990s was the MK3B. An upgrade to this, the MK3C, was developed to meet the requirements of the WOCE project.
The MK3C includes a low hysteresis, titanium strain gauge pressure transducer. The transducer temperature is measured separately, allowing correction for the effects of temperature on pressure measurements. The MK3C conductivity cell features a free flow, internal field design that eliminates ducted pumping and is not affected by external metallic objects such as guard cages and external sensors.
Additional optional sensors include pH and a pressure-temperature fluorometer. The instrument is no longer in production, but is supported (repair and calibration) by General Oceanics.
Specifications
These specification apply to the MK3C version.
| Pressure | Temperature | Conductivity | |
| Range | 6500 m 3200 m (optional) | -3 to 32°C | 1 to 6.5 S cm-1 |
| Accuracy | 0.0015% FS 0.03% FS < 1 msec | 0.0005°C 0.003°C < 30 msec | 0.0001 S cm-1 0.0003 S cm-1 < 30 msec |
Further details can be found in the specification sheet.
SeaTech Transmissometer
Introduction
The transmissometer is designed to accurately measure the the amount of light transmitted by a modulated Light Emitting Diode (LED) through a fixed-length in-situ water column to a synchronous detector.
Specifications
- Water path length: 5 cm (for use in turbid waters) to 1 m (for use in clear ocean waters).
- Beam diameter: 15 mm
- Transmitted beam collimation: <3 milliradians
- Receiver acceptance angle (in water): <18 milliradians
- Light source wavelength: usually (but not exclusively) 660 nm (red light)
Notes
The instrument can be interfaced to Aanderaa RCM7 current meters. This is achieved by fitting the transmissometer in a slot cut into a customized RCM4-type vane.
A red LED (660 nm) is used for general applications looking at water column sediment load. However, green or blue LEDs can be fitted for specilised optics applications. The light source used is identified by the BODC parameter code.
Further details can be found in the manufacturer's Manual.
RRS Charles Darwin Cruise 50 CTD Data Documentation
Introduction
Documentation for CTD data collected on RRS Charles Darwin Cruise 50 (June - July 1990) by the Institute of Oceanographic Sciences (Deacon Laboratory), Godalming, Surrey, UK, under the direction of P.M. Saunders.
Instrumentation
The instrument used was a Neil Brown Systems CTD which measured pressure, temperature and conductivity and was fitted with a Beckman dissolved oxygen electrode. The CTD was used alongside a General Oceanics Rosette Multisampler with 12 water bottles, a 10kHz pinger, a bottom echo-sounder and a SeaTech 1m path transmissometer. Lowering and retrieval rates of 0.5 to 1.5m/s were employed and the sensors were flushed with distilled water on recovery. Bottle samples and reversing thermometer measurements were made on ascent and sea water samples were analysed using a Guildline Autolab Salinometer.
Calibration
Pressure
The pre-calibration data for Charles Darwin 50 for pressure was obtained at a temperature of 20 °C on 10 May 1990 and was as follows:
P = 0.099662 * PRAW - 4.28E-7 * PRAW2 - 4.3
The calibration was obtained for increasing pressure and hence applies strictly to the downcast. The goodness of fit was 0.8 dbars and the deadweight employed was certified to an accuracy of 0.03 per cent full scale (i.e. 1.8 dbar at 6000 dbar). In the ocean, because of varying temperature, the following correction is applied:
PCOR = P - 0.39 (t1 -9)
where t1 is a lagged temperature, in °C, constructed from the CTD temperature data using a first order equation with a time constant of 400 seconds. This time constant and the temperature sensitivity of the pressure offset, 0.39 °C/dbar, were determined by laboratory trials. On the upcast, a further correction is made for the hysteresis of the pressure sensor (which can reach 5 dbar), again determined from laboratory measurements.
Temperature
The pre-cruise calibration for the temperature sensor, conducted with only partial immersion of the instrument, was found on 9 May 1990 as:
T = 0.9987 * TRAW - 0.014.
The goodness of fit of a 6 point calibration between 0.7 and +25 °C, was 0.5 milliK. Temperatures are given in the above calibration in °C on the ITS90 scale, which differ significantly from the IPTS68 scale only at the high end of the environmental temperatures (Saunders, 1990). For this cruise data comparisons may be made with earlier measurements without reference to the change in scale.
The mismatch between the slower time constant of the temperature sensor and the fast response of the conductivity sensor, which leads to salinity spikes, has been dealt with by correcting the temperature according to Procedure 1 described in Chapter 5 of the SCOR Working Group Report (Crease et al, 1988). A time constant of 0.25 seconds is assumed.
Comparisons were made with 7 digital reversing thermometers manufactured and calibrated by SIS, Kiel, Germany, and operated on the upcast by Niskin bottle closure in the usual manner. The mean difference of the 217 comparisons was -2.3 milliK with a standard error of ±0.8 milliK. The individual differences reveal that at pressures exceeding 500 dbars the differences tend to average closer to -5 milliK (with the reversing thermometers showing higher temperatures on average).
Conductivity/Salinity
On Station 1 the conductivity sensor failed and was replaced on retrieval, so no CTD salinities were obtained on this station. For stations 2 to 21 and 22 to 57 unique but different cell factors were used in calculating salinity for the CTD, i.e. 0.999535 and 0.9955 respectively (for p=0, T=15). The cell factor was assumed to vary with pressure and temperature in the manner described in the SCOR WG 51 report (Crease et al, 1988) with nominal values employed for the temperature expansion and pressure contraction coefficients of the cell material.
From the sample salinities measured on each station values of the apparent salinity difference SCTD - Ssample were constructed, where SCTD is the estimate taken on the upcast when stopped. A time series plot of the apparent salinity difference revealed slow drifts and small jumps in the CTD conductivity sensor response. Adjustments were made to CTD salinities, on a station by station basis. Despite, or perhaps because of, employing a brand new cell, the calibration drifted approximately 0.015 (in practical salinity units) during stations 2 to 21, then jumped 0.03; it remained stable for the rest of the cruise. After adjustment, the salinity differences were plotted as a function of pressure. No significant trend was found and the rms scatter around zero mean difference for the 490 comparisons was 0.0022.
Oxygen
CTD oxygen values were calculated using a standard algorithm found in Owens and Millard (1985). Parameters required from the CTD were selected on the downcast at the pressure corresponding to the upcast sample. A non- linear regression between these CTD parameters and the sample oxygen was performed: for this purpose the data set was divided into two approximately equal parts. No significant differences were found for each half of the data for the coefficient of temperature dependence (alpha), the coefficient of pressure dependence (beta) and fraction (the mix of ambient and oxygen cell temperatures). Values determined were alpha = -0.04148, beta = 0.000165 and fraction = 0.512. Both oxygen current lag and bias were set to zero, since non-zero values did not improve the fit. The cell factor was determined as 1.467. All of these values were used for the initial CTD oxygen determinations.
A time series plot of the apparent oxygen difference, OCTD - Osamp, revealed drifts and jumps. Adjustments were made to the CTD oxygens on a station by station basis. The range of adjustments is from -0.34 to 0.17 ml/l (i.e. about 0.5 ml/l). After adjustment, the individual oxygen differences were plotted versus pressure; the rms scatter around zero mean difference for the 490 comparisons was 0.08 ml/l (3.5 micromol/kg).
Transmittance
Potential transmittance, which takes account of the increasing mass of clear water in the 1 metre path of the instrument with increasing pressure, was calculated.
Data Processing
Original values were averaged over an interval of one second and calibration coefficients and correction factors applied.
Differences between successive values of each parameter were examined; the mean difference and its standard deviation calculated and values greater than several standard deviations from the mean difference were checked. Only a limited amount of editing of the data was required. Data were sorted on pressure, averaged at 2 dbars and missing values were interpolated. Derived quantities were computed from algorithms published by Fofonoff and Millard (1983).
References
Crease, J. et. al. 1988.
The acquisition, calibration and analysis of CTD data. UNESCO Technical Papers in Marine Science. No. 54, 96pp.
Fofonoff, N.P. and Millard, R.C. 1983.
Algorithms for computation of fundamental properties of seawater. UNESCO Technical Papers in Marine Science. No. 44, 53pp.
Owens, W.B. and Millard, R.C. 1985.
A new algorithm for CTD oxygen calibration. Journal of Physical Oceanography, 15, 621-631.
Saunders, P.M. 1990.
The International Temperature Scale 1990, ITS90. WOCE Newsletter No. 10, p10 (Unpublished Manuscript).
Saunders, P.M., Gould, W.G., Hydes, D.J. and Brandon, M.A. 1991.
CTDO and nutrient data from Charles Darwin Cruise 50 in the Iceland Faeroes region. Institute of Oceanographic Sciences Deacon Laboratory, Report No. 282, 74pp.
Project Information
No Project Information held for the Series
Data Activity or Cruise Information
Cruise
| Cruise Name | CD50 |
| Departure Date | 1990-06-29 |
| Arrival Date | 1990-07-22 |
| Principal Scientist(s) | W John Gould (Institute of Oceanographic Sciences Deacon Laboratory) |
| Ship | RRS Charles Darwin |
Complete Cruise Metadata Report is available here
Fixed Station Information
Fixed Station Information
| Station Name | Lousy Bank - Iceland Repeat Section: Station IB07 |
| Category | Offshore location |
| Latitude | 61° 7.93' N |
| Longitude | 14° 6.22' W |
| Water depth below MSL | 1765.0 m |
Lousy Bank - Iceland Repeat Section: Station IB07
Lousy Bank - Iceland Station IB07 is one of 20 fixed CTD stations, which together form the Lousy Bank - Iceland repeat survey line.
Related Fixed Station activities are detailed in Appendix 1
Fixed Station Information
| Station Name | Lousy Bank - Iceland Repeat Section |
| Category | Offshore route/traverse |
Lousy Bank - Iceland Repeat Section
The Lousy Bank - Iceland Repeat Section comprises 20 fixed CTD stations. The Section was first visited in 1962 and three subsequent research cruises during the 1990s.
Map of standard Lousy Bank - Iceland CTD Stations
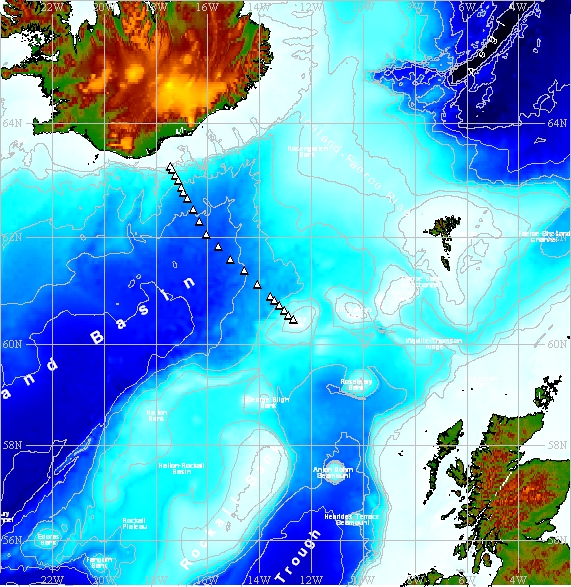
Map produced using the GEBCO Digital Atlas.
The white triangles indicate the nominal positions of each standard station on the Lousy Bank - Iceland Section.
Nominal station details
Lousy Bank - Iceland
| Station | Nominal latitude | Nominal longitude | Approx. depth (m) | Comment |
|---|---|---|---|---|
| IB01 | 60° 29.06' N | 12° 41.81' W | 406 | Lousy Bank |
| IB02 | 60° 33.7' N | 12° 52.92' W | 598 | |
| IB03 | 60° 39.19' N | 13° 2.62' W | 1037 | |
| IB04 | 60° 44.32' N | 13° 13.14' W | 1444 | |
| IB05 | 60° 50.62' N | 13° 25.4' W | 1657 | |
| IB06 | 60° 55.1' N | 13° 35.73' W | 1666 | |
| IB07 | 61° 7.93' N | 14° 6.22' W | 1765 | |
| IB08 | 61° 23.51' N | 14° 35.2' W | 2073 | |
| IB09 | 61° 36.15' N | 15° 6.74' W | 2150 | |
| IB10 | 61° 49.98' N | 15° 35.77' W | 2279 | |
| IB11 | 62° 3.27' N | 16° 3.84' W | 2230 | |
| IB12 | 62° 17.56' N | 16° 18.7' W | 2136 | |
| IB13 | 62° 30.11' N | 16° 33.21' W | 2059 | |
| IB14 | 62° 41.6' N | 16° 48.09' W | 1818 | |
| IB15 | 62° 48.32' N | 16° 55.35' W | 1675 | |
| IB16 | 62° 53.87' N | 17° 0.68' W | 1544 | |
| IB17 | 63° 0.56' N | 17° 7.81' W | 1278 | |
| IB18 | 63° 6.24' N | 17° 15.14' W | 1168 | |
| IB19 | 63° 12.33' N | 17° 21.77' W | 688 | |
| IB20 | 63° 15.72' N | 17° 25.84' W | 185 | Iceland |
Related Fixed Station activities are detailed in Appendix 2
BODC Quality Control Flags
The following single character qualifying flags may be associated with one or more individual parameters with a data cycle:
| Flag | Description |
|---|---|
| Blank | Unqualified |
| < | Below detection limit |
| > | In excess of quoted value |
| A | Taxonomic flag for affinis (aff.) |
| B | Beginning of CTD Down/Up Cast |
| C | Taxonomic flag for confer (cf.) |
| D | Thermometric depth |
| E | End of CTD Down/Up Cast |
| G | Non-taxonomic biological characteristic uncertainty |
| H | Extrapolated value |
| I | Taxonomic flag for single species (sp.) |
| K | Improbable value - unknown quality control source |
| L | Improbable value - originator's quality control |
| M | Improbable value - BODC quality control |
| N | Null value |
| O | Improbable value - user quality control |
| P | Trace/calm |
| Q | Indeterminate |
| R | Replacement value |
| S | Estimated value |
| T | Interpolated value |
| U | Uncalibrated |
| W | Control value |
| X | Excessive difference |
SeaDataNet Quality Control Flags
The following single character qualifying flags may be associated with one or more individual parameters with a data cycle:
| Flag | Description |
|---|---|
| 0 | no quality control |
| 1 | good value |
| 2 | probably good value |
| 3 | probably bad value |
| 4 | bad value |
| 5 | changed value |
| 6 | value below detection |
| 7 | value in excess |
| 8 | interpolated value |
| 9 | missing value |
| A | value phenomenon uncertain |
| B | nominal value |
| Q | value below limit of quantification |
Appendix 1: Lousy Bank - Iceland Repeat Section: Station IB07
Related series for this Fixed Station are presented in the table below. Further information can be found by following the appropriate links.
If you are interested in these series, please be aware we offer a multiple file download service. Should your credentials be insufficient for automatic download, the service also offers a referral to our Enquiries Officer who may be able to negotiate access.
| Series Identifier | Data Category | Start date/time | Start position | Cruise |
|---|---|---|---|---|
| 1071176 | CTD or STD cast | 1999-09-23 02:11:00 | 61.13217 N, 14.10367 W | RRS Discovery D242 |
| 1252562 | Water sample data | 1999-09-23 02:40:00 | 61.13217 N, 14.10367 W | RRS Discovery D242 |
Appendix 2: Lousy Bank - Iceland Repeat Section
Related series for this Fixed Station are presented in the table below. Further information can be found by following the appropriate links.
If you are interested in these series, please be aware we offer a multiple file download service. Should your credentials be insufficient for automatic download, the service also offers a referral to our Enquiries Officer who may be able to negotiate access.
| Series Identifier | Data Category | Start date/time | Start position | Cruise |
|---|---|---|---|---|
| 380578 | CTD or STD cast | 1990-07-12 19:40:00 | 60.4833 N, 12.6983 W | RRS Charles Darwin CD50 |
| 380609 | CTD or STD cast | 1990-07-12 21:18:00 | 60.5617 N, 12.885 W | RRS Charles Darwin CD50 |
| 380622 | CTD or STD cast | 1990-07-12 23:19:00 | 60.65 N, 13.05 W | RRS Charles Darwin CD50 |
| 380646 | CTD or STD cast | 1990-07-13 01:25:00 | 60.7367 N, 13.22 W | RRS Charles Darwin CD50 |
| 380671 | CTD or STD cast | 1990-07-13 03:51:00 | 60.8383 N, 13.43 W | RRS Charles Darwin CD50 |
| 380695 | CTD or STD cast | 1990-07-13 06:27:00 | 60.9183 N, 13.6033 W | RRS Charles Darwin CD50 |
| 380738 | CTD or STD cast | 1990-07-13 13:55:00 | 61.3883 N, 14.5933 W | RRS Charles Darwin CD50 |
| 380763 | CTD or STD cast | 1990-07-13 18:12:00 | 61.605 N, 15.1133 W | RRS Charles Darwin CD50 |
| 380787 | CTD or STD cast | 1990-07-13 21:58:00 | 61.8283 N, 15.6017 W | RRS Charles Darwin CD50 |
| 380806 | CTD or STD cast | 1990-07-14 07:14:00 | 62.0617 N, 16.06 W | RRS Charles Darwin CD50 |
| 380831 | CTD or STD cast | 1990-07-14 10:33:00 | 62.2967 N, 16.315 W | RRS Charles Darwin CD50 |
| 380855 | CTD or STD cast | 1990-07-14 15:40:00 | 62.5 N, 16.5617 W | RRS Charles Darwin CD50 |
| 380879 | CTD or STD cast | 1990-07-14 18:25:00 | 62.6883 N, 16.79 W | RRS Charles Darwin CD50 |
| 380892 | CTD or STD cast | 1990-07-14 20:43:00 | 62.805 N, 16.9017 W | RRS Charles Darwin CD50 |
| 380923 | CTD or STD cast | 1990-07-14 23:12:00 | 62.9 N, 17.015 W | RRS Charles Darwin CD50 |
| 380947 | CTD or STD cast | 1990-07-15 01:50:00 | 63.0067 N, 17.135 W | RRS Charles Darwin CD50 |
| 380984 | CTD or STD cast | 1990-07-15 07:14:00 | 63.2 N, 17.3683 W | RRS Charles Darwin CD50 |
| 1071060 | CTD or STD cast | 1999-09-19 03:53:00 | 63.262 N, 17.43067 W | RRS Discovery D242 |
| 1252433 | Water sample data | 1999-09-19 04:01:00 | 63.262 N, 17.43067 W | RRS Discovery D242 |
| 1071072 | CTD or STD cast | 1999-09-19 06:45:00 | 63.20533 N, 17.36283 W | RRS Discovery D242 |
| 1252445 | Water sample data | 1999-09-19 07:00:00 | 63.20533 N, 17.36283 W | RRS Discovery D242 |
| 1071084 | CTD or STD cast | 1999-09-19 09:48:00 | 63.104 N, 17.25233 W | RRS Discovery D242 |
| 1252457 | Water sample data | 1999-09-19 10:14:00 | 63.104 N, 17.25233 W | RRS Discovery D242 |
| 1071096 | CTD or STD cast | 1999-09-19 13:08:00 | 63.00933 N, 17.13017 W | RRS Discovery D242 |
| 1252469 | Water sample data | 1999-09-19 13:32:00 | 63.00933 N, 17.13017 W | RRS Discovery D242 |
| 1071103 | CTD or STD cast | 1999-09-20 06:21:00 | 62.89783 N, 17.01133 W | RRS Discovery D242 |
| 1252470 | Water sample data | 1999-09-20 06:47:00 | 62.89783 N, 17.01133 W | RRS Discovery D242 |
| 1071115 | CTD or STD cast | 1999-09-20 09:49:00 | 62.80533 N, 16.9225 W | RRS Discovery D242 |
| 1252482 | Water sample data | 1999-09-20 10:23:00 | 62.80533 N, 16.9225 W | RRS Discovery D242 |
| 1071871 | CTD or STD cast | 1999-09-20 13:54:00 | 62.69333 N, 16.80167 W | RRS Discovery D242 |
| 1252494 | Water sample data | 1999-09-20 14:23:00 | 62.69333 N, 16.80167 W | RRS Discovery D242 |
| 1071127 | CTD or STD cast | 1999-09-20 18:17:00 | 62.50183 N, 16.5535 W | RRS Discovery D242 |
| 1252501 | Water sample data | 1999-09-20 18:51:00 | 62.50183 N, 16.5535 W | RRS Discovery D242 |
| 1071139 | CTD or STD cast | 1999-09-20 22:47:00 | 62.29267 N, 16.31167 W | RRS Discovery D242 |
| 1252513 | Water sample data | 1999-09-20 23:26:00 | 62.29267 N, 16.31167 W | RRS Discovery D242 |
| 1071140 | CTD or STD cast | 1999-09-21 04:04:00 | 62.05433 N, 16.064 W | RRS Discovery D242 |
| 1252525 | Water sample data | 1999-09-21 04:40:00 | 62.05433 N, 16.064 W | RRS Discovery D242 |
| 1071152 | CTD or STD cast | 1999-09-22 11:44:00 | 61.83283 N, 15.59617 W | RRS Discovery D242 |
| 1252537 | Water sample data | 1999-09-22 12:19:00 | 61.83283 N, 15.59617 W | RRS Discovery D242 |
| 1071883 | CTD or STD cast | 1999-09-22 17:14:00 | 61.6025 N, 15.11233 W | RRS Discovery D242 |
| 1252549 | Water sample data | 1999-09-22 17:47:00 | 61.6025 N, 15.11233 W | RRS Discovery D242 |
| 1071164 | CTD or STD cast | 1999-09-22 21:39:00 | 61.39183 N, 14.58667 W | RRS Discovery D242 |
| 1252550 | Water sample data | 1999-09-22 22:11:00 | 61.39183 N, 14.58667 W | RRS Discovery D242 |
| 1071176 | CTD or STD cast | 1999-09-23 02:11:00 | 61.13217 N, 14.10367 W | RRS Discovery D242 |
| 1252562 | Water sample data | 1999-09-23 02:40:00 | 61.13217 N, 14.10367 W | RRS Discovery D242 |
| 1071188 | CTD or STD cast | 1999-09-23 05:58:00 | 60.91833 N, 13.59567 W | RRS Discovery D242 |
| 1252574 | Water sample data | 1999-09-23 06:26:00 | 60.91833 N, 13.59567 W | RRS Discovery D242 |
| 1071207 | CTD or STD cast | 1999-09-23 08:42:00 | 60.84367 N, 13.42333 W | RRS Discovery D242 |
| 1252586 | Water sample data | 1999-09-23 09:10:00 | 60.84367 N, 13.42333 W | RRS Discovery D242 |
| 1071219 | CTD or STD cast | 1999-09-23 11:58:00 | 60.73867 N, 13.219 W | RRS Discovery D242 |
| 1252598 | Water sample data | 1999-09-23 12:23:00 | 60.73867 N, 13.219 W | RRS Discovery D242 |
| 1071220 | CTD or STD cast | 1999-09-23 14:16:00 | 60.65317 N, 13.04367 W | RRS Discovery D242 |
| 1252605 | Water sample data | 1999-09-23 14:37:00 | 60.65317 N, 13.04367 W | RRS Discovery D242 |
| 1071232 | CTD or STD cast | 1999-09-23 16:24:00 | 60.56167 N, 12.88217 W | RRS Discovery D242 |
| 1252617 | Water sample data | 1999-09-23 16:42:00 | 60.56167 N, 12.88217 W | RRS Discovery D242 |
| 1071244 | CTD or STD cast | 1999-09-23 18:13:00 | 60.48433 N, 12.69683 W | RRS Discovery D242 |
| 1252629 | Water sample data | 1999-09-23 18:22:00 | 60.48433 N, 12.69683 W | RRS Discovery D242 |
