Metadata Report for BODC Series Reference Number 486391
Metadata Summary
Problem Reports
Data Access Policy
Narrative Documents
Project Information
Data Activity or Cruise Information
Fixed Station Information
BODC Quality Flags
SeaDataNet Quality Flags
Metadata Summary
Data Description |
|||||||||||||||||||||||||
|
|||||||||||||||||||||||||
Data Identifiers |
|||||||||||||||||||||||||
|
|||||||||||||||||||||||||
Time Co-ordinates(UT) |
|||||||||||||||||||||||||
|
|||||||||||||||||||||||||
Spatial Co-ordinates | |||||||||||||||||||||||||
|
|||||||||||||||||||||||||
Parameters |
|||||||||||||||||||||||||
|
|||||||||||||||||||||||||
|
|||||||||||||||||||||||||
Problem Reports
No Problem Report Found in the Database
Data Access Policy
Open Data
These data have no specific confidentiality restrictions for users. However, users must acknowledge data sources as it is not ethical to publish data without proper attribution. Any publication or other output resulting from usage of the data should include an acknowledgment.
If the Information Provider does not provide a specific attribution statement, or if you are using Information from several Information Providers and multiple attributions are not practical in your product or application, you may consider using the following:
"Contains public sector information licensed under the Open Government Licence v1.0."
Narrative Documents
Falmouth Scientific NXIC CTD Series
The FSI NXIC CTD Series is a collection of rugged Conductivity-Temperature-Depth profilers that utilise the patented Non-eXternal Inductive Cell (NXIC) conductivity sensor, which was originally developed for the US Navy DT-705 Sound Velocity/Salinity sensor. The CTDs are fast sampling, fully integrated instruments with optional battery power, datalogging and external analog sensor input.
Models in the collection include the NXIC CT Bio Direct Read-500M, NXIC CTD Bio Direct Read-500M, NXIC CTD Bio Auto-500M, NXIC CTD Direct Read-500M, NXIC CTD Direct Read-700M, NXIC CTD Auto-500M, NXIC CTD Auto-700M, NXIC CTD-ADC with external sensors, and the NXIC ETSG Thermosalinograph. Parameters are measured to an accuracy ranging from 0.002-0.010 mS/cm for conductivity, 0.005 degC for temperature and 0.08% for full scale pressure. Now marketed by Teledyne RD Instruments.
Specifications
| Conductivity | Temperature | Pressure | |
|---|---|---|---|
| Sensor type | Inductive cell | Thermistor | Precision-machined Silicon |
| Range | 0 to 9.0 S m-1 | -5 to 45°C | user specified |
| Accuracy | ± 0.0002 S m-1 | ± 0.005°C | 0.08 % full scale |
| Stability | ± 0.00005 S cm-1 month-1 | 0.0005°C month-1 | ± 0.004 % |
| Resolution | 0.00001 S m-1 | 0.001°C | 0.001 % full scale |
| Response | 5.0 cm at 1 m sec-1 flow | 100 msec | 25 msec |
Further details can be found in the manufacturer's specification sheet and Series Brochure.
Cirolana 10/94 CTD Data Documentation
Instrumentation
This cruise used the FSI CTD s/n 1322.
Sampling Protocol
The following is a presentation of the data returned from stations 38-296. 70 CTD profiles were obtained using the FSI CTD during the cruise. Samples were collected for salinity analysis.
Calibrations
Temperature
Left and right thermometer temperatures were available on 47 occasions. 6 pairs of thermometers had one result deleted, as their difference was >0.03. Also, 10 single thermometer results were available for comparison with CTD temperatures.
| Difference °C | No | Accumulative% |
|---|---|---|
| 0 - 0.01 | 29 | 62 |
| 0.01 - 0.02 | 6 | 74 |
| 0.02 - 0.03 | 6 | 87 |
| > 0.03 | 6 | 100 |
Thus, 74% of the differences are <0.02, the thermometer scale gradation.
Salinity
Duplicate water samples were collected on 13 occasions. 92% of the duplicates differed by <0.001. One water sample salinity was deleted from the only other pairs of duplicates.
Sensor Calibration for FSI CTD
Pressure
The following calibration, from 29 August 1994, was used to correct the FSI CTD pressure sensor:
P(cor) = 0.0000002613*P*P - 0.0023115193*P - 0.2189360031
Temperature
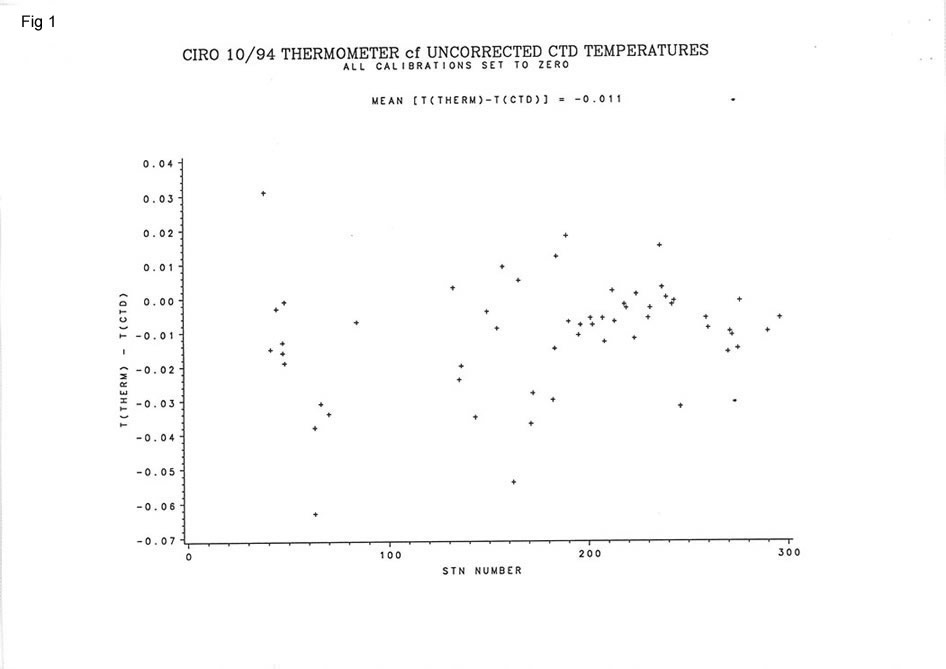
Fig 1 shows the difference between the mean thermometer and uncorrected CTD temperature, when the left/right thermometer difference was <0.03 deg C (57 occasions). The mean difference calculated for these 57 instances was - 0.011. (Two thermometer results were deleted since the difference between thermometer and CTD temperature was >0.05, leaving 55 differences.)
The slow sensor was corrected using the laboratory calibration coefficients obtained on 29 August 1994.
T(cor) = T(ctd) - 0.006
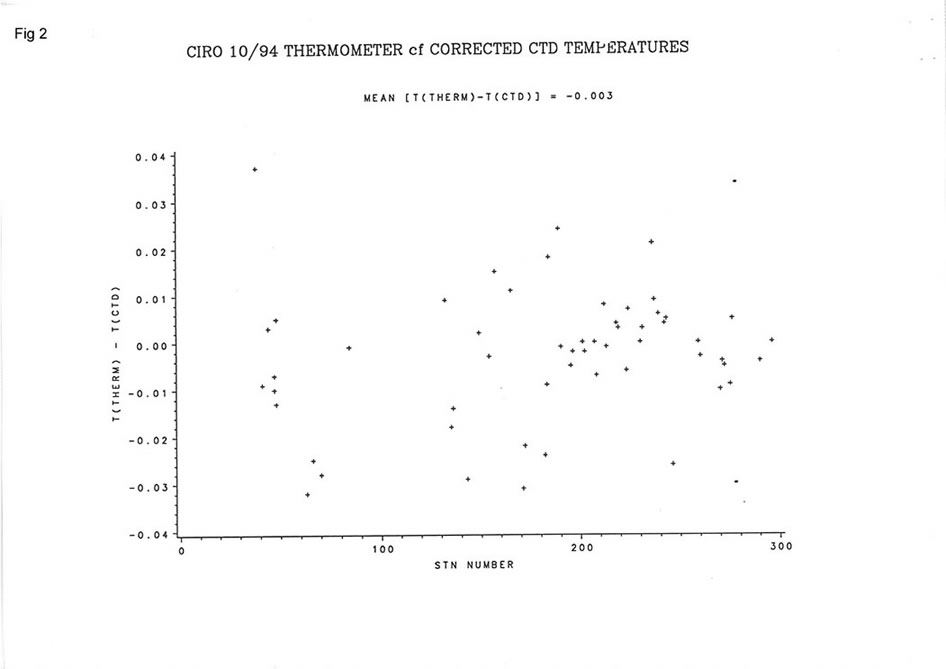
Fig 2 shows the differences between the 55 thermometer and CTD temperatures after the latter have been corrected. The mean difference is -0.003 deg C and 52 of the differences lie within 0.03 deg C supporting the belief that if the thermometers are accurate to 0.02 °C then the CTD temperatures are accurate to 0.01 °C. The fast temperature was used to calculate CTD salinity values in the profiles, and it was found that a correction for pressure should be included in the calibration of the fast sensor at deep stations.
The fast sensor was calibrated using the following coefficients from early 1996.
Tfast(cor) = Tfast + 0.179753338e-2*Tfast + 0.255828043e-4*Ptrue - 0.020226
Salinity
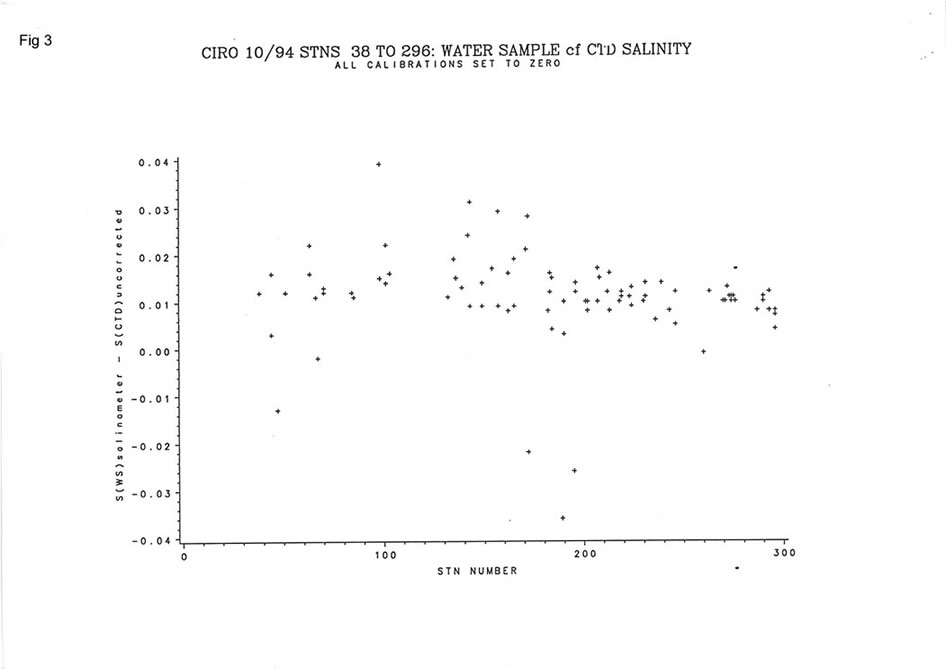
Fig 3 shows the difference between the water sample salinity as measured with the salinometer and that derived from the CTD, for all samples and before any calibrations have been applied to the latter's sensors. 13 CTD salinities were removed since the difference between the CTD salinity and water sample salinity was >0.04. 4 other CTD salinities were erroneous and also not used in the calibration. Fig 3 suggests the CTD tends to under- estimate salinity.
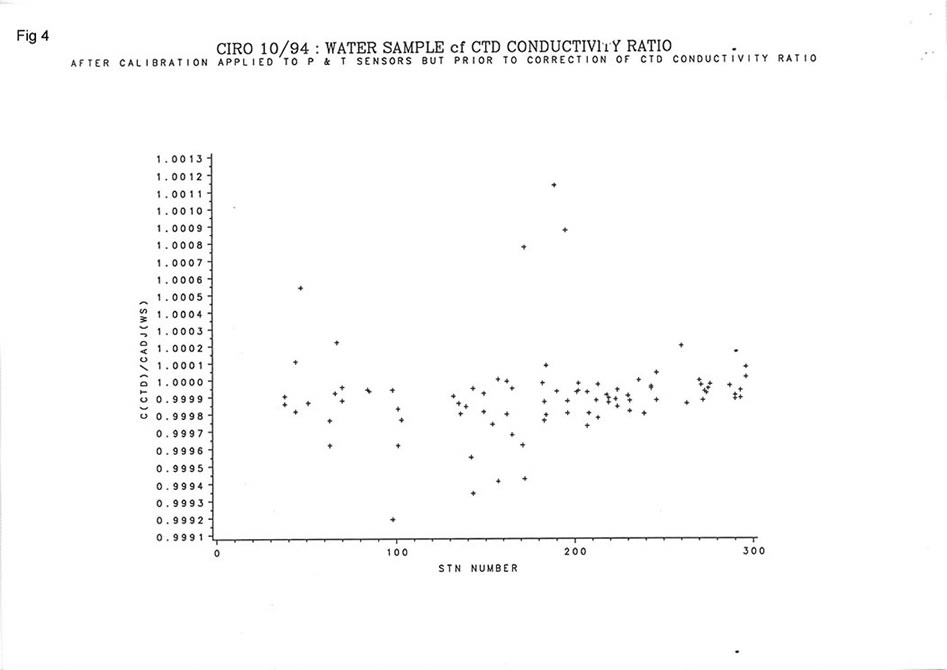
Fig 4 shows the ratio of CTD:Water sample conductivity ratio after the CTD pressure and temperature sensors have been corrected using the above coefficients. A set of coefficients has been derived to calibrate the CTD conductivity sensor, using a least square fit between the ratio of water sample and CTD conductivity, and the CTD temperature and pressure.
CR(cor) = CR(ctd)*[a*T(cor) + b*P(cor) + c]
where:
T(cor) and P(cor) are the corrected CTD temperature and pressure
a = -0.1250498816e-04
b = -0.862936987e-07
c = 1.000199981
rms salinity difference between water sample and corrected CTD is 0.006 for 84 data values.
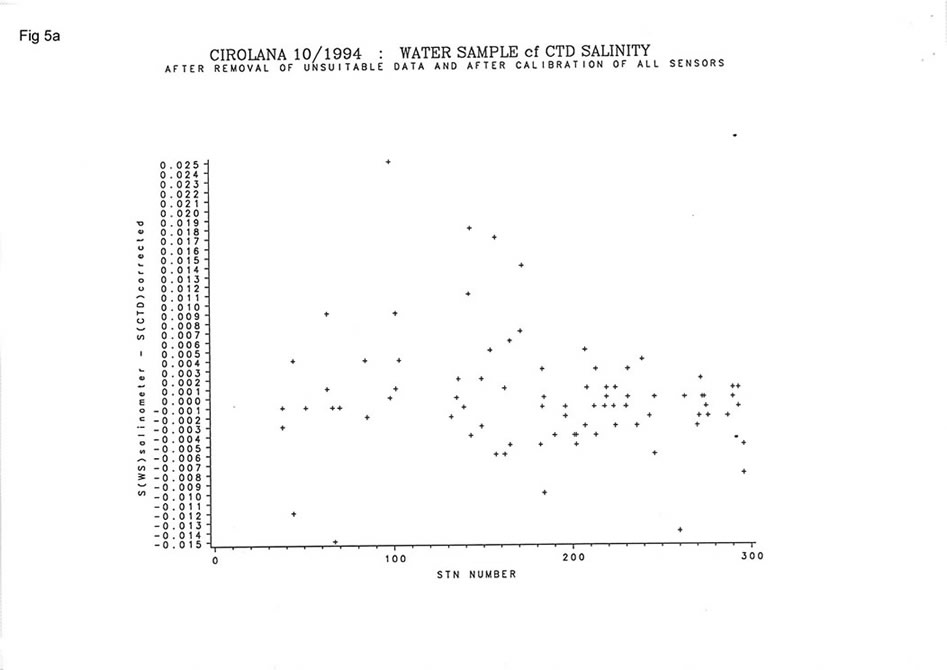
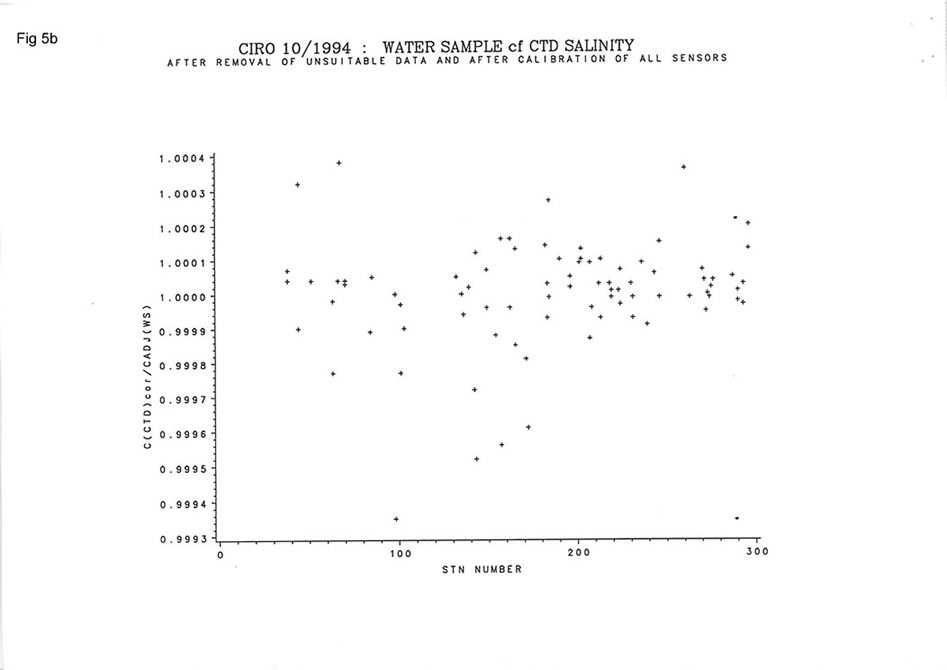
Figs 5a and 5b illustrate how effective the CTD conductivity and derived salinity have been corrected.
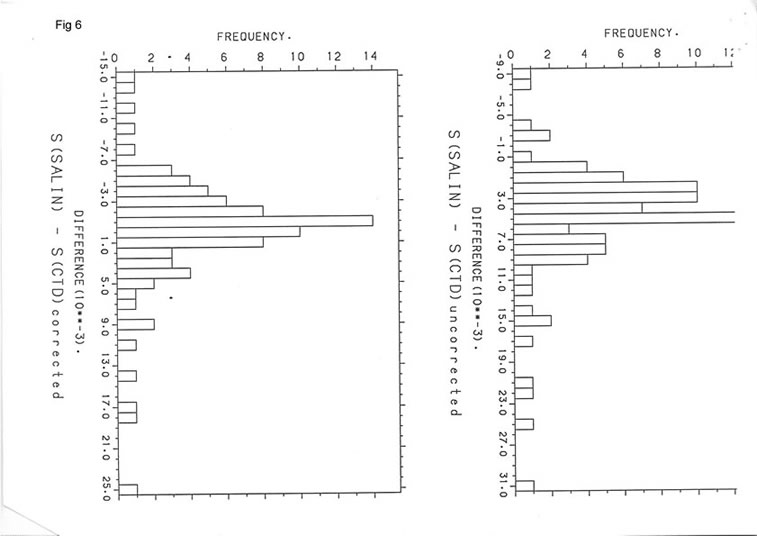
The histograms in Fig 6 show how well the CTD conductivity is corrected since the upper frame has been derived after the CTD temperature and pressure have been corrected, but before the CTD conductivity calibration has been applied.
If it is assumed that the salinometer is accurate to 0.006 and the CTD salinity to 0.01, then differences between 0.016 are acceptable. Only 3 values lie outside this range after the calibrations have been applied.
Transmission/suspended load
A 25 cm path length transmissometer was mounted on the rosette at each CTD station. However, 3 CTD stations failed to record transmission: stations 172, 182 and 183.
The CTD was not calibrated in terms of suspended load, as it was not possible to take sufficient suspended load samples during the cruise. Therefore, the CTD profiles contain %transmission only.
Sue Norris (amended 25/6/96)
Project Information
No Project Information held for the Series
Data Activity or Cruise Information
Cruise
| Cruise Name | CIR10/94 |
| Departure Date | 1994-09-02 |
| Arrival Date | 1994-10-05 |
| Principal Scientist(s) | Kinson S Leonard (Ministry of Agriculture, Fisheries and Food Lowestoft Fisheries Laboratory) |
| Ship | RV Cirolana |
Complete Cruise Metadata Report is available here
Fixed Station Information
No Fixed Station Information held for the Series
BODC Quality Control Flags
The following single character qualifying flags may be associated with one or more individual parameters with a data cycle:
| Flag | Description |
|---|---|
| Blank | Unqualified |
| < | Below detection limit |
| > | In excess of quoted value |
| A | Taxonomic flag for affinis (aff.) |
| B | Beginning of CTD Down/Up Cast |
| C | Taxonomic flag for confer (cf.) |
| D | Thermometric depth |
| E | End of CTD Down/Up Cast |
| G | Non-taxonomic biological characteristic uncertainty |
| H | Extrapolated value |
| I | Taxonomic flag for single species (sp.) |
| K | Improbable value - unknown quality control source |
| L | Improbable value - originator's quality control |
| M | Improbable value - BODC quality control |
| N | Null value |
| O | Improbable value - user quality control |
| P | Trace/calm |
| Q | Indeterminate |
| R | Replacement value |
| S | Estimated value |
| T | Interpolated value |
| U | Uncalibrated |
| W | Control value |
| X | Excessive difference |
SeaDataNet Quality Control Flags
The following single character qualifying flags may be associated with one or more individual parameters with a data cycle:
| Flag | Description |
|---|---|
| 0 | no quality control |
| 1 | good value |
| 2 | probably good value |
| 3 | probably bad value |
| 4 | bad value |
| 5 | changed value |
| 6 | value below detection |
| 7 | value in excess |
| 8 | interpolated value |
| 9 | missing value |
| A | value phenomenon uncertain |
| B | nominal value |
| Q | value below limit of quantification |
