Metadata Report for BODC Series Reference Number 488729
Metadata Summary
Problem Reports
Data Access Policy
Narrative Documents
Project Information
Data Activity or Cruise Information
Fixed Station Information
BODC Quality Flags
SeaDataNet Quality Flags
Metadata Summary
Data Description |
|||||||||||||||||||||||||||||
|
|||||||||||||||||||||||||||||
Data Identifiers |
|||||||||||||||||||||||||||||
|
|||||||||||||||||||||||||||||
Time Co-ordinates(UT) |
|||||||||||||||||||||||||||||
|
|||||||||||||||||||||||||||||
Spatial Co-ordinates | |||||||||||||||||||||||||||||
|
|||||||||||||||||||||||||||||
Parameters |
|||||||||||||||||||||||||||||
|
|||||||||||||||||||||||||||||
|
|||||||||||||||||||||||||||||
Problem Reports
No Problem Report Found in the Database
Data Access Policy
Open Data
These data have no specific confidentiality restrictions for users. However, users must acknowledge data sources as it is not ethical to publish data without proper attribution. Any publication or other output resulting from usage of the data should include an acknowledgment.
If the Information Provider does not provide a specific attribution statement, or if you are using Information from several Information Providers and multiple attributions are not practical in your product or application, you may consider using the following:
"Contains public sector information licensed under the Open Government Licence v1.0."
Narrative Documents
Falmouth Scientific Integrated CTD (ICTD) Profiler
The FSI ICTD is designed to collect high precision conductivity, temperature and pressure data with self calibrating electronics. This instrument can support five primary sensors (including up to three temperature sensors) and can be coupled with a water bottle sampler. The ICTD is equipped with a titanium housing rated to 7000 m and has a sampling rate of 32 Hz.
Three temperature sensors are available: primary platinum, redundant platinum and exposed thermistor. Any combination of these can be used in the primary channels. The instrument also has multiple RS-232 serial inputs for a variety of sensors including: ADCP, Benthos PSA-916 Altimeter and WetLabs SAFire. There are an additional eight DC input channels that can support virtually any sensor that has a DC output.
Specifications:
| Parameter | Conductivity | Temperature | Pressure |
| Sensor | Inductive cell | Platinum thermometer | Precision-machined Silicon |
| Range | 0 to 70 mS cm-1 | -2 to 35°C | Customer specified |
| Accuracy | ±0.002 mS cm-1 | 0.002°C | ±0.01 % full scale |
| Resolution | 0.0001 mS cm-1 | 0.00005°C | 0.0004 % full scale |
| Response | 5.0 cm at 1 ms-1 | 150 ms Platinum 20 ms Thermistor* | 25 ms |
*Optional
Further details can be found in the manufacturer's specification sheet.
Cirolana 6/94 CTD Data
Instrumentation and Protocols
This cruise used the FSI CTD s/n 1343. The following is a presentation of the data returned from stations 85-99. 10 CTD profiles were obtained using the FSI CTD during the cruise. Samples were collected for salinity analysis. No thermometers were used on this cruise.
Duplicate water samples were collected on 3 occasions, and also 17 single water samples were analysed with a salinometer. All of the duplicates differed by <0.003.
Sensor Calibration for FSI CTD
Pressure
The following calibration, from 7 June 1994 at 18 °C, was used to correct the FSI CTD pressure sensor:
P(cor) = P(ctd) + 1.3 db
Temperature
The sensor was corrected using the laboratory calibration coefficients obtained on 12 May 1994:
T(cor) = T(ctd) + 0.001
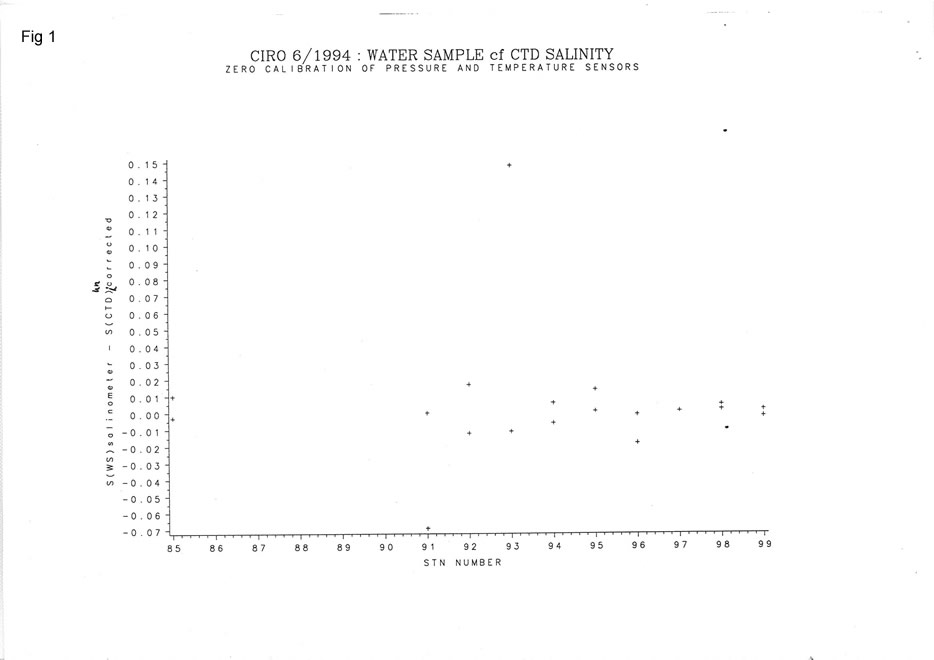
Salinity
Fig. 1 shows the difference between the water sample salinity as measured with the salinometer and that derived from the CTD, for all samples and before any calibrations have been applied to the latter's sensors. Stations 91, 93 and 96 showed possible erroneous CTD salinity values and were not used in the calibration.
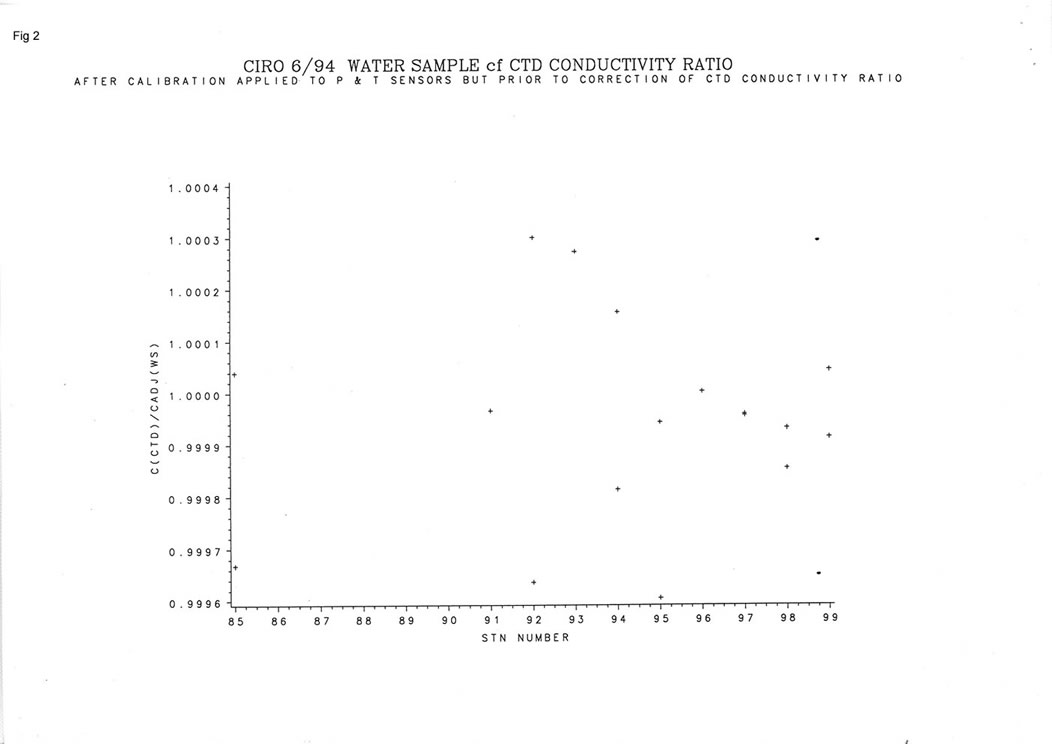
Fig. 2 shows the ratio of CTD:Water sample conductivity ratio after the CTD pressure and temperature sensors have been corrected using the above coefficients. A set of coefficients has been derived to calibrate the CTD conductivity sensor, using a least square fit between the ratio of water sample and CTD conductivity, and the CTD temperature and pressure.
CR(cor) = CR(ctd)*[a*T(cor) + b*P(cor) + c]
where:
T(cor) and P(cor) are the corrected CTD temperature and pressure
a = 0.313091461e-03
b = -0.174738693e-04
c = 0.997011968
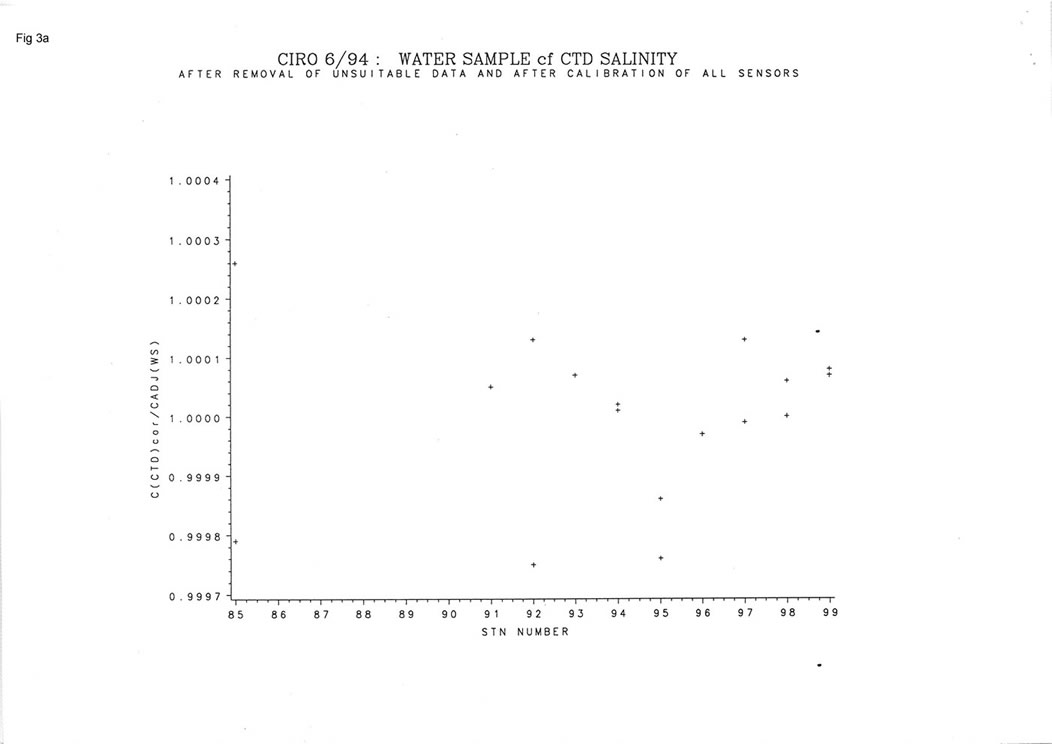
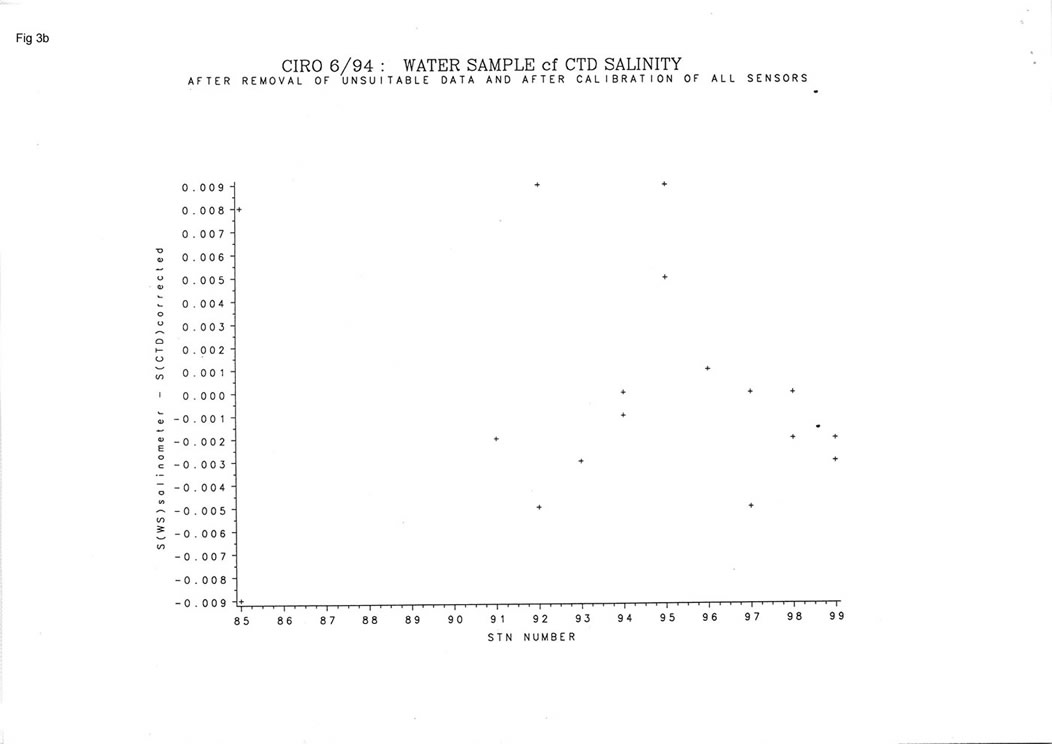
RMS salinity difference between water sample and corrected CTD is 0.005 for 17 data values.
Figs. 3a and 3b illustrate how effective the CTD conductivity and derived salinity have been corrected.
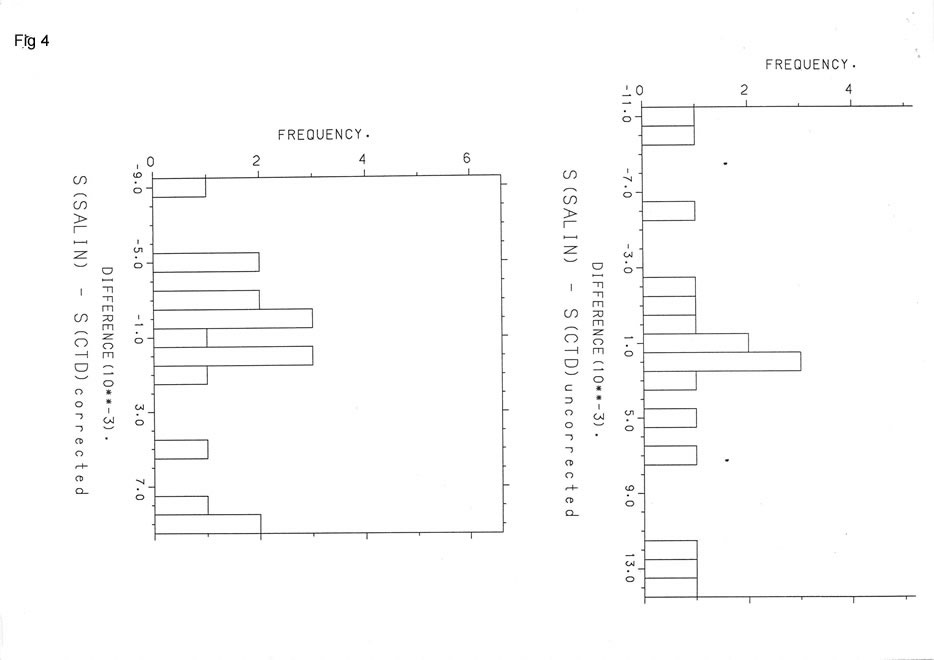
The histograms in Fig. 4 show how well the CTD conductivity is corrected since the upper frame has been derived after the CTD temperature and pressure have been corrected, but before the CTD conductivity calibration has been applied.
If it is assumed that the salinometer is accurate to 0.006 and the CTD salinity to 0.01, then differences between 0.016 are acceptable. 100% of the values lie within this range after the calibrations have been applied.
Transmission and Suspended Load
A 25 cm path length transmissometer was mounted on the rosette at each CTD station. The instrument was calibrated in terms of suspended load (mg/1) by comparing the logged %transmission with laboratory determinations of suspended load.
suspended load = a*loge(%Trans) + b
where
a = -12.2
b = 50.8
Sue Norris 27/09/94
Project Information
No Project Information held for the Series
Data Activity or Cruise Information
Cruise
| Cruise Name | CIR6/94 |
| Departure Date | 1994-05-17 |
| Arrival Date | 1994-06-03 |
| Principal Scientist(s) | Kinson S Leonard (Ministry of Agriculture, Fisheries and Food Lowestoft Fisheries Laboratory) |
| Ship | RV Cirolana |
Complete Cruise Metadata Report is available here
Fixed Station Information
No Fixed Station Information held for the Series
BODC Quality Control Flags
The following single character qualifying flags may be associated with one or more individual parameters with a data cycle:
| Flag | Description |
|---|---|
| Blank | Unqualified |
| < | Below detection limit |
| > | In excess of quoted value |
| A | Taxonomic flag for affinis (aff.) |
| B | Beginning of CTD Down/Up Cast |
| C | Taxonomic flag for confer (cf.) |
| D | Thermometric depth |
| E | End of CTD Down/Up Cast |
| G | Non-taxonomic biological characteristic uncertainty |
| H | Extrapolated value |
| I | Taxonomic flag for single species (sp.) |
| K | Improbable value - unknown quality control source |
| L | Improbable value - originator's quality control |
| M | Improbable value - BODC quality control |
| N | Null value |
| O | Improbable value - user quality control |
| P | Trace/calm |
| Q | Indeterminate |
| R | Replacement value |
| S | Estimated value |
| T | Interpolated value |
| U | Uncalibrated |
| W | Control value |
| X | Excessive difference |
SeaDataNet Quality Control Flags
The following single character qualifying flags may be associated with one or more individual parameters with a data cycle:
| Flag | Description |
|---|---|
| 0 | no quality control |
| 1 | good value |
| 2 | probably good value |
| 3 | probably bad value |
| 4 | bad value |
| 5 | changed value |
| 6 | value below detection |
| 7 | value in excess |
| 8 | interpolated value |
| 9 | missing value |
| A | value phenomenon uncertain |
| B | nominal value |
| Q | value below limit of quantification |
