Metadata Report for BODC Series Reference Number 595346
Metadata Summary
Problem Reports
Data Access Policy
Narrative Documents
Project Information
Data Activity or Cruise Information
Fixed Station Information
BODC Quality Flags
SeaDataNet Quality Flags
Metadata Summary
Data Description |
|||||||||||||||||||||||||||||
|
|||||||||||||||||||||||||||||
Data Identifiers |
|||||||||||||||||||||||||||||
|
|||||||||||||||||||||||||||||
Time Co-ordinates(UT) |
|||||||||||||||||||||||||||||
|
|||||||||||||||||||||||||||||
Spatial Co-ordinates | |||||||||||||||||||||||||||||
|
|||||||||||||||||||||||||||||
Parameters |
|||||||||||||||||||||||||||||
|
|||||||||||||||||||||||||||||
|
|||||||||||||||||||||||||||||
Problem Reports
In the salinity channel there are large spikes and null values that have been flagged on the thermocline. This could be due to a mismatch between the conductivity cell and the thermistor.
Data Access Policy
Open Data
These data have no specific confidentiality restrictions for users. However, users must acknowledge data sources as it is not ethical to publish data without proper attribution. Any publication or other output resulting from usage of the data should include an acknowledgment.
If the Information Provider does not provide a specific attribution statement, or if you are using Information from several Information Providers and multiple attributions are not practical in your product or application, you may consider using the following:
"Contains public sector information licensed under the Open Government Licence v1.0."
Narrative Documents
Falmouth Scientific Integrated CTD (ICTD) Profiler
The FSI ICTD is designed to collect high precision conductivity, temperature and pressure data with self calibrating electronics. This instrument can support five primary sensors (including up to three temperature sensors) and can be coupled with a water bottle sampler. The ICTD is equipped with a titanium housing rated to 7000 m and has a sampling rate of 32 Hz.
Three temperature sensors are available: primary platinum, redundant platinum and exposed thermistor. Any combination of these can be used in the primary channels. The instrument also has multiple RS-232 serial inputs for a variety of sensors including: ADCP, Benthos PSA-916 Altimeter and WetLabs SAFire. There are an additional eight DC input channels that can support virtually any sensor that has a DC output.
Specifications:
| Parameter | Conductivity | Temperature | Pressure |
| Sensor | Inductive cell | Platinum thermometer | Precision-machined Silicon |
| Range | 0 to 70 mS cm-1 | -2 to 35°C | Customer specified |
| Accuracy | ±0.002 mS cm-1 | 0.002°C | ±0.01 % full scale |
| Resolution | 0.0001 mS cm-1 | 0.00005°C | 0.0004 % full scale |
| Response | 5.0 cm at 1 ms-1 | 150 ms Platinum 20 ms Thermistor* | 25 ms |
*Optional
Further details can be found in the manufacturer's specification sheet.
Seapoint Chlorophyll Fluorometer
The Seapoint Chlorophyll Fluorometer (SCF) is a low power instrument for in situ measurements of chlorophyll a. The SCF uses modulated blue LED lamps and a blue excitation filter to excite chlorophyll a. The fluorescent light emitted by the chlorophyll a passes through a red emission filter and is detected by a silicon photodiode. The low level signal is then processed using synchronous demodulation circuitry which generates an output voltage proportional to chlorophyll a concentration. The SCF may be operated with or without a pump.
Sensor specifications, current at August 2006, are given in the table below. More information can be found at the manufacturer's web site.
Sensor Specifications
| Power requirements | 8 - 20 VDC, 15 mA avg., 27 mA pk. |
|---|---|
| Output | 0 - 5.0 VDC |
| Output Time Constant | 0.1 sec. |
| Power-up transient period | < 1 sec. |
| Excitation Wavelength | 470 nm CWL, 30 nm FWHM |
| Emission Wavelength | 685 nm CWL, 30 nm FWHM |
| Sensing Volume | 340 mm3 |
| Minimum Detectable Level | 0.02 µg l-1 |
| Gain | Sensitivity, V µg-1 l-1 | Range, µg l-1 | |
|---|---|---|---|
| Sensitivity/Range | 30x 10x 3x 1x | 1.0 0.33 0.1 0.033 | 5 15 50 150 |
LI-COR LI-192 Underwater Quantum Sensor
The LI-192 Underwater Quantum Sensor is used to measure photosynthetic photon flux density and is cosine corrected. The sensor is often referred to as LI-192SA or LI-192SB (the LI-192SB model was superseded by LI-192SA). One of the main differences is that the LI-192SA model includes a built-in voltage output for interfacing with NexSens iSIC and SDL data loggers.
Sensor specifications, current at January 2012, are given in the table below. More information can be found in the manufacturer's LI-192SA andLI-192SB specification sheets.
Sensor Specifications
(Specifications apply to both models unless otherwise stated)
| Absolute Calibration | ± 5 % in air traceable to NBS. |
|---|---|
| Sensitivity | Typically 3 µA per 1000 µmol s-1 m-2 for LI-192SB and 4 µA per 1000 µmol s-1 m-2 for LI-192SA in water. |
| Linearity | Maximum deviation of 1 % up to 10,000 µmol s-1 m-2. |
| Stability | < ± 2 % change over a 1 year period. |
| Response Time | 10 µs. |
| Temperature Dependence | ± 0.15 % per °C maximum. |
| Cosine Correction | Optimized for both underwater and atmospheric use. |
| Azimuth | < ± 1 % error over 360 ° at 45 ° elevation. |
| Detector | High stability silicon photovoltaic detector (blue enhanced). |
| Sensor Housing | Corrosion resistant metal with acrylic diffuser for both saltwater and freshwater applications. Waterproof to withstand 800 psi (5500 kPa) (560 meters). |
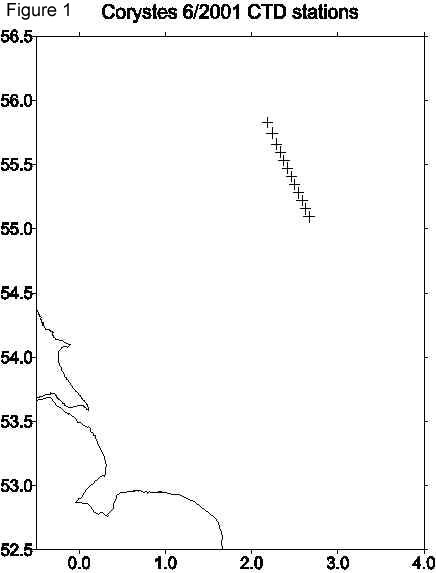
RV Corystes Cruise 06/01 CTD Data Documentation
15 full depth CTD profiles were obtained using a FSI CTD s/n 1366 during this cruise to the North Sea during June 2001; see Figure1.
Samples were collected for salinity analysis (using a Guildline salinometer) to derive a calibration for the instrument conductivity sensor and a single pair of digital reversing thermometers used to compare with the CTD temperature estimates. A Seapoint fluorometer sensor and a LICOR photosynthetically active radiation sensor with a six-decade log amplifier were fitted to the rosette. An oxygen sensor was also fitted but failed to work correctly. Chlorophyll samples were collected to calibrate the fluorometer.
(a) Pressure
The pressure sensor was calibrated using a dead-weight tester on 2/01/2001 at 8 degC and atmospheric pressure 982mb. This suggested that the CTD sensor was reading too low by 2.0db. During the cruise the 'on deck' CTD pressure immediately prior to lowering the CTD was recorded. This consistently indicated that the sensor was reading too low by approximately 2.5db and these 'on deck' observations have been used to correct recorded CTD pressure:
P(cor) = P(unc) + dP
Where dP= 2.5db
(b) Temperature
The PRT temperature sensor fitted to the CTD was calibrated using PRT's on 11/06/2001, and this was used to correct the CTD temperature :
T(cor) = T(unc) + dT
dT = a*T(unc)*T(unc) + b*T(unc) + c
where a = 1.7884e-5 b = -7.0875e-4 c = 6.5652e-3
This is equivalent to a correction between 3 and 0 millidegC in the range 6 to14 degC.
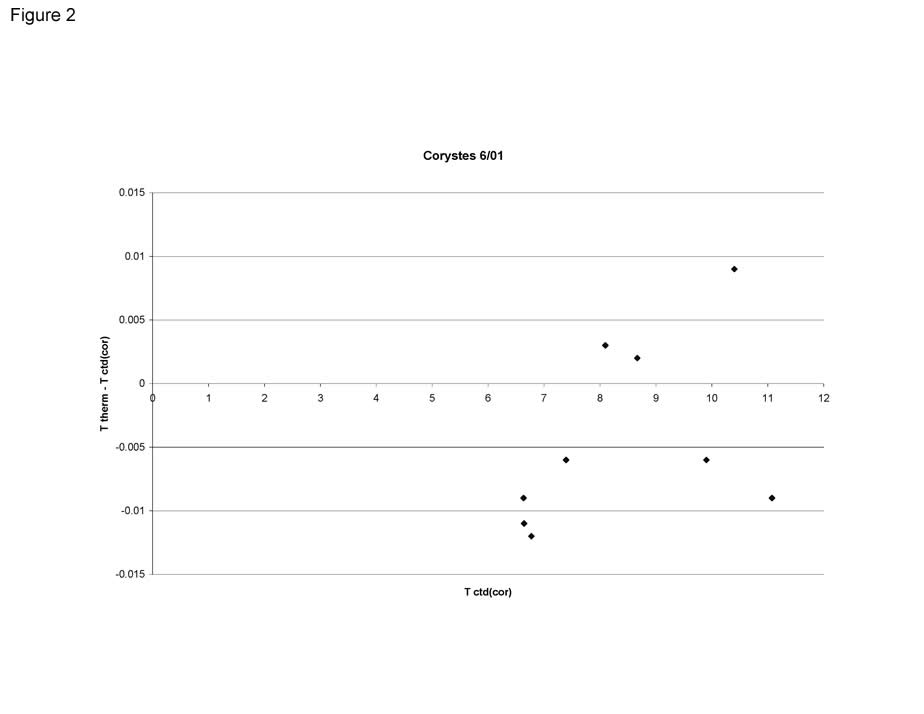
A pair of electronic thermometers were fitted to one Niskin bottle, sampling close to the seabed. The difference between the temperatures from thermometers and CTD is plotted in Figure 2. The mean difference of -4 millidegC is smaller than previous comparisons, but there were only 9 data points.
(c) Conductivity
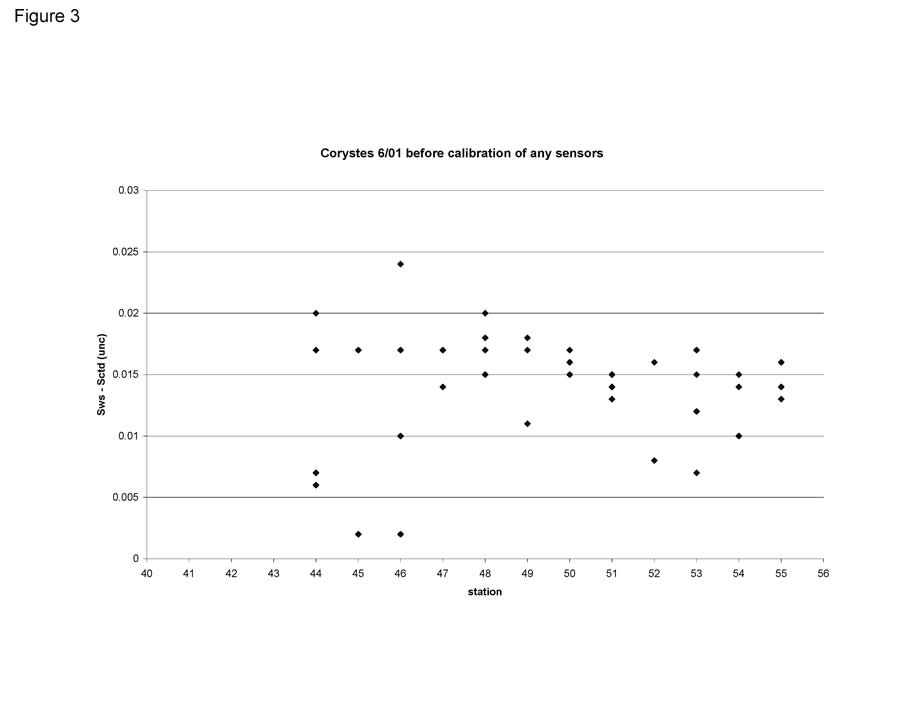
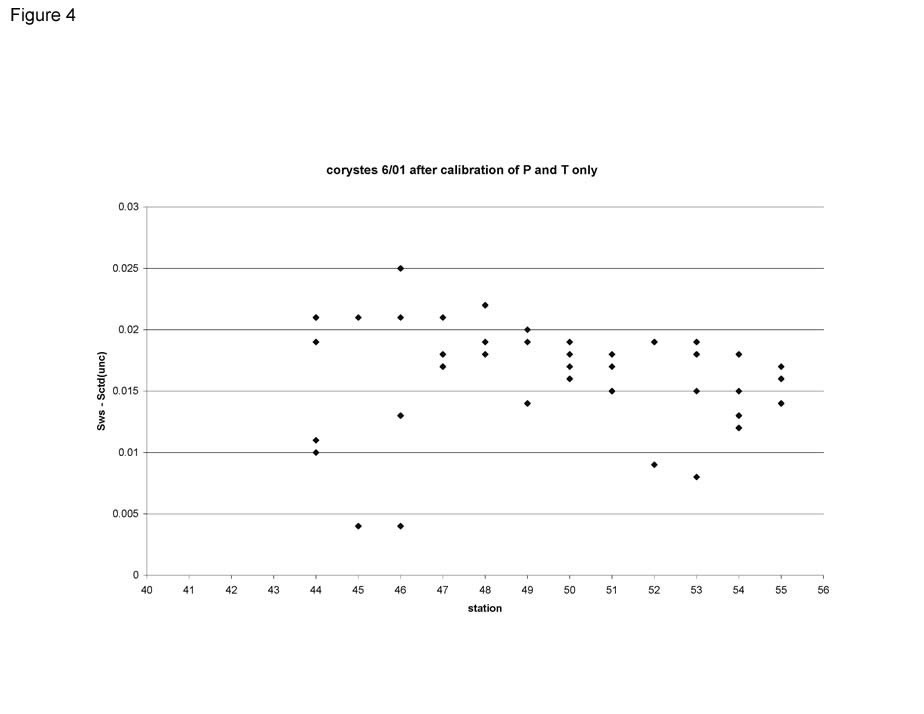
The difference between salinometer and CTD salinity before any corrections are applied to the sensors is plotted in Figure 3. The CTD salinity is an under-estimate with a mean difference of 0.014 (the same as when the CTD was used during Corystes 1/01). This offset increases to 0.016 after the pressure and temperature calibrations have been applied, standard deviation 0.005, as shown in Figure 4.
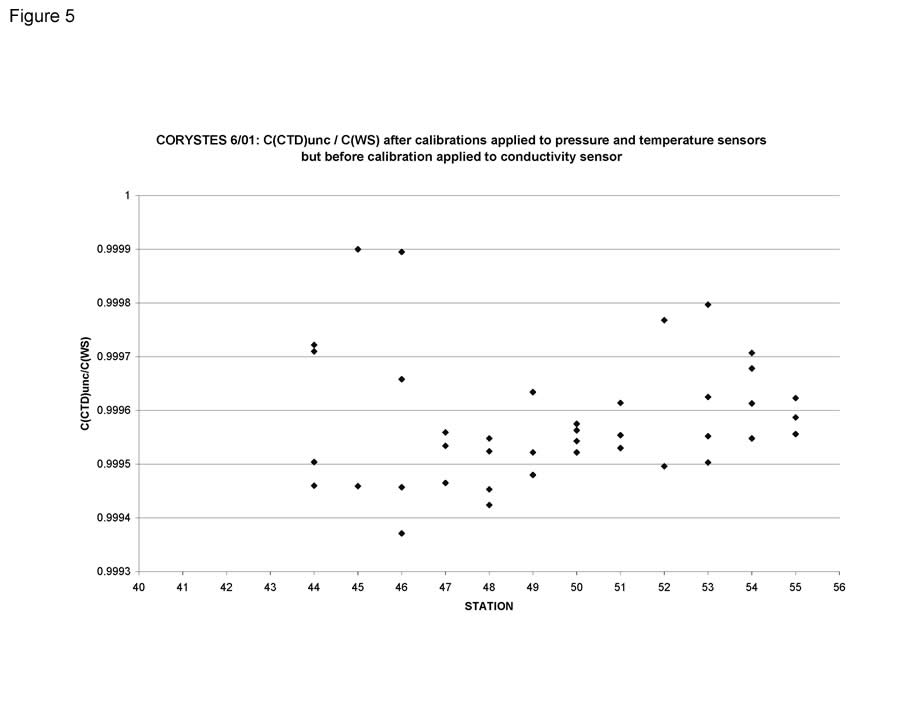
Figure 5 shows conductivity ratio(CTD)/ conductivity ratio(water samples), the water sample conductivity ratio being that from the salinometer salinity at the corrected pressure and temperature given by the CTD. The CTD conductivity is being under-estimated.
To compensate for this a least square fit was used to determine appropriate calibration coefficients:
CR(cor) = CR(ctd) [a*T(cor) + b*P(cor) + c]
where T(cor) and P(cor) are the corrected CTD temperature and pressure and
a = -1.55882535e-5, b = -1.20023935e-6, c = 1.00062251
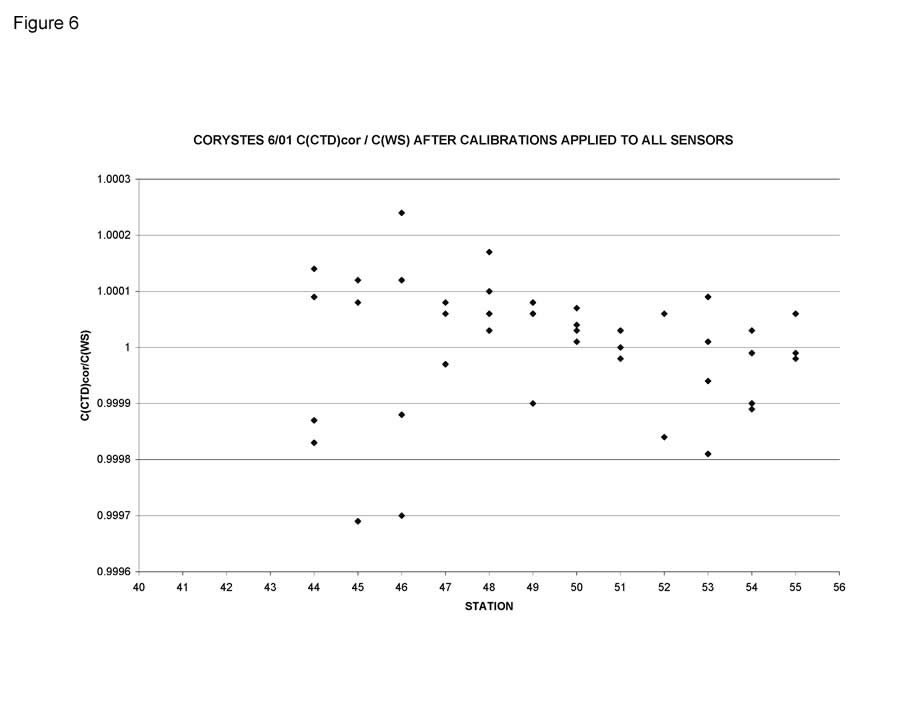
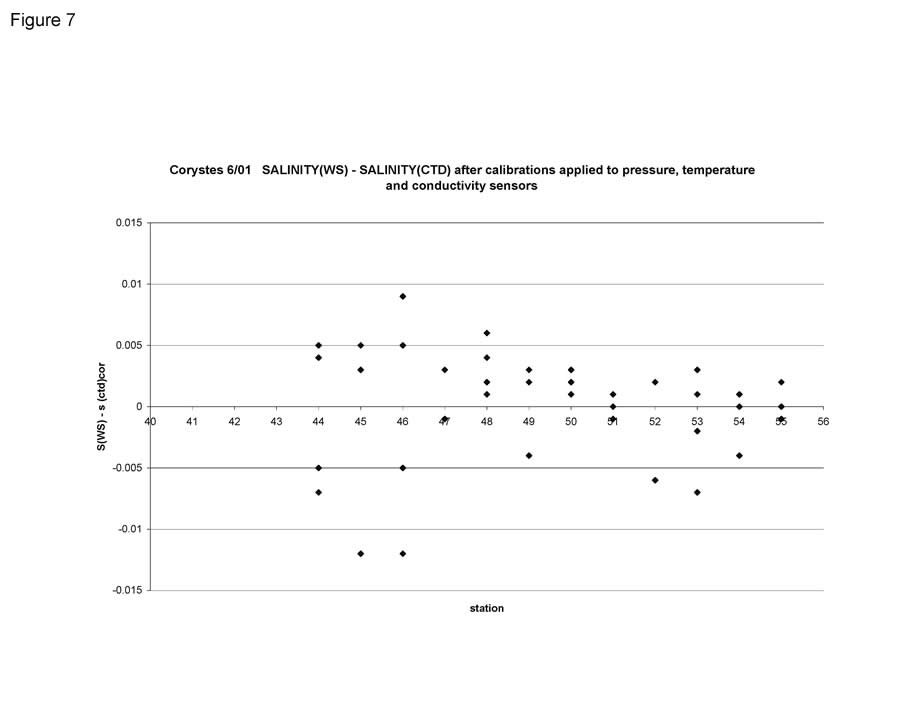
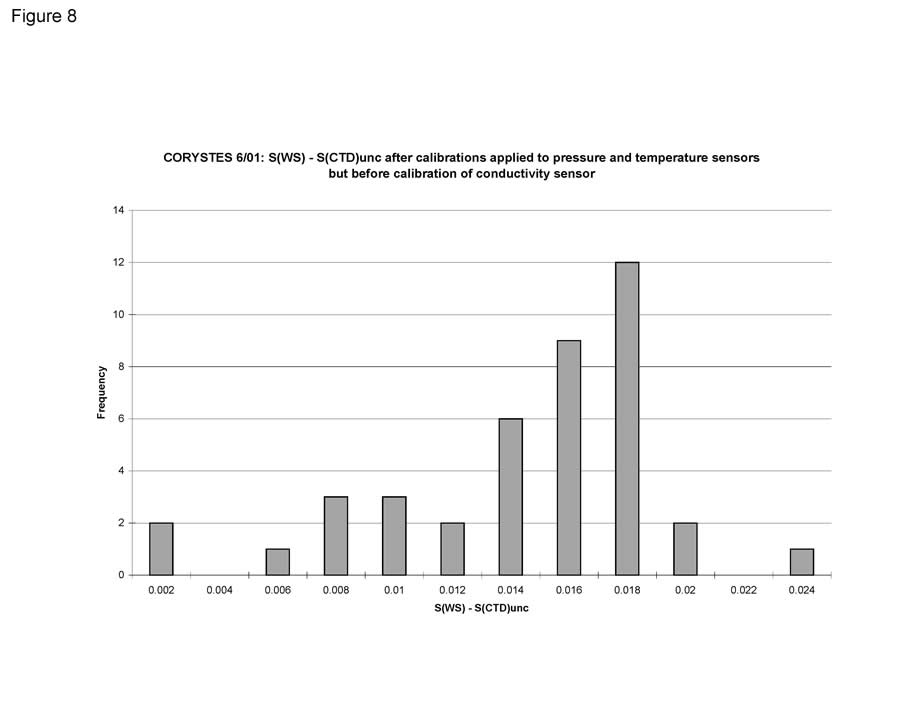
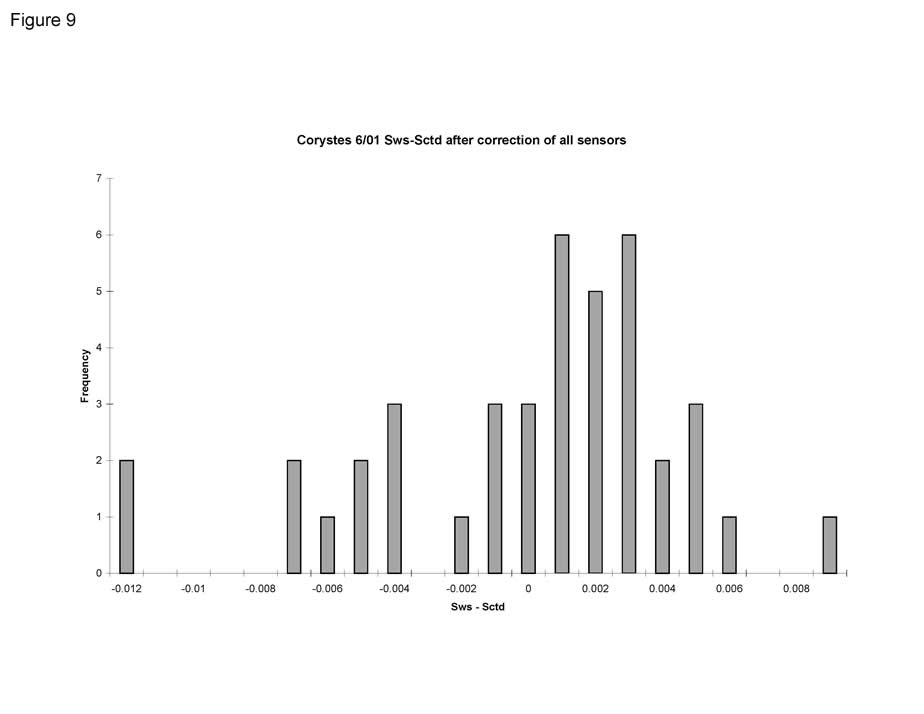
Using these coefficients the rms difference between water sample (salinometer) and corrected CTD salinity is 0.004 for 41 samples. Figures 6, 7, 8 and 9 show how effective these coefficients are in correcting the CTD salinity. The histograms of Figures 8 and 9 show the differences before and after the application of the conductivity coefficients. Figure 8 shows the differences after calibrations applied to temperature and pressure sensors; Figure 9 after temperature, pressure and conductivity calibrations have been applied. If it assumed that the CTD is accurate to 0.01 and the salinometer to 0.003 then differences of +/-0.013 are acceptable. In this instance all differences are within +/-0.013.
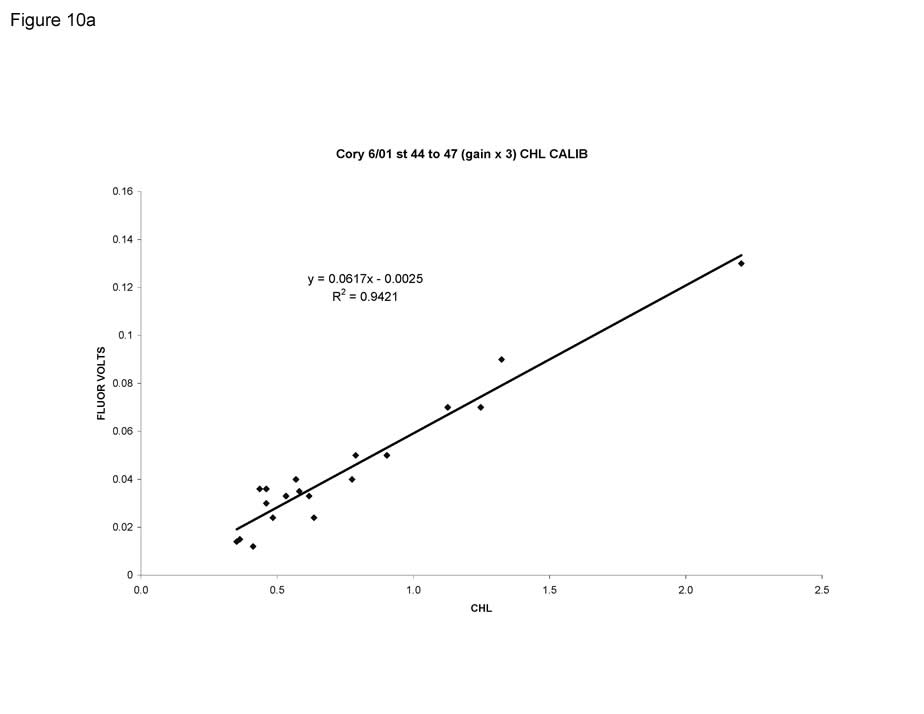
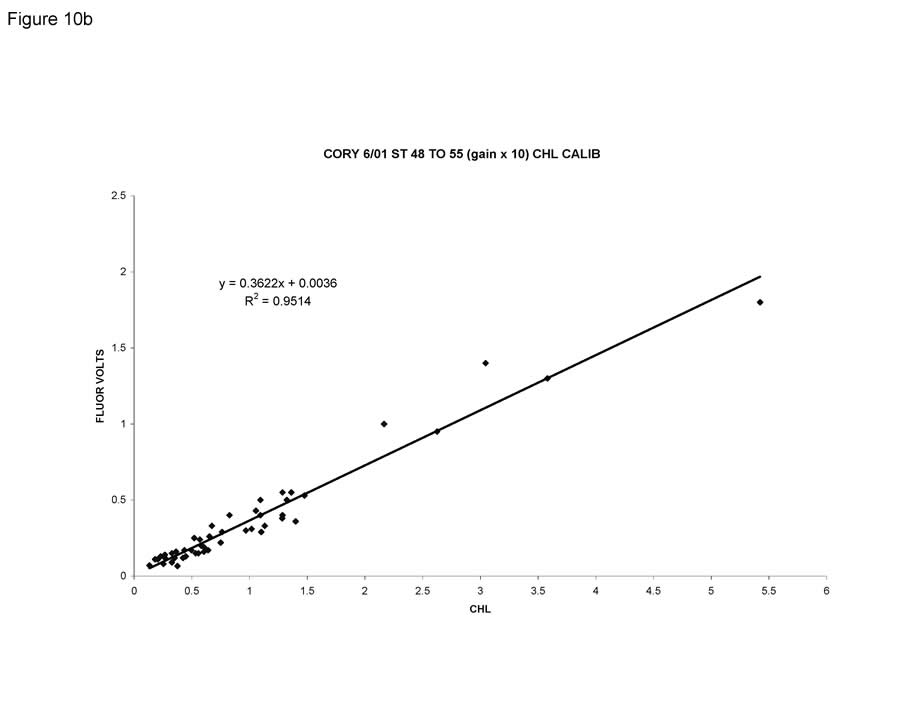
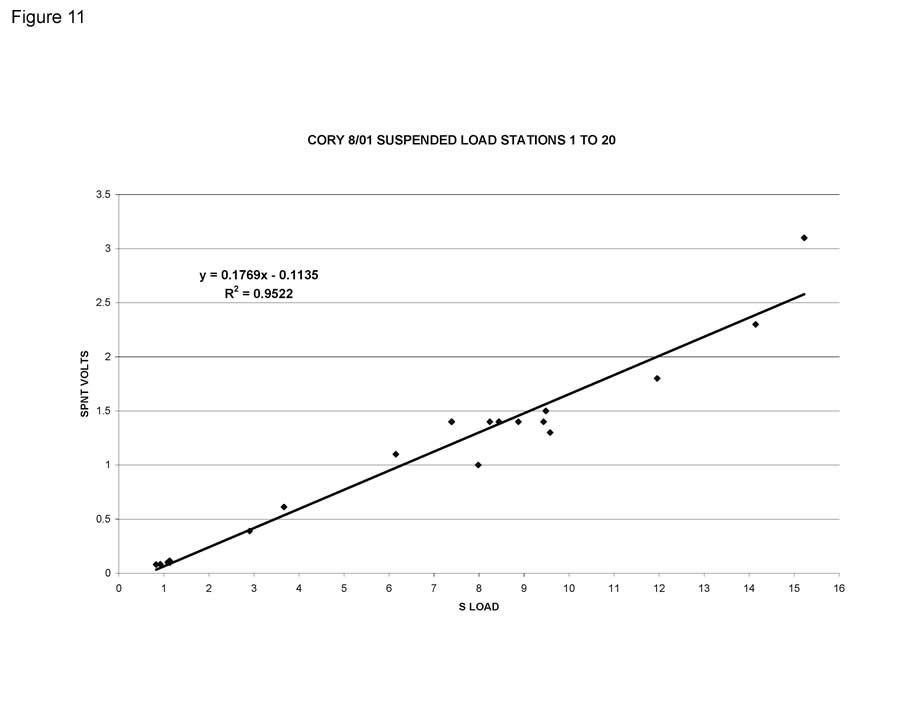
Fluorometer - Chlorophyll Calibration
A Seapoint fluorometer (s/n 2289) was fitted to the rosette sampler and used to estimate chlorophyll levels. The sensor was calibrated by comparing recorded voltages with measured chlorophyll of samples collected in Niskin bottles as the CTD returned to the surface. The instrument was operated on two ranges during the cruise, gain x 3 for stations 44 to 47, and gain x 10 for stations 48 to 55, giving 2 linear regression calibrations. See figures 10a and 10b.
Chlorophyll = a*Fluorometer (volts) + b
Stations 44 to 47 a = 16.21 and b= 0.041 R2 =0.94
Stations 48 to 55 a = 2.76 and b= 0.0099 R2 =0.95
Photosynthetically Active Radiation
The LICOR light sensor (s/n 5672) used to measure photosynthetically active radiation was calibrated during June 2001 using a standard lamp. This gave an in-air current of 0.819 microAmp per 217.1 micromolesm-2s-1, equivalent to 0.3499 micromolesm-2s-1 per nanoAmp in water.
Sue Norris
09/08/2001
General Data Screening carried out by BODC
BODC screen both the series header qualifying information and the parameter values in the data cycles themselves.
Header information is inspected for:
- Irregularities such as unfeasible values
- Inconsistencies between related information, for example:
- Times for instrument deployment and for start/end of data series
- Length of record and the number of data cycles/cycle interval
- Parameters expected and the parameters actually present in the data cycles
- Originator's comments on meter/mooring performance and data quality
Documents are written by BODC highlighting irregularities which cannot be resolved.
Data cycles are inspected using time or depth series plots of all parameters. Currents are additionally inspected using vector scatter plots and time series plots of North and East velocity components. These presentations undergo intrinsic and extrinsic screening to detect infeasible values within the data cycles themselves and inconsistencies as seen when comparing characteristics of adjacent data sets displaced with respect to depth, position or time. Values suspected of being of non-oceanographic origin may be tagged with the BODC flag denoting suspect value; the data values will not be altered.
The following types of irregularity, each relying on visual detection in the plot, are amongst those which may be flagged as suspect:
- Spurious data at the start or end of the record.
- Obvious spikes occurring in periods free from meteorological disturbance.
- A sequence of constant values in consecutive data cycles.
If a large percentage of the data is affected by irregularities then a Problem Report will be written rather than flagging the individual suspect values. Problem Reports are also used to highlight irregularities seen in the graphical data presentations.
Inconsistencies between the characteristics of the data set and those of its neighbours are sought and, where necessary, documented. This covers inconsistencies such as the following:
- Maximum and minimum values of parameters (spikes excluded).
- The occurrence of meteorological events.
This intrinsic and extrinsic screening of the parameter values seeks to confirm the qualifying information and the source laboratory's comments on the series. In screening and collating information, every care is taken to ensure that errors of BODC making are not introduced.
Project Information
No Project Information held for the Series
Data Activity or Cruise Information
Cruise
| Cruise Name | COR6/01 |
| Departure Date | 2001-06-26 |
| Arrival Date | 2001-07-03 |
| Principal Scientist(s) | Juan Brown (Centre for Environment, Fisheries and Aquaculture Science Lowestoft Laboratory) |
| Ship | RV Corystes |
Complete Cruise Metadata Report is available here
Fixed Station Information
No Fixed Station Information held for the Series
BODC Quality Control Flags
The following single character qualifying flags may be associated with one or more individual parameters with a data cycle:
| Flag | Description |
|---|---|
| Blank | Unqualified |
| < | Below detection limit |
| > | In excess of quoted value |
| A | Taxonomic flag for affinis (aff.) |
| B | Beginning of CTD Down/Up Cast |
| C | Taxonomic flag for confer (cf.) |
| D | Thermometric depth |
| E | End of CTD Down/Up Cast |
| G | Non-taxonomic biological characteristic uncertainty |
| H | Extrapolated value |
| I | Taxonomic flag for single species (sp.) |
| K | Improbable value - unknown quality control source |
| L | Improbable value - originator's quality control |
| M | Improbable value - BODC quality control |
| N | Null value |
| O | Improbable value - user quality control |
| P | Trace/calm |
| Q | Indeterminate |
| R | Replacement value |
| S | Estimated value |
| T | Interpolated value |
| U | Uncalibrated |
| W | Control value |
| X | Excessive difference |
SeaDataNet Quality Control Flags
The following single character qualifying flags may be associated with one or more individual parameters with a data cycle:
| Flag | Description |
|---|---|
| 0 | no quality control |
| 1 | good value |
| 2 | probably good value |
| 3 | probably bad value |
| 4 | bad value |
| 5 | changed value |
| 6 | value below detection |
| 7 | value in excess |
| 8 | interpolated value |
| 9 | missing value |
| A | value phenomenon uncertain |
| B | nominal value |
| Q | value below limit of quantification |
